









Quick Verdict
About Calian Group
Calian Group Ltd. (TSX: CGY) is an Ottawa-headquartered provider of mission-critical solutions for defence, space, healthcare and other strategic infrastructure markets. The company has operated for more than 40 years and employs more than 6,000 people globally. Its business is organized around Defence & Space and Essential Industries, combining technology, training, healthcare, nuclear, cybersecurity, satellite communications and professional-services capabilities.
The Q3 result reinforces Calian’s positioning in government-backed and infrastructure-critical end markets. Management highlighted sustained demand for defence and space offerings, alongside improving U.S. commercial and nuclear-services activity. As of June 30, 2026, Calian reported C$46.3 million in cash, C$141.3 million in debt-facility borrowings, and a net-debt-to-adjusted-EBITDA ratio of 0.9x.
Top Financial Highlights
- Total revenue reached a record C$230.4 million, up 20% from C$192.2 million a year earlier.
- Organic revenue growth was 16%, while acquisitions contributed roughly 4%.
- Adjusted EBITDA increased 35% to C$25.6 million.
- Adjusted EBITDA margin expanded to 11.1%, from 9.9% in Q3 fiscal 2025.
- IFRS gross profit rose 17% to C$78.5 million.
- Gross margin was approximately 34.1%, versus approximately 34.8% a year earlier, based on reported gross profit and revenue.
- IFRS net profit climbed to C$5.9 million, from C$0.6 million.
- Diluted IFRS EPS was C$0.51, compared with C$0.05 a year earlier.
- Adjusted net profit increased 40% to C$12.9 million; adjusted diluted EPS rose 39% to C$1.10, from C$0.79.
- Operating free cash flow increased 46% to C$17.5 million, with a 69% adjusted-EBITDA conversion rate.
- Defence & Space revenue grew 20%, almost entirely organically, with technology solutions accounting for about half of organic growth, according to management.
- Essential Industries revenue also rose 20%, with organic growth moving into double digits and adjusted EBITDA up 46%; segment margins approached 8%.
- New Q3 contract signings were C$168 million; year-to-date signings reached C$660 million.
- Ending backlog was C$1.4 billion, including C$1.0 billion in defence. Management said pro forma backlog, reflecting recent strategic activity, approached C$1.6 billion.
- Cash and cash equivalents were C$46.3 million at June 30, 2026.
- Calian raised its fiscal 2026 outlook to mid-teens revenue growth and low-20% adjusted EBITDA growth.
- The board declared a quarterly dividend of C$0.28 per share, payable September 9, 2026, to shareholders of record on August 26, 2026.
Calian Third Quarter of Fiscal 2026 Highlights
(Source: sites.calian.com)
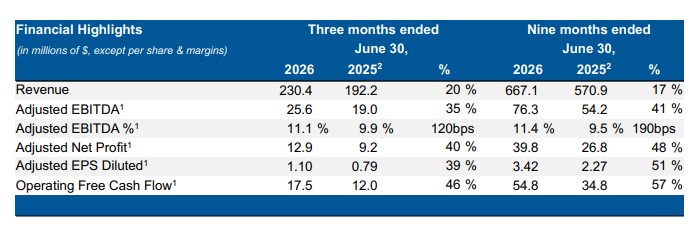
- The company’s Financial Highlights for the three months and nine months ended June 30, 2026, compared with the corresponding 2025 periods. For the three months, revenue increased 20% to $230.4 million, while adjusted EBITDA rose 35% to $25.6 million. Adjusted EBITDA margin improved by 120 basis points to 11.1%, indicating stronger operating efficiency.
- From an expert viewpoint, the nine-month results show even stronger earnings and cash-flow momentum. Revenue increased 17% to $667.1 million, while adjusted EBITDA grew 41% to $76.3 million, with the EBITDA margin expanding by 190 basis points to 11.4%. Adjusted net profit rose 48% to $39.8 million, adjusted diluted EPS increased 51% to $3.42, and operating free cash flow advanced 57% to $54.8 million.
- Overall, the results indicate that profitability and cash generation are growing faster than revenue, reflecting improved operating leverage and financial efficiency.
Beat or Miss?
| Metric | Reported | Difference/Analysis |
| Revenue | C$230.4 million | Approximately C$15.1 million above a reported consensus benchmark; revenue grew 19.9% year over year. |
| Adjusted diluted EPS | C$1.10 | Reportedly exceeded the C$0.82 consensus estimate by C$0.25, or about 34%. |
| Adjusted EBITDA | C$25.6 million | Up 35%, outpacing the 20% revenue increase and signaling operating leverage. |
| Adjusted EBITDA margin | 11.10% | Expanded 120 basis points from 9.9% in Q3 fiscal 2025. |
| Operating free cash flow | C$17.5 million | Up 46%, with 69% conversion of adjusted EBITDA. |
| Fiscal 2026 outlook | Mid-teens revenue growth; low-20% adjusted EBITDA growth | Management raised its outlook, reflecting stronger momentum and backlog visibility. |
What Leadership Is Saying
“Our third quarter results are a clear demonstration that our renewed and focused strategy on mission-critical solutions is delivering. Revenue grew 20%, including 16% organic growth, underpinned primarily by strong and sustained demand for our space and defence offerings.” — Patrick Houston, Chief Executive Officer
“In the third quarter, we generated C$18 million of operating free cash flow, representing a conversion rate from adjusted EBITDA of 69%… We ended the quarter with a net debt to adjusted EBITDA ratio of 0.9x, providing us with flexibility to act decisively on near-term opportunities.” — Will Majic, Acting Chief Financial Officer
Historical Performance
| Category | Q3 FY2026 | Q3 FY2025 | Change |
| Revenue | C$230.4 million | C$192.2 million | 19.90% |
| Net profit | C$5.9 million | C$0.6 million | 907% |
| Gross profit | C$78.5 million | C$66.9 million | 17.40% |
| Selling, general and administrative expense | C$49.1 million | C$44.7 million | 10.00% |
| Adjusted EBITDA | C$25.6 million | C$19.0 million | 34.80% |
| Operating free cash flow | C$17.5 million | C$12.0 million | 46.20% |
How the Market Reacted?
The earnings release itself did not state an intraday share-price movement. However, third-party market coverage reported that Calian shares rose about 10.2% to C$94.05 after the results, approaching a reported 52-week high of C$95.41. The market response appears to reflect the combination of a revenue and adjusted EPS beat, EBITDA-margin improvement, raised fiscal-2026 outlook, and strategic contract and acquisition developments.

Sources


