






Introduction
Online Gambling Statistics: Online gambling is expanding quickly as more players shift from land-based betting to app- and web-based platforms. Recent market research estimates the global online gambling market at USD 78.66 billion in 2024, with forecasts reaching USD 153.57 billion by 2030 (an 11.9% CAGR from 2025–2030), supported by wider high-speed internet access and everyday smartphone use. Mobile is a major channel: in many countries, mobile users account for about 80% of online gambling users, reinforcing a “phone-first” growth path for operators.
Europe remains the largest regional market, with published estimates ranging from about 41% to about 49% share in 2024, depending on the study. However, the sector’s growth is matched by rising harm concerns; the U.S. benchmarks from the National Council on Problem Gambling estimate USD 14 billion in annual social costs and up to 10.5 million Americans affected by gambling addiction.
Hand-Picked By The Editor
- The global online gambling market was valued at USD 117.5 billion in 2025, and it is forecast to reach USD 153.57 billion by 2030, indicating strong growth momentum.
- Europe is the largest regional market, with published estimates commonly placing its global share between 41% and 49.1%.
- Smartphones are being seen as a primary growth driver as gambling activity shifts toward phone-first usage, supported by wider high-speed internet access and higher app adoption.
- Mobile is increasingly being used as the dominant channel for online gambling activity, especially within the online segment, where gameplay and betting are being optimised for handheld devices.
- Sports betting is frequently reported as the largest game type in market studies, and it is often estimated to account for about 50% of online gambling revenue.
- In Great Britain, a clear channel shift has been reported because online gambling, excluding lotteries, now represents over 50% of total gambling yield, commonly referenced as GGY.
- In the U.S., growth is being supported by ongoing legalisation and state-by-state expansion, with mobile betting availability identified as a key driver of adoption.
- In 2023, U.S. internet gambling revenue was USD 6.17 billion, and sports betting revenue was USD 10.92 billion; by 2024, sports betting revenue had climbed to roughly USD 13.7 billion and total online gaming revenue to about USD 21.5 billion.
- Online participation in the U.S. is reported to be rising, with NCPG survey findings indicating an increase from 15% in 2018 to 22% in 2024.
- Gambling-related harm remains a major constraint, with the U.S. annual social cost of problem gambling estimated at around USD 14 billion.
- NCPG reporting suggests gambling addiction may affect approximately 7.5 million to 10.5 million Americans, including high-risk groups.
Global Gambling Market In 2026
- The revenue for the Gambling industry is expected to total USD 655.31bn in 2026.
- Revenue is expected to grow annually at a rate of 2.28%, reaching a forecasted market volume of USD 717.06bn in 2030.
- The Lottery & bingo segment is expected to have a forecasted market volume of USD 352.32bn in 2026.
- Compared globally, the vast majority of the revenue will be produced in the United States (USD 216.85bn in 2026).
- The average revenue per user (ARPU) in the Gambling industry is expected to reach USD 653.31 in 2026.
- For the Gambling industry, the number of users is expected to reach 1.1bn in 2030.
- The user penetration in the Gambling industry will reach 12.8% in 2026.
Online Gambling Market
- The global online gambling market was valued at USD 117.5 billion in 2025 and is projected to expand to USD 253.57 billion by 2030.
- The market is expected to grow from USD 117.5 billion in 2025, adding USD 11.28 billion in one year
- DemandSage reports 2029, the market is projected to reach USD 186.58 billion, showing that growth is expected to stay strong through the end of the forecast window.
- Smartphones are the main way people gamble online, with around 80% of online gambling users using a mobile phone across multiple countries.
- Total growth from 2024 to 2029 is estimated at USD 80.36 billion, which is roughly a 75.6% increase over five years.
- The jump from 2024 to 2025 alone suggests faster near-term growth, as the market adds USD 11.28 billion in a single year.
Online Gambling by Country
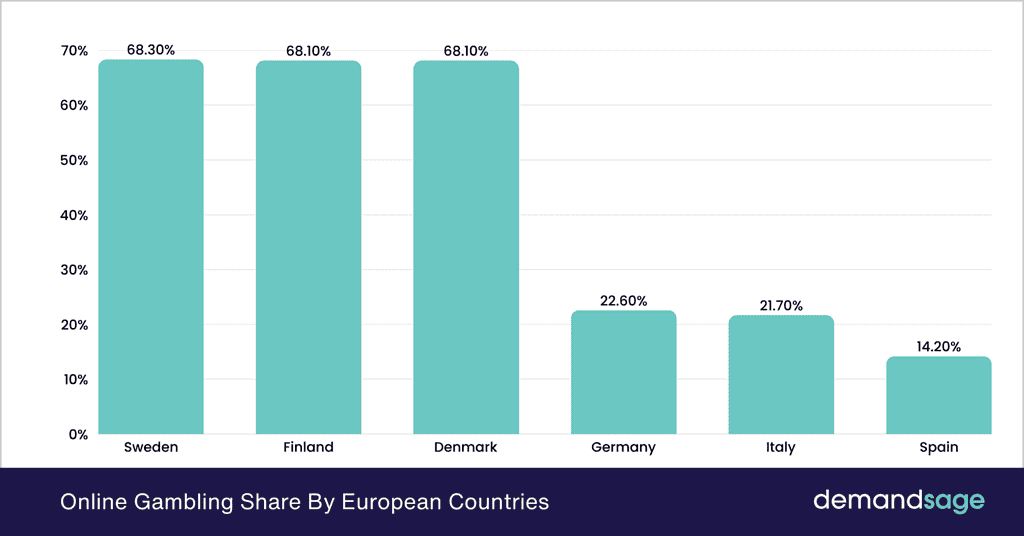
- According to iMarc, Europe leads the global online gambling market with over 49.1% share.
- As reported in the country figures provided, Italy is Europe’s largest overall gambling market, with USD 22.89 billion in total gambling revenue and USD 5.01 billion from online gambling.
| Country | Total Gambling Revenue (USD) | Online Gambling Revenue (USD) |
| Italy | USD 22.89 billion | USD 5.01 billion |
| United Kingdom | USD 21.58 billion | USD 12.10 billion |
| Germany | USD 15.70 billion | Not Specified |
| France | USD 15.26 billion | USD 4.14 billion |
- As published in the same dataset, the UK shows the strongest online shift, generating USD 12.10 billion in online gambling revenue out of USD 21.58 billion total.
- France earns USD 15.26 billion in total gambling revenue, including USD 4.14 billion from online gambling.
- As reported in the table, Germany records USD 15.70B in total gambling revenue,
(Source: DemandSage)
- Even though land-based gambling remains bigger in most European nations, the UK holds the distinction of generating high revenues through the internet.
- The U.S. online gambling market expanded from USD 2.5 billion (2018) to close to USD 48 billion (2025).
- The U.S. market is expected to expand to almost USD 40 billion in 2029, due to increased digitalization.
- 7 states have legalized online casino games and poker, while 30 states have legalized online sports betting during 2018-2025.
- Roughly 60% of the U.S. has legalized some form of online gambling.
U.S. Gambling Revenue Trend
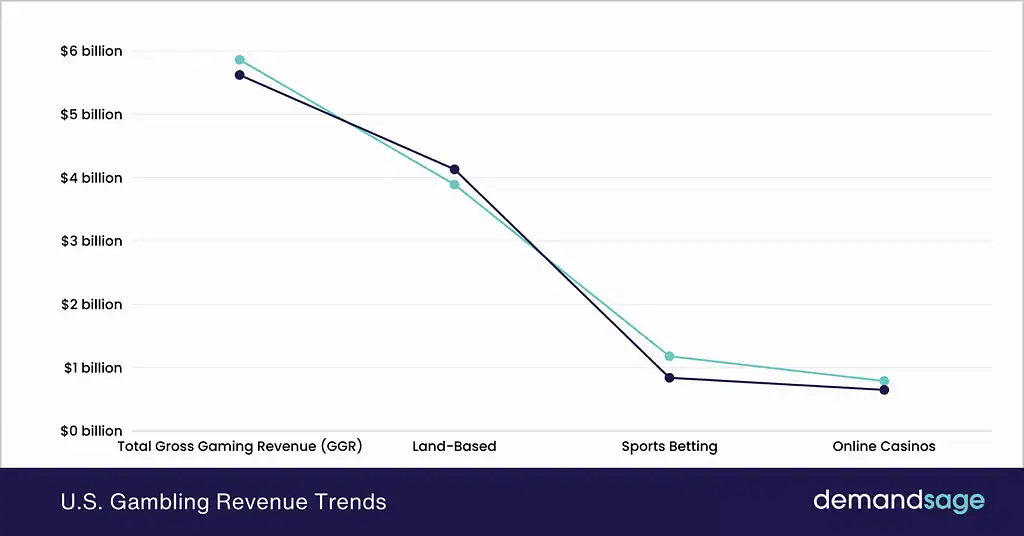
- Total U.S. gross gaming revenue (GGR) reached USD 5.86 billion in February 2025, up 4.2% from USD 5.62 billion in February 2024.
- For January–February 2025 combined, total GGR was USD 12.42 billion, up 8.5% from USD 11.45 billion in the same period of 2024.
- Land-based gambling revenue fell in February 2025 to USD 3.89 billion, down 5.8% from USD 4.13 billion in February 2024.
(Source: DemandSage)
- Even with the February dip, land-based revenue rose slightly over the first two months, reaching USD 7.96 billion in Jan–Feb 2025, up from USD 7.87 billion in Jan–Feb 2024 (+1.1%).
- The sports wagering market recorded the highest percentage increase in February 2025, reaching USD 1.18 billion, up by 39.8% from USD 0.84 billion a year ago.
- Sports wagering revenue for January and February collectively stood at USD 2.83 billion, compared with USD 2.30 billion last year (+23.2%).
- Online casino revenue also grew strongly in February 2025, reaching USD 0.7885 billion, up 21.5% from USD 0.649 billion in February 2024.
- For Jan–Feb, online casino revenue climbed to USD 1.62 billion, up from USD 1.27 billion in Jan–Feb 2024 (+27.9%).
Table summarising the U.S. gambling revenue trends as of 2025:
| Revenue Category | February 2025 | February 2024 | Y-O-Y* Change | January-February 2025 | January-February 2024 | Y-O-Y* Change |
| Total Gross Gaming Revenue (GGR) | USD 5.86 | USD 5.62 | +4.2% | USD 12.42 | USD 11.45 | +8.5% |
| Land-Based | USD 3.89 | 4.13 | -5.8% | USD 7.96 | 7.87 | +1.1% |
| Sports Betting | USD 1.18 | 0.84 | +39.8% | USD 2.83 | 2.30 | +23.2% |
| Online Casinos | USD 0.7885 | 0.649 | +21.5% | USD 1.62 | 1.27 | +27.9% |
| Slot Machine | N/A | N/A | N/A | USD 7.96 | 7.87 | +1.1% |
U.S. Online Gambling Revenue by State
- The American Gaming Association reported that total U.S. gross gaming revenue (GGR) reached USD 5,864.3 million in February 2025.
- The American Gaming Association also announced that year-to-date (January–February 2025), GGR totalled USD 12,422.4 million, a +8.5% increase versus the same period last year.
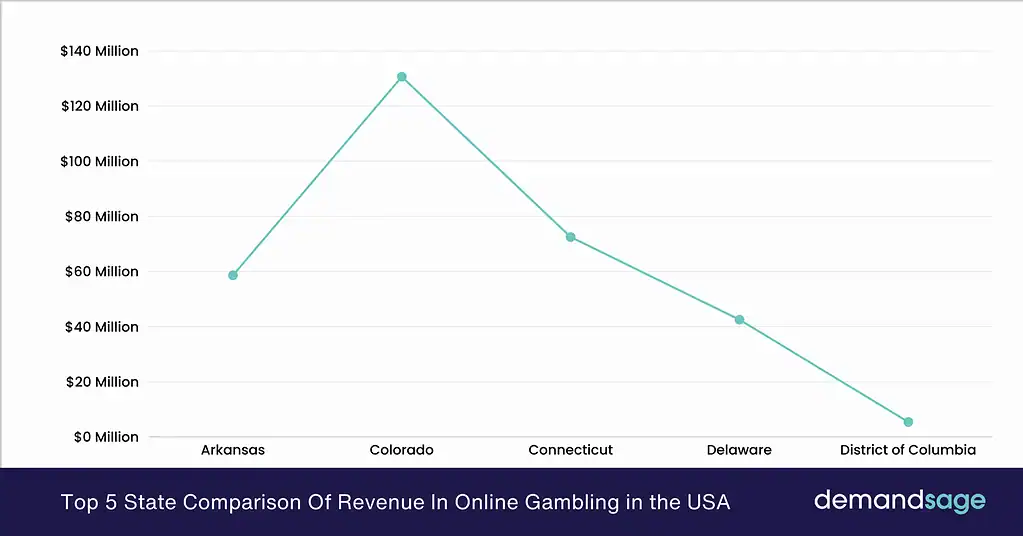
The top 5 states/areas in the visual comparison for February revenue were:
(Source: DemandSage)
- The biggest February 2025 revenue states in the table were:
- Nevada: USD 1,217.7M (Feb change -9.3%; YTD USD 2,657.0M, +1.4%)
- Pennsylvania: USD 551.0M (YTD USD 1,164.9M, +7.4%)
- New Jersey: USD 486.6M (YTD USD 1,040.4M, +1.9%)
- New York: USD 423.5M (YTD USD 921.2M, +11.4%)
- Michigan: USD 367.4M (YTD USD 803.4M, +24.1%)
- Several markets showed fast year-over-year growth in February 2025, including:
- District of Columbia: +344.0% (from a small base)
- Nebraska: +95.1%
- Kansas: +58.1%
- Kentucky: +53.3%
- Virginia: +32.2%
- Some states in America declined in February 2025, such as:
- Nevada: -9.3%
- Mississippi: -8.3%
- Massachusetts: -7.7%
- Maine: -6.3%
- Iowa: -5.3%
| State | Feb 2025 (USD M) | Annual Change | YTD 2025 (USD M) | YTD Change |
| Arkansas | 58.6 | +0.8% | 116.8 | +7.1% |
| Colorado | 130.6 | +17.0% | 272.4 | +8.8% |
| Connecticut | 72.5 | +25.8% | 153.7 | +23.9% |
| Delaware | 42.5 | 0.0% | 84.3 | +7.6% |
| District of Columbia | 5.4 | +344.0% | 16.6 | +426.7% |
| Florida | 58.5 | -0.1% | 118.3 | +0.7% |
| Illinois | 269.4 | +21.8% | 560.6 | +18.0% |
| Indiana | 237.2 | 0.0% | 483.6 | +4.7% |
| Iowa | 148.6 | -5.3% | 307.6 | +4.1% |
| Kansas | 67.6 | +58.1% | 126.4 | +34.6% |
| Kentucky | 29.9 | +53.3% | 63.5 | +14.5% |
| Louisiana | 259.5 | +15.0% | 493.4 | +11.8% |
| Maine | 17.0 | -6.3% | 37.1 | +4.6% |
| Maryland | 215.1 | +6.1% | 449.0 | +3.0% |
| Massachusetts | 142.5 | -7.7% | 336.8 | +5.0% |
| Michigan | 367.4 | +13.7% | 803.4 | +24.1% |
| Mississippi | 189.5 | -8.3% | 374.9 | -3.1% |
| Missouri | 149.3 | -4.9% | 289.3 | -1.1% |
| Montana | 0.2 | -26.8% | 1.5 | +33.4% |
| Nebraska | 16.8 | +95.1% | 34.5 | +117.2% |
| Nevada | 1,217.7 | -9.3% | 2,657.0 | +1.4% |
| New Hampshire | 8.0 | +21.5% | 19.1 | +16.7% |
| New Jersey | 486.6 | +5.4% | 1,040.4 | +1.9% |
| New Mexico | 22.5 | +3.2% | 43.5 | +2.2% |
| New York | 423.5 | +10.4% | 921.2 | +11.4% |
| North Carolina | 55.7 | – | 130.2 | – |
| Ohio | 265.6 | +0.8% | 565.9 | +2.3% |
| Oklahoma | 12.5 | -0.9% | 24.7 | +2.9% |
| Oregon | 8.3 | +29.5% | 19.2 | +27.8% |
| Pennsylvania | 551.0 | +1.1% | 1,164.9 | +7.4% |
| Rhode Island | 56.1 | +0.3% | 118.3 | +5.7% |
| South Dakota | 10.5 | -6.8% | 21.2 | -3.8% |
| Tennessee | 49.3 | +35.8% | 116.2 | +23.2% |
| Vermont | 2.4 | -5.7% | 5.6 | -16.5% |
| Virginia | 142.0 | +32.2% | 301.7 | +28.6% |
| West Virginia | 72.6 | +12.2% | 141.7 | +12.0% |
| Wyoming | 2.1 | +8.2% | 5.0 | +8.5% |
Sports Betting Revenue And User Profile Highlights
- According to Statista, the global sports betting and lottery market was valued at over USD 235 billion, down from USD 242.82 billion in 2021.
- The market was expected to recover to around USD 242 billion in 2023, suggesting demand was stabilising after the earlier decline.
- As reported by Emerald, women made up 33% of surveyed sports bettors, and 50.8% of these women were in the 22–24 age group.
- The Emerald survey says that about 1 in 6 sports bettors is a woman aged 22–24 (33% × 50.8% ≈ 16.8%).
- The sports wagering market recorded the highest percentage increase in February 2025, reaching USD 1.18 billion, up by 39.8% from USD 0.84 billion a year ago.
- Sports wagering revenue for January and February collectively stood at USD 2.83 billion, compared with USD 2.30 billion last year (+23.2%).
- The gender gap in sports betting participation is about 15 % points, indicating that men participate more than women.
Top Gambling Websites
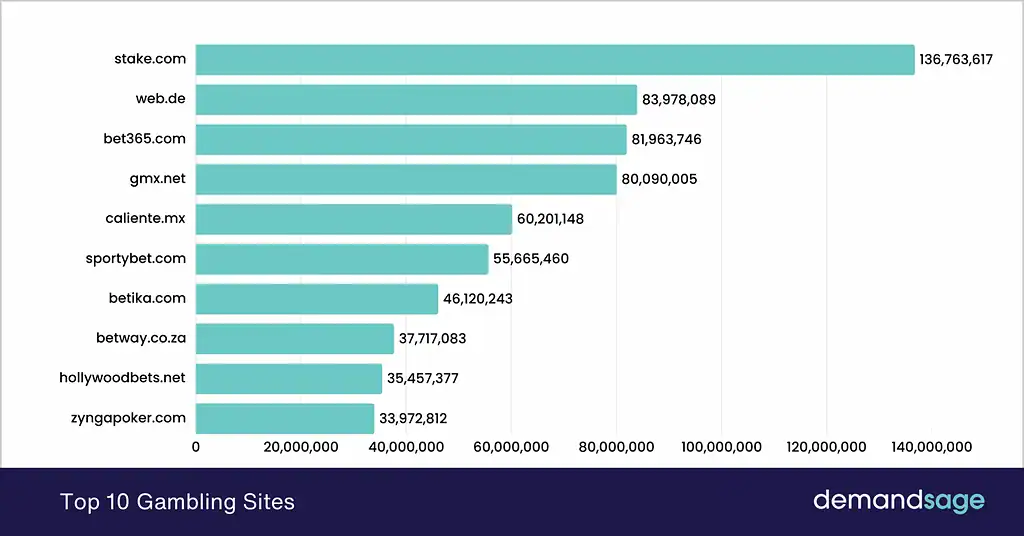
- According to Semrush, stake.com ranks #1 in traffic with 136.76 million visits, making it the most visited site on this top-10 list.
- web.de is #2 with 83.98 million visits and a relatively low 21.86% bounce rate, which suggests many visitors continue beyond the first page.
- The website bet365.com recorded 81.96 million visits, but its bounce rate was 42.40%, indicating a higher share of users leaving after one page.
(Source: DemandSage)
- gmx.net attracted 80.09 million visits and has a strong browsing depth at 7.09 pages per visit.
- caliente.mx generated 60.20 million visits, but it has the highest bounce rate on the list at 53.10%, which may indicate quick, task-based visits.
- sportybet.com shows high engagement with 8.89 pages per visit on 55.67 million visits.
- According to Semrush, betika.com has the highest engagement at 14.49 pages per visit (across 46.12 million visits), indicating very active users.
- betway.co.za logged 37.72 million visits with 4.45 pages per visit and a 44.66% bounce rate.
- hollywoodbets.net recorded 35.46 million visits and a mid-range 4.93 pages per visit.
- zyngapoker.com has the lowest engagement at 1.65 pages per visit and the highest bounce rate at 66.85%, which often fits single-purpose or quick-session behaviour.
The Top 10 Gambling Sites in 2025
| Rank | Website | Visits | Pages/Visit | Bounce Rate |
| 1 | stake.com | 136,763,617 | 7.75 | 41.71% |
| 2 | web.de | 83,978,089 | 7.28 | 21.86% |
| 3 | bet365.com | 81,963,746 | 4.33 | 42.40% |
| 4 | gmx.net | 80,090,005 | 7.09 | 20.53% |
| 5 | caliente.mx | 60,201,148 | 3.14 | 53.10% |
| 6 | sportybet.com | 55,665,460 | 8.89 | 22.67% |
| 7 | betika.com | 46,120,243 | 14.49 | 24.68% |
| 8 | betway.co.za | 37,717,083 | 4.45 | 44.66% |
| 9 | hollywoodbets.net | 35,457,377 | 4.93 | 41.96% |
| 10 | zyngapoker.com | 33,972,812 | 1.65 | 66.85% |
Gambling Addiction and Harm
- Around 450 million people worldwide may face gambling-related harm or problem gambling behaviours.
- A more severe condition of gambling disorder may affect at least 80 million people globally.
- As stated by The Guardian, roughly 1 out of every 6 gamblers with a gambling problem is from the United States (based on an estimate of 80 million).
- Nevada Council estimates that within the population seeking treatment for gambling disorder, 50% of the people have suicidal tendencies, and 17% had at least once tried committing suicide.
- Roughly 1% of all U.S. adults (approximately 2.5 million people) suffer from a gambling disorder every year.
- Also, about 2% to 3% of all U.S. adults (approximately 5 to 8 million people) could be suffering from some sort of gambling problem.
- The total at-risk population in the U.S. is estimated at 10.5 million people in 2025.
- About 85% of U.S. adults have gambled at least once in their lifetime.
- Based on the figures provided, 3%–4% of the U.S. population may experience gambling-related harm annually, with an estimated USD 14 billion in social costs.
Global Gambling Loss Outlook
- Global consumer losses to the gambling industry are projected to reach nearly USD 700 billion by 2028.
- This sharp rise is mainly linked to the rapid growth of online gambling, which makes betting easier and more accessible worldwide.
- From a research analyst’s view, these losses reflect how frequently people place bets and how digital platforms increase spending through fast payments, in-play betting, and 24/7 access.
- In simple terms, the average gambler is expected to lose more over time because online gambling continues to expand and attract more users.
Online Gambling Participation
Online gambling participation varies widely worldwide, with clear differences across global adoption, gender-based behaviour, and regional usage patterns.
Global Trends
- Approximately 1 out of 5 individuals in the world have participated in online gambling, equivalent to 17.6% of adults.
- The percentage means that about 882 million people participate in gambling over the internet.
- The traditional form of gambling holds a greater population base, with approximately 2.3 billion people, compared to 40% of people participating in online gambling.
Gender Trends
- Men are more likely to gamble online, with 20.4% of men reporting online gambling.
- Women report a lower online participation rate at 11.2%.
- Looking at overall gambling (online + offline), participation is 49.1% for men versus 37.4% for women, showing a clear gender gap.
Regional Trends
- North America leads in online gambling adoption at 33.1% (about 1 in 3 adults).
- Western Europe follows at 24.6% (nearly 1 in 4 adults).
- Australasia reports 19.5%, while Eastern Europe stands at 16.6%.
- East & Southeast Asia have a lower online rate at 9.2%, despite having a large total gambling population.
- Latin America is at 4.7%, and Africa is at 4.1%, meaning North America’s online rate is roughly 8× higher than Africa’s.
Wrapping Up
Online gambling is now a mainstream activity, with roughly one in five adults participating globally and hundreds of millions of users. Growth is uneven: North America and Western Europe lead adoption, while regions such as Africa and parts of Asia remain far lower, likely due to access and legal differences. The gender gap is clear, with men participating at nearly double the rate of women.
Overall, the data points to a fast-expanding digital market that is reshaping how people gamble. Going forward, stronger consumer safeguards, clearer regulations, and better public education are needed to reduce harm while the market continues to scale.
FAQ
China, despite being home to the largest number of gambling addicts in absolute terms (about 60 million), the proportion of its total population remains low at approximately 4%. Canada: it ranks second in terms of the number of gamblers with problems seeking assistance, having significant participation in online and offline gambling.
Compulsive gambling occurs mostly among young and middle-aged individuals. Gambling in childhood or adolescence leads to increased chances of becoming a compulsive gambler. But compulsive gambling in older adults may also be an issue.
The most addictive form of gambling has been traditional slot machines.

Sources