Introduction
Gas Statistics: Gas statistics is a branch of science that examines how a very large number of gas particles behave collectively. One gas molecule is extremely small and moves very quickly, so it is almost impossible to follow it alone. However, when we study numerous molecules collectively, we can observe regular patterns. Using basic concepts from probability and statistics, scientists can describe the properties of gases, such as pressure, temperature, and volume.
In this article, we will examine various types of gas analysis. These include various types, such as greenhouse gases, elemental gases, gas mixtures, poisonous gases, fuel gases, industrial gases, and biogas. By understanding these types, we can better control gases in factories, protect health and safety, and care for the environment. This article presents several current analyses of the global Gas market from different sources, helping readers better understand the topic.
Editor’s Choice
- The global natural gas generator market size is estimated to reach around USD 11 billion by 2025.
- In 2024, the world’s proven natural gas reserves showed that the OECD Americas held 20.66 (1,000 billion standard cubic meters), accounting for 9.89% of the global total.
- The total global natural gas production reached 4,288.56 billion standard cubic meters, accounting for 100% of the world’s output.
- In September 2025, natural gas consumption totalled 5,642 MMSCM, with net production of 2,824 MMSCM and LNG imports of 2,819 MMSCM.
- As of 2024, the five countries that produce the most natural gas are the United States (32.5 Exajoules), followed by Russia (17.2 exajoules), China (15.6 exajoules), Iran (8.8 exajoules), and Canada (4.6 exajoules).
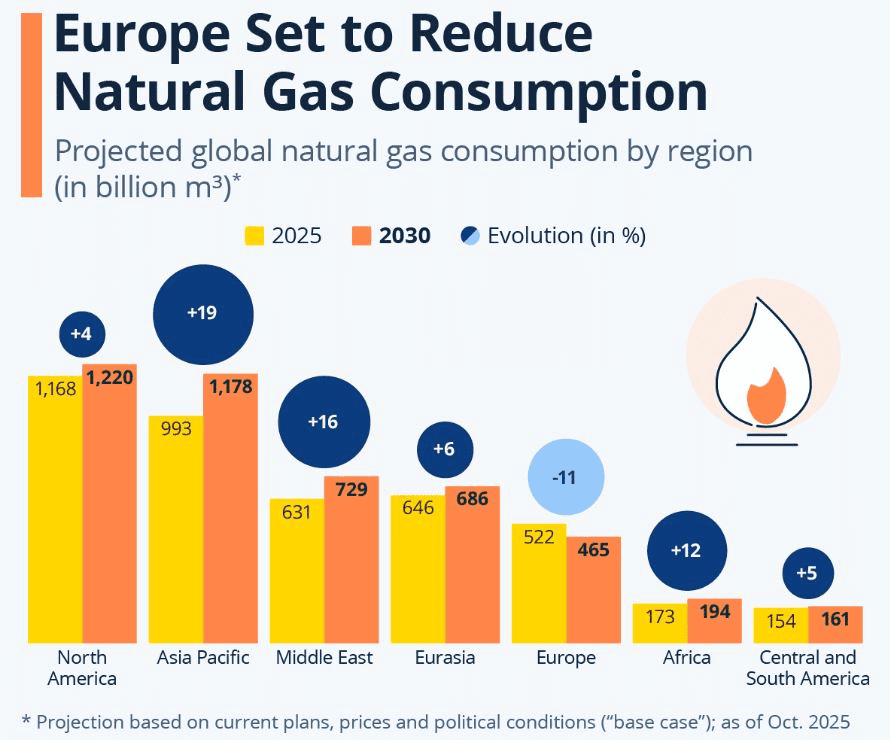
- In North America, global natural gas consumption is expected to rise from 1,168 billion cubic meters in 2025 to 1,220 billion cubic meters by 2030.
- As of 2025, the electric power sector accounts for the largest share of the United States’ natural gas consumption, at 37.5%.
- On November 18, 2025, natural gas prices were USD 4.3343 per MMBtu.
- Global Energy Monitor’s Global Gas Infrastructure Tracker reports 4,158 gas pipelines totalling about 1.49 million km worldwide in 2025.
- UNEP’s Emissions Gap Report 2025 notes that global GHG emissions (including all gases and land-use) reached 57.7 GtCO2e in 2024, 2.3% above the 2023 level.
- According to Edgar.jrc.ec.europa.eu, by 2024, total global GHG emissions from all sectors were 65% higher than in 1990, 30% higher than in 2005, and 1% higher than in 2023.
- A report published by the Global Carbon Budget estimated that in 2025, the United States’ CO2 emissions are projected to rise by 1.9%.
- The NASA Science report further states that in 2025, dry air near Earth’s surface contains approximately 78.08% nitrogen, 20.95% oxygen, 0.93% argon, and trace amounts of other gases.
- In 2025, the market size of gas mixtures is estimated to reach around USD 44.91 billion, from USD 42.1 billion in 2024.
- According to a Future Market Report study, the toxic gas detection market is valued at about USD 7,850.47 million in 2024 and is expected to grow to around USD 13,850.32 million by 2032.
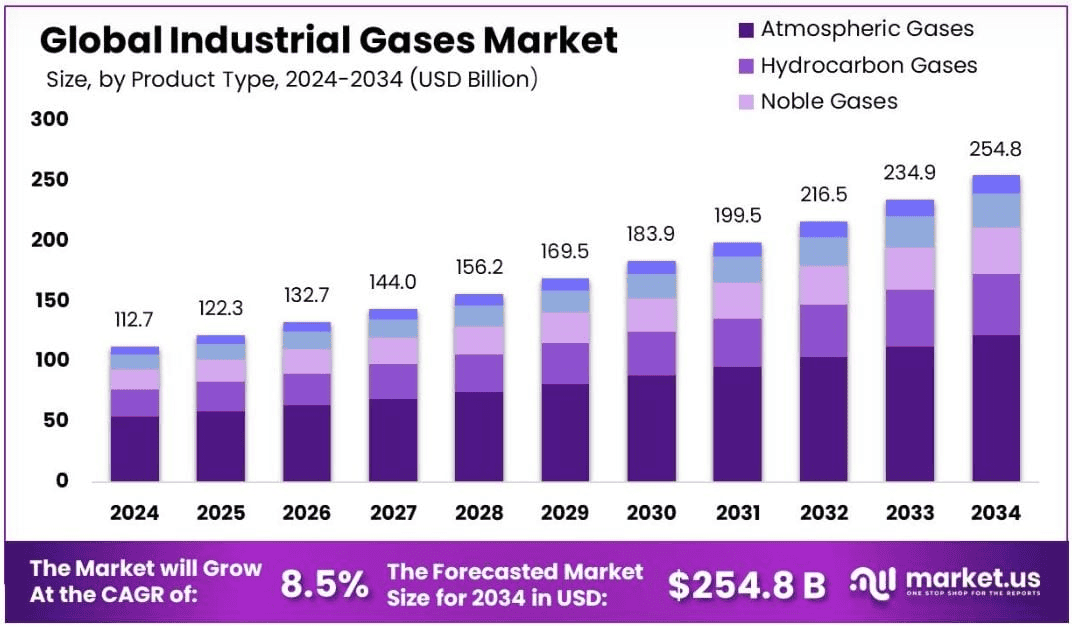
- In 2025, the global Industrial Gases market is estimated at USD 122.3 billion, and by 2034, it is expected to reach USD 254.8 billion.
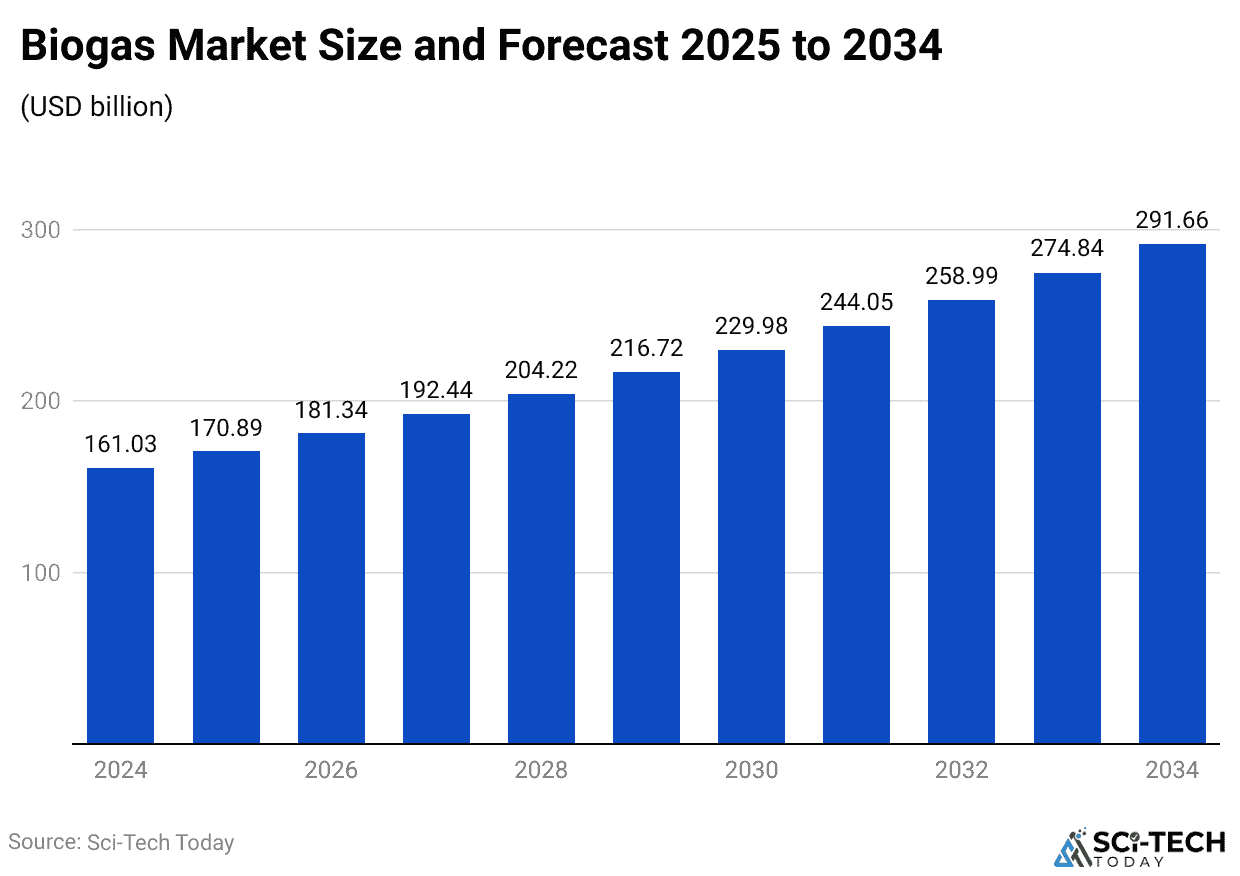
- The global valuation of the Biogas market is expected to reach approximately USD 170.89 billion by 2025 and USD 291.66 billion by 2034.
Natural Gas Generator Market Size Analysis
(Reference: market.biz)
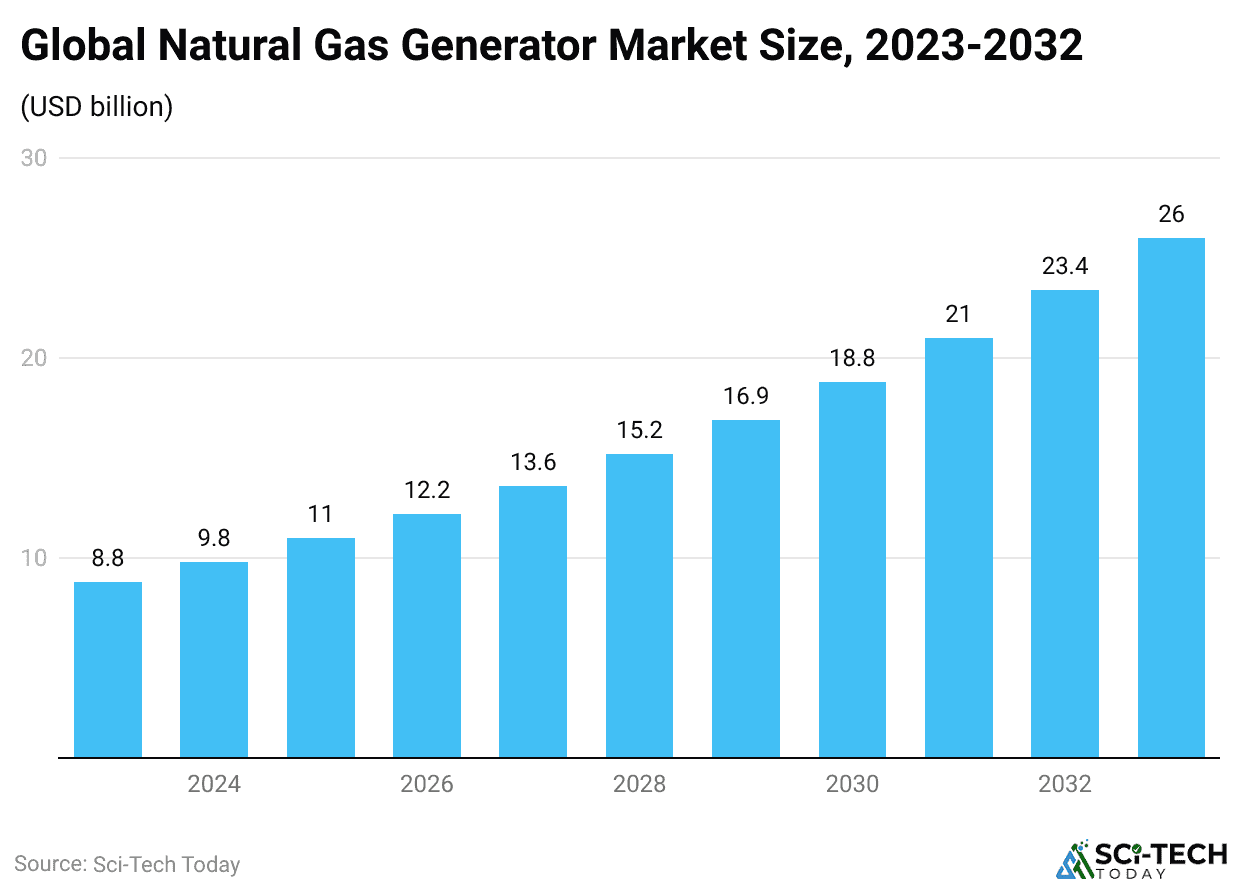
- The global natural gas generator market size is estimated to reach around USD 11 billion by 2025.
- The market will grow at a CAGR of 11.4% from 2025 to 2032.
- The market size in the coming years is expected to be 2026 (USD 12.2 billion), 2027 (USD 13.6 billion), 2028 (USD 15.2 billion), 2029 (USD 16.9 billion), 2030 (USD 18.8 billion), 2031 (USD 21 billion), 2032 (USD 23.4 billion), and 2033 (USD 26 billion).
World Proven Natural Gas Reserves, 2024
(Reference: publications.opec.org)
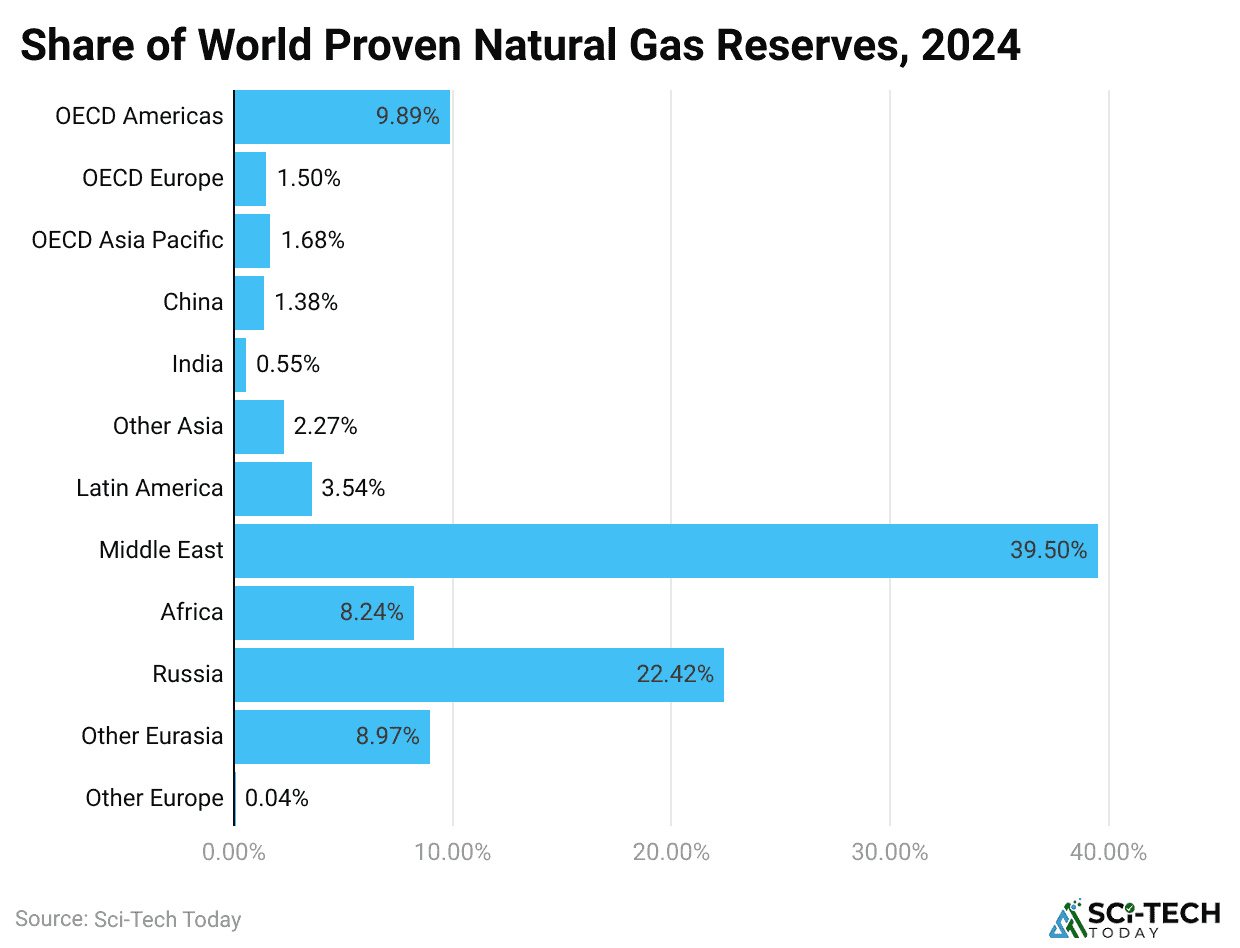
- In 2024, the world’s proven natural gas reserves showed that the OECD Americas held 20.66 (1,000 billion standard cubic meters), accounting for 9.89% of the global total.
- OECD Europe has a rate of 3.13, or 1.50%, while OECD Asia Pacific has a rate of 3.52, or 1.68%.
- Among individual countries, China holds 2.89 (approximately 1.38% of the world’s reserves), and India holds 1.15, contributing 0.55% to the global proven natural gas reserves.
Other regional analyses are stated in the table below:
| Geography | (1,000 bn standard cu m) | Share |
| Other Asia | 4.75 | 2.27% |
| Latin America | 7.39 | 3.54% |
| Middle East | 82.52 | 39.50% |
| Africa | 17.22 | 8.24% |
| Russia | 46.83 | 22.42% |
| Other Eurasia | 18.74 | 8.97% |
| Other Europe | 0.09 | 0.04% |
| Total world | 208.89 | 100% |
Natural Gas Production Statistics, 2024
- In 2024, total global natural gas production reached 4,288.56 billion standard cubic meters, accounting for 100% of the world’s output.
| Region | Valuation bn standard cu m (share) |
| OECD Americas | 1318.37 (30.74%) |
| OECD Europe | 190.24 (4.44%) |
| OECD Asia Pacific | 190.50 (4.44%) |
| China | 242.70 (5.66%) |
| India | 35.30 (0.82%) |
| Other Asia | 271.07 (6.32%) |
| Latin America | 189.83 (4.43%) |
| Middle East | 735.62 (17.15%) |
| Africa | 246.71 (5.75%) |
| Russia | 644.21 (15.02%) |
| Other Eurasia | 213.65 (4.98%) |
| Other Europe | 10.36 (0.24%) |
Natural Gas Consumption Statistics
- In September 2025, natural gas consumption totalled 5,642 MMSCM, with net production of 2,824 MMSCM and LNG imports of 2,819 MMSCM.
Other monthly consumption of natural gas in 2025 is stated below:
|
Months
|
Net Production | LNG Import | Total Consumption |
| MMSCM (Million Standard Cubic Metre) | |||
| January | 3025 | 2436 | 5460 |
| February | 2712 | 2713 | 5424 |
| March | 2947 | 2397 | 5345 |
| April | 2870 | 2778 | 5648 |
| May | 2941 | 2865 | 5806 |
| June | 2,860 | 2754 | 5613 |
| July | 2,929 | 2872 | 5801 |
| August | 2,935 | 2819 | 5754 |
By Country
(Source: worldpopulationreview.com)
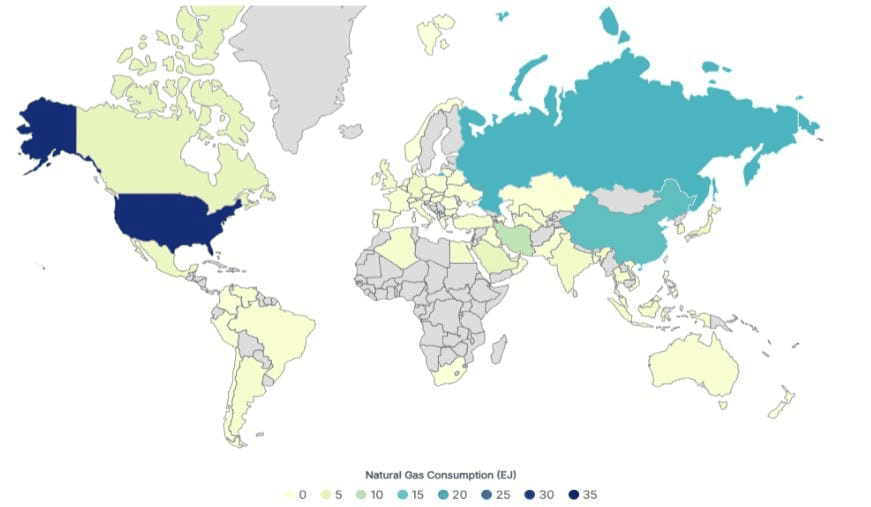
- As of 2024, the five countries that produce the most natural gas are the United States (32.5 Exajoules), followed by Russia (17.2 exajoules), China (15.6 exajoules), Iran (8.8 exajoules), and Canada (4.6 exajoules).
Furthermore, other countries’ consumption analyses are stated below:
| Country | Consumption (EJ) |
Consumption per 100k Population (EJ) |
| Saudi Arabia | 4.4 | 0.0130 |
| Japan | 3.3 | 0.00267 |
| Germany | 2.8 | 0.00331 |
| United Arab Emirates | 2.6 | 0.0236 |
| India | 2.5 | 0.000172 |
| South Korea | 2.3 | 0.00445 |
| Egypt |
2.2
|
0.00189 |
| United Kingdom | 0.00318 | |
| Italy | 2.1 | 0.00354 |
| Uzbekistan | 2.0 | 0.00550 |
| Turkey |
1.8
|
0.00206 |
| Algeria | 0.00384 | |
| Indonesia | 1.70 | 0.00060 |
By Region
(Source: statcdn.com)
- In the North American region, global natural gas consumption is expected to rise from 1,168 billion cubic meters in 2025 to 1,220 billion cubic meters by 2030, an increase of about 4% over that period.
Moreover, other region-wise natural gas consumptions are estimated as:
|
Region
|
2025 | 2030 |
Change Rate
(2025 to 2030) |
| (billion cubic meters) | |||
| Asia Pacific | 993 | 1,178 | +19% |
| Middle East | 631 | 729 | +16% |
| Eurasia | 646 | 686 | +6% |
| Europe | 522 | 465 | -11% |
| Africa | 173 | 194 | +12% |
| Central and South America | 154 | 161 | +5% |
United States Natural Gas Consumption Statistics
(Reference: market.biz)
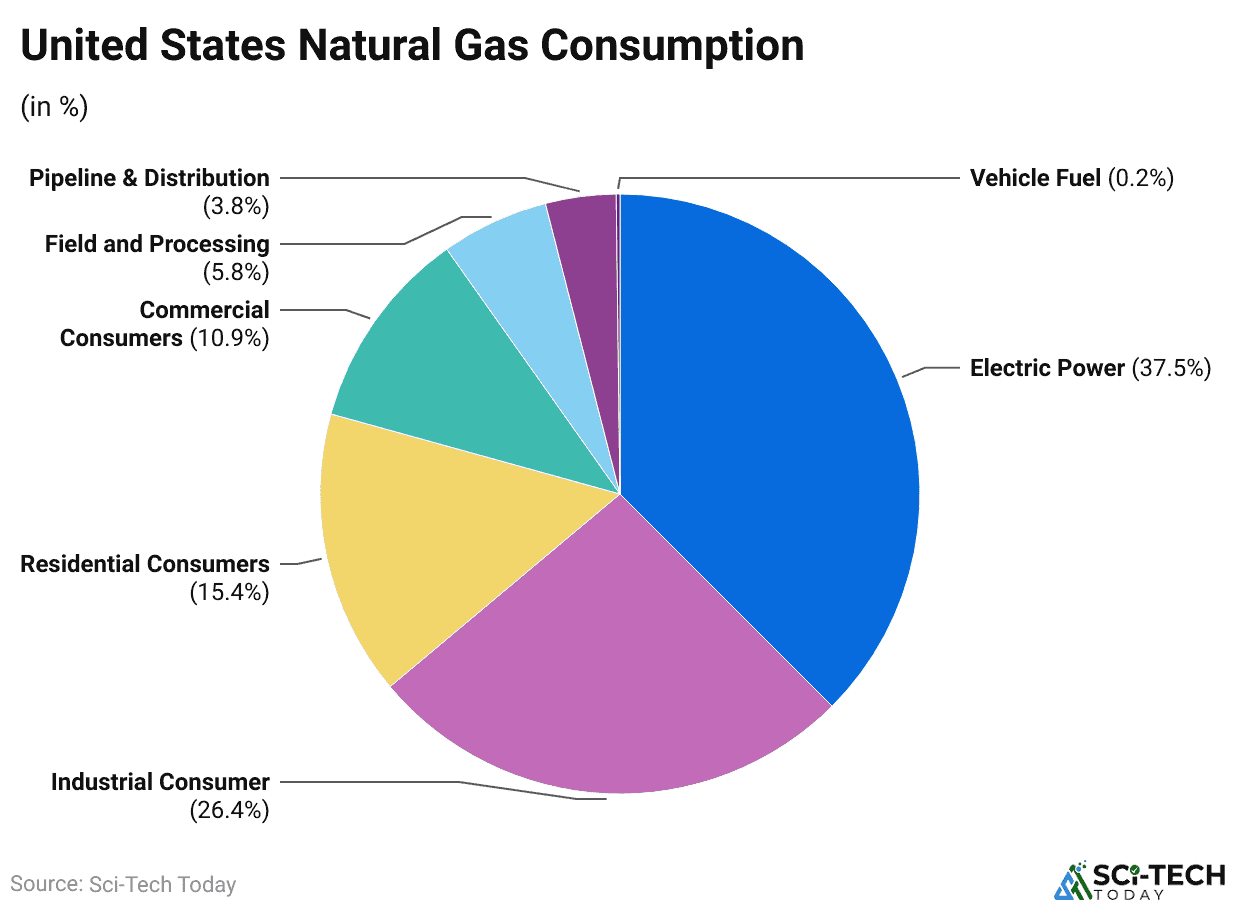
- The pie chart above shows that the electric power sector accounts for the largest share of the United States’ natural gas consumption, at 37.5%.
- Industrial consumers account for 26.4%, while residential users, primarily homes, account for 15.4%.
- Commercial consumers, such as offices and shops, use 10.9%.
- Meanwhile, other smaller shares come from field and processing activities (5.8%), pipeline and distribution operations (3.8%), and vehicle fuel (0.2%) of U.S. natural gas use.
Gas Prices Analysis
- On November 18, 2025, natural gas prices were USD 4.3343 per MMBtu.
- At around 12:54 p.m., the European benchmark TTF gas price was USD 36.68 per MWh, while the UK gas price stood at USD 1.09 per therm.
- A day earlier, on November 17, 2025, propane was priced at USD 0.65 per gallon, and German gas was slightly higher than the TTF at USD 38.24 per MWh.
United States Natural Gas Prices Analysis, 2025
| Months | Natural Gas Imports | Natural Gas Exports | Natural Gas LNG Imports | Natural Gas Pipeline Imports | Natural Gas Pipeline Exports | Liquefied Natural Gas Exports | Natural Gas Citygate | Natural Gas Delivered to Residential Consumers | Natural Gas Sold to Commercial Consumers | Industrial Natural Gas |
| (Dollars per thousand cubic feet) | ||||||||||
| January | 5.04 | 6.89 | 15.33 | 4.98 | 4.48 | 8.51 | 4.88 | 12.32 | 71.0 | 5.83 |
| February | 4.36 | 6.65 | 4.88 | 4.36 | 4.00 | 8.43 | 4.83 | 12.92 | 70.4 | 5.74 |
| March | 2.51 | 6.66 | 6.49 | 2.51 | 3.21 | 8.88 | 4.88 | 14.54 | 67.5 | 5.48 |
| April | 2.21 | 6.32 | 6.72 | 2.2 | 2.88 | 8.44 | 4.48 | 16.05 | 63.6 | 5.10 |
| May | 2.01 | 5.48 | 6.94 | 2.01 | 2.66 | 7.42 | 4.63 | 19.18 | 58.8 | 4.51 |
| June | 1.93 | 5.62 | 6.91 | 1.92 | 2.78 | 7.62 | 4.79 | 23.15 | 54.9 | 4.46 |
| July | 2.01 | 5.76 | 7.17 | 2.01 | 2.92 | 7.60 | 5.14 | 25.27 | 52.9 | 4.41 |
| August | 1.76 | 5.49 | 7.45 | 1.76 | 2.54 | 7.51 | 5.10 | 26.88 | 53.5 | 4.22 |
Gas Prices For Household Consumers (Semesterly, 2025)
| Country / Region | Price (USD per kWh) |
| Austria | 0.0855 |
| Belgium | 0.0769 |
| Bosnia and Herzegovina | 0.0430 |
| Bulgaria | 0.0637 |
| Croatia | 0.0439 |
| Czechia | 0.0798 |
| Denmark | 0.0681 |
| Estonia | 0.0651 |
| Euro area | 0.083 |
| European Union (27 countries) |
0.0788 |
| France | 0.0923 |
| Georgia | 0.0143 |
| Germany | 0.083 |
| Greece | 0.0793 |
| Hungary | 0.0242 |
| Ireland | 0.0998 |
| Italy | 0.088 |
| Latvia | 0.0648 |
| Liechtenstein | 0.0978 |
| Lithuania | 0.0552 |
| Luxembourg | 0.0776 |
| Moldova | 0.0886 |
| Netherlands | 0.0745 |
| North Macedonia | 0.1033 |
| Portugal | 0.088 |
| Romania | 0.047 |
| Slovakia | 0.0477 |
| Slovenia | 0.0638 |
| Spain | 0.0667 |
| Sweden | 0.1371 |
| Türkiye | 0.0172 |
Natural Gas Pipelines Statistics
- Global Energy Monitor’s Global Gas Infrastructure Tracker reports 4,158 gas pipelines totalling about 1.49 million km worldwide in 2025.
- An Eninrac review notes that around 1,800 major trunk/transmission pipelines globally exceed 700,000 km in length as of January 2023.
- According to PHMSA data, as of 2024, the U.S. operated 300,855 miles of gas transmission lines and 110,326 miles of gathering lines.
- According to the same PHMSA statistics, there were 2,370,228 miles of gas distribution mains and services across the U.S. in 2024.
- EIA figures cited by Reuters indicate that 2024 U.S. pipeline projects added 17.8 billion cubic feet per day (bcf/d) of new takeaway capacity.
- ENTSOG estimates that about 206,737 km of transmission gas pipelines are in place in the EU, UK, and Switzerland as of January 2024.
- India’s Petroleum Ministry reports that the operational gas pipeline length has risen from 15,340 km (as of 2014) to 24,945 km by September 2024, with 13,493 km under construction.
- In 2203, the global comparison dataset shows that the U.S. has roughly 3.67 million km of gas pipelines, compared to about 0.183 million km in Russia.
Global Greenhouse Gas Statistics
- UNEP’s Emissions Gap Report 2025 notes that global GHG emissions (including all gases and land-use) reached 57.7 GtCO2e in 2024, 2.3% above the 2023 level.
- The EDGAR 2025 inventory estimates 53.2 GtCO2e in 2024, excluding land-use, land-use change, and forestry.
- The 2025 Global Carbon Budget (GCB) projects that fossil-fuel CO2 emissions will reach 38.1 Gt CO2 in 2025, approximately 1.1% higher than in 2024, as reported on globalcarbonbudget.org.
- According to the same GCB, CO2 from land-use change is expected to decrease to approximately 4.1 GtCO2 by 2025.
- Combining sources, GCB expects total CO2 (fossil + land-use) to remain near 42 GtCO2 in 2025, similar to the 41.6 Gt recorded in 2024.
- Future Earth reports that atmospheric CO2 is projected to average roughly 425.7 ppm in 2025, approximately 52% above pre-industrial levels.
- EDGAR’s 2024 breakdown attributes 73.7% of 2023 GHGs to CO2, 18.9% to CH4, 4.7% to N2O, and 2.7% to F-gases.
- UNEP and the US EPA report sector shares of around 34% for electricity/heat, 24% for industry, 22% for AFOLU, 15% for transport, and 6% for buildings.
Greenhouse Gas Emissions Change By Sector
- According to Edgar.jrc.ec.europa.eu, by 2024, total global GHG emissions from all sectors were 65% higher than in 1990, 30% higher than in 2005, and 1% higher than in 2023.
| Sectors | 2024 vs. 2023 | 2024 vs. 2005 | 2024 vs. 1990 |
| Power Industry | +2% | +41% | +104% |
| Industrial Combustion and Processes | +1% | +43% | +93% |
| Buildings | −2% | −4%> | |
| Transport | +27% | +79% | |
| Fuel Exploitation | +2% | +26% | +52% |
| Agriculture | – | +17% | +25% |
| Waste | – | +27% | +46% |
CO2 Emissions Changes By Region
- A report published by the Global Carbon Budget estimated that in 2025, the United States’ CO2 emissions are projected to rise by 1.9%.
| Geographic Areas | Projected Change (2025) |
| India | +1.4% |
| China | +0.4% |
| European Union | +0.4% |
| Japan | −2.2% |
| The rest of the world | +1.1% |
Elemental Gases Statistics
- The NASA Science report further states that in 2025, dry air near Earth’s surface contains approximately 78.08% nitrogen, 20.95% oxygen, 0.93% argon, and trace amounts of other gases.
- In 2025, the industrial gases market is valued at approximately USD 98.8 billion, primarily comprising oxygen, nitrogen, hydrogen, argon, and CO2.
- In the same year, global oxygen sales are expected to reach approximately USD 87.86 billion, with 87.9 million tonnes produced.
- By 2025, the nitrogen market is projected to be worth approximately USD 43.63 billion, reflecting steady growth.
- Global hydrogen demand was approximately 100 million tonnes in 2024.
- Meanwhile, low-emissions (green and blue) hydrogen is projected to reach around 1 million tonnes of output.
- Overall industrial gas production, including oxygen, nitrogen, hydrogen, argon, and CO2, is estimated at around 1.74 billion tonnes.
- Additionally, the Asia-Pacific region accounted for more than 36% of the market share in 2024.
Gas Mixtures Market Statistics
(Source: researchandmarkets.com)
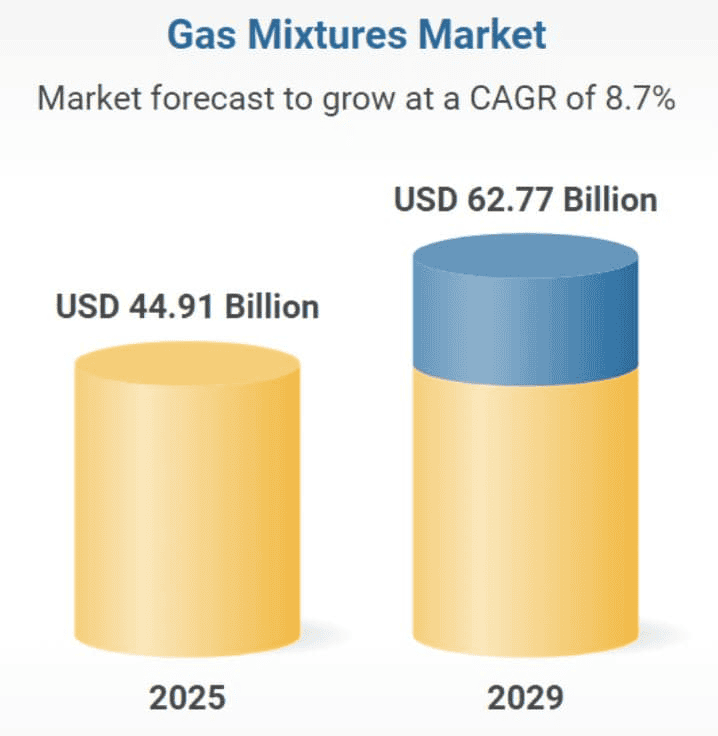
- In 2025, the market size of gas mixtures is estimated to reach around USD 44.91 billion, from USD 42.1 billion in 2024.
- Moreover, the market is forecasted to grow at a CAGR of 8.7% from 2025 to 2029, resulting in USD 62.77 billion (2029).
- According to globalgrowthinsights.com, the gas mixture market in 2025 is driven mainly by strong demand from healthcare (over 28%), industrial manufacturing (25%), and electronics applications (20%).
- Speciality gas mixtures make up about 18% of total usage, supported by 30% growth in high-purity products and 25% growth in customised blends.
- Major players include Linde, Air Liquide, Messer, Airgas, and Praxair Technology.
- Regionally, Asia-Pacific holds around 35% of the market, followed by North America at 28%, Europe at 25%, and the Middle East & Africa at 12%.
- The industry faces notable challenges, with compliance adding 22% to operating costs and logistics and storage limiting 15% of distribution capacity.
- Even so, over 30% of industries report improved efficiency, 25% report improved safety, and 20% report lower emissions thanks to gas mixtures.
- Recent developments include ultra-high-purity products (99.999%) now available in about 20% of the market and an 18% rise in the adoption of eco-friendly packaging.
By Country Analyses
- In the 2025 gas mixtures market, the United States accounts for 60% of the global market, with a market size of USD 6.57 billion.
- Besides, its segment is expected to grow at a 4.2% CAGR from 2025 to 2034.
Other countries’ market valuations are mentioned below:
| Country | Market Size (USD billion) |
Market Share | CAGR (from 2025 to 2034) |
| Canada | 2.08 | 19% | 4% |
| Mexico | 1.87 | 17% | 4.1% |
| Germany | 3.12 | 32% | 4.1% |
| France | 2.05 | 21% | 3.9% |
| United Kingdom | 1.86 | 19% | 4% |
| China | 5.48 | 40% | 4.6% |
| Japan | 3.01 | 22% | 4.4% |
| India | 2.05 | 15% | 4.7% |
| Saudi Arabia | 1.64 | 35% | 4.3% |
| United Arab Emirates | 1.08 | 23% | 4.2% |
| South Africa | 0.94 | 20% | 4.1% |
2025’s Leading Countries Statistics By Oxygen Mixtures Market
| Country | Market Size (USD billion) |
Market Share | CAGR (2025 to 2034) |
| United States | 3.96 | 35% | 4.6% |
| Germany | 2.26 | 20% | 4.3% |
| China | 1.92 | 17% | 4.8% |
By Nitrogen Mixtures Market
| Country | Market Size (USD billion) |
Market Share | CAGR (2025 to 2034) |
| China | 2.44 | 26% | 4.4% |
| United States | 2.06 | 22% | 4.0% |
| Japan | 1.31 | 14% | 4.2% |
By Carbon Dioxide Market
| Country | Market Size (USD billion) |
Market Share | CAGR (2025 to 2034) |
| China | 2.44 | 26% | 4.4% |
| United States | 2.06 | 22% | 4.0% |
| Japan | 1.31 | 14% | 4.2% |
By Argon Mixtures Market
| Country | Market Size (USD billion) |
Market Share | CAGR (2025 to 2034) |
| China | 1.29 | 30% | 4.4% |
| United States | 0.99 | 23% | 4.2% |
| India | 0.64 | 15% | 4.5% |
By Hydrogen Mixtures Market
| Country | Market Size (USD billion) |
Market Share | CAGR (2025 to 2034) |
| Japan | 0.91 | 29% | 4.8% |
| United States | 0.78 | 25% | 4.6% |
| Germany | 0.56 | 18% | 4.5% |
By Speciality Gas Mixtures Market
| Country | Market Size (USD billion) |
Market Share | CAGR (2025 to 2034) |
| United States | 0.92 | 34% | 4.5% |
| Germany | 0.61 | 22% | 4.3% |
| China | 0.49 | 18% | 4.6% |
By Other Mixtures Market
| Country | Market Size (USD billion) |
Market Share | CAGR (2025 to 2034) |
| United States | 0.66 | 32% | 4.1% |
| United Kingdom | 0.43 | 21% | 3.9% |
| France | 0.38 | 19% | 4.1% |
Toxic Gas Detection Market Analysis
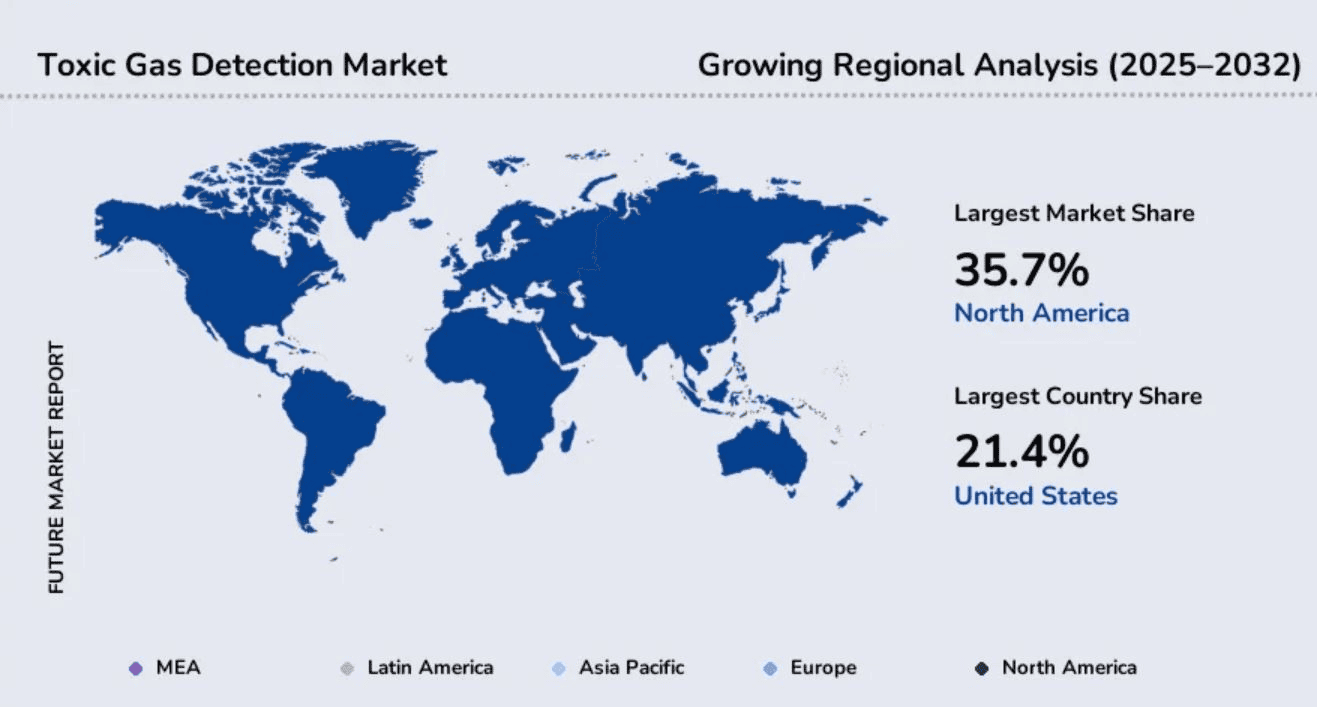
- According to a Future Market Report study, the toxic gas detection market is valued at about USD 7,850.47 million in 2024 and is expected to grow to around USD 13,850.32 million by 2032.
- The market is forecast to increase at a 7.23% compound annual growth rate (CAGR) between 2025 and 2032.
(Source: futuremarketreport.com)
- In the toxic gas detection market, North America is the fastest-growing region, accounting for about 35.7% of the market.
- The United States is the leading country in this region, with a 21.4% share.
- Meanwhile, the fixed gas detectors are the largest product segment, accounting for around 42.8% of the market.
Top 10 Highly Toxic Gases
| Chemical Name | Formula | NIOSH IDLH (ppm) | LC50 / LCL0 Information |
| Osmium tetroxide | OsO4 | 0.001 | 40 ppm (rat, 4 h) |
| Oxygen difluoride | OF2 | 0.5 | 26.067 ppm (rhesus monkey, 1 h) |
| Disulfur decafluoride | S2F10 |
1
|
2 ppm (rat, 10 min) |
| Tellurium hexafluoride | TeF6 | – | |
| Hydrogen selenide | H2Se | 1.8 ppm (guinea pig, 47 h) | |
| Arsine | AsH3 |
3
|
120 ppm (rat, 10 min) |
| Bromine | Br2 | 174 ppm (mice) | |
| Diazomethane | CH2N2 |
2
|
175 ppm (cat, 10 min) |
| Phosgene | CCl2O | – | |
| Nickel tetracarbonyl | Ni(CO)4 | 9.642 ppm (rat, 4 h) |
Industrial Gas Market Statistics
(Source: market.us)
- In 2025, the global Industrial Gases market is estimated at USD 122.3 billion, and by 2034, it is expected to reach USD 254.8 billion.
- Over the forecast period from 2025 to 2034, the market will grow at a CAGR of 8.5%.
(Reference: mordorintelligence.com)
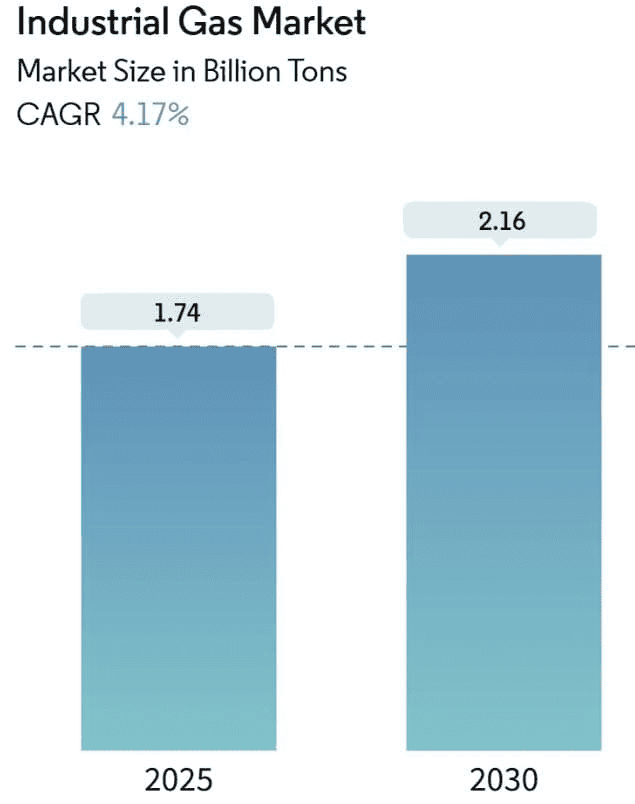
- In 2025, industrial gas demand is about to reach 1.74 billion tons, rising to 2.16 billion tons by 2030, at a CAGR of 4.17% from 2025 to 2030.
- In the industrial gas market in 2024, oxygen accounted for 32% of total revenue.
- Nitrogen is expected to be one of the fastest-growing products, with a projected annual growth rate of 4.51% up to 2030.
- Cylinder (packaged) gases made up 37.20% of overall sales, while gas supplied from on-site tonnage plants is projected to increase by about 4.43% per year.
- Around 20% of gas consumption came from chemical and refining industries, and demand from food and beverage plants may rise by 5.22% annually.
- Asia-Pacific accounted for 43% of the market and may grow at a 5.14% annual rate through 2030.
Biogas Market Size Statistics
(Reference: precedenceresearch.com)
- The global valuation of the Biogas market is expected to reach approximately USD 170.89 billion by 2025 and USD 291.66 billion by 2034.
- From 2025 to 2034, the market is expected to grow at a CAGR of 4.33%.
- In 2024, Europe accounted for 39.59% of the global biogas market, with an expected market size of USD 67.66 billion by 2025.
- Furthermore, other regional Biogas market shares were stated as Asia Pacific (38.10%), North America (11.60%), Latin America (5.85%), and MEA (4.86%).
- Electricity generation accounted for the largest application share at 32%.
- Additionally, municipal waste supplied about 45% of the total biogas, followed by agricultural waste (43%) and Industrial waste (12%).
Conclusion
In conclusion, gas statistics show how large groups of gas particles behave and how this behaviour influences our everyday lives. When we study different kinds of gases, such as pure gases, mixed gases, toxic gases, fuel gases, industrial gases, and biogas, along with their properties and uses, all the above information is useful for ensuring safety, promoting energy production, supporting industry, and protecting the environment. Proper gas analysis leads to safer machines, more efficient systems, and cleaner methods, making it an essential part of modern science.
