
Introduction
College Dropout Statistics: College dropout is a growing concern in higher education. Many students start college but do not complete their degrees due to financial problems, family responsibilities, stress, or a lack of effective support. Recent data shows that about 37.8% of students at four-year colleges do not complete their degree within six years. The situation is even more difficult in two-year colleges, where dropout rates are higher.
This article looks at who drops out of college and why. It breaks down trends by state, major, and student background. It also shows how dropping out affects jobs, income, and future opportunities. The goal is to understand the real reasons behind college dropout and its impact on students’ lives and the economy.
Editor’s Choice
- The overall U.S. college dropout rate for undergraduate students is 32.9%, while 22.3% of first-time students.
- About 3 in 10 students (30%) leave college during or after their first year.
- College dropouts earn 35% less per year than college graduates, resulting in an estimated USD 3.8 billion in lost economic value annually.
- Students aged 19 or younger have the lowest dropout rates, at just 5% at two-year colleges and 15% at four-year universities.
- Women show higher bachelor’s degree completion rates, with about 66% graduating within six years, while around 34% do not finish their studies within that period.
- Financial difficulties are the most common reason students leave college, accounting for 38% of all college attrition cases.
- Private nonprofit 4-year colleges perform the best, with a 76% 6-year graduation rate and a relatively low 18.9% first-year dropout rate.
- The lowest college dropout rates are reported in the United Kingdom (6.3%) and Norway (10%-17%).
- 52% of student parents leave college without a degree within six years, compared with 32% of non-parenting students.
- College graduates earn, on average, USD 65,000 annually, while dropouts earn approximately USD 38,000, reflecting a 42% difference in annual earnings.
College Dropout Rates in the United States
- The Think Impact report estimated that the overall college dropout rate for undergraduate students is 32.9%, while 22.3% of first-time students.
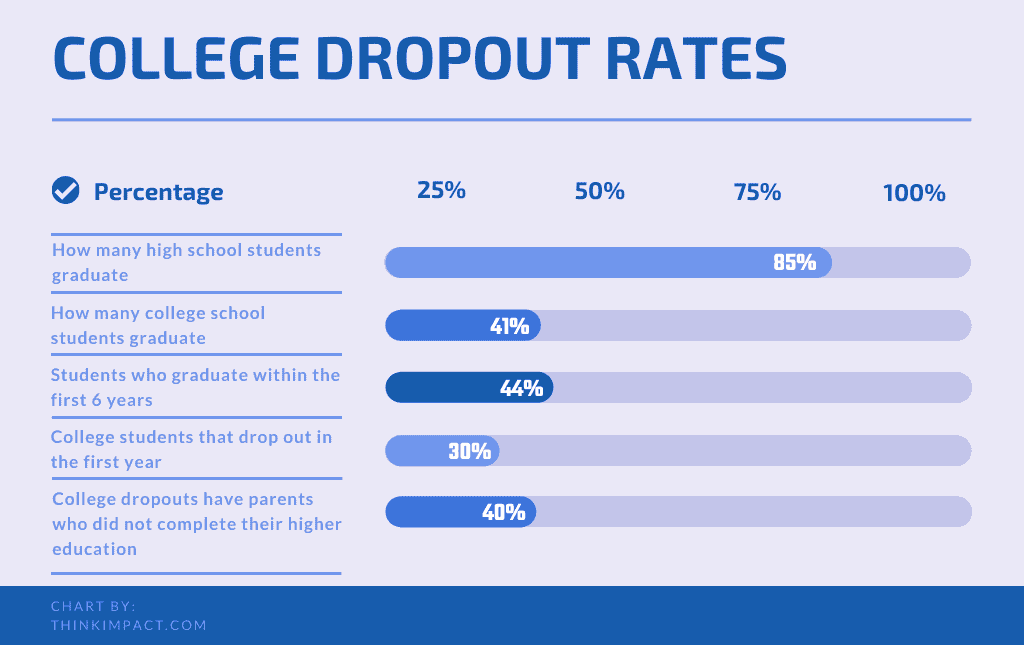
(Source: thinkimpact.com)
- Only 41% of students complete their degree within 4 years or less, and male students are 20% more likely to drop out than female students.
- An additional 12% of students graduate after transferring to a different institution.
- Male students have dropout rates that are 20% higher than those of female students.
- By comparison, 85% of high school students successfully graduate.
- Public universities report an average dropout rate of 50%, and graduation rates for federal grant recipients are 10%-20% lower than at private institutions.
- About 3 in 10 students (30%) leave college during or after their first year.
- Nearly 40% of college dropouts come from families where parents did not complete higher education.
- College completion remains a challenge in the U.S., with approximately 40% of students leaving college before earning a degree.
- Student attrition occurs early for many learners, as about 30% drop out during or shortly after their first year of study.
- Approximately 37.8% of students at four-year colleges do not complete their degrees within six years, while about 69% of students at two-year colleges do not finish within three years.
- First-generation students experience the highest dropout rate at 41%.
- College dropouts earn around 35% less income than bachelor’s degree holders.
- According to the BLS (2024 annual averages published May 2025), the unemployment rate for “Some College, No Degree” is 3.8%, while for a Bachelor’s Degree, it is 2.5%. This is a 52% relative increase.
- More than 37 million working-age Americans have attended college but left without earning a credential.
First-Year College Dropout Trends
- A report published by College Help Guide shows that student attrition is highest during the first year, with 24% of first-time college students not returning for their sophomore year.
- Degree completion within the standard timeline remains limited, as only 44% of students at four-year institutions graduate within 4 years.
- Around 62.2% of students ultimately earn a degree within 6 years.
Financial Impact of College Dropouts
- College dropouts earn 35% less per year than college graduates, resulting in an estimated USD 3.8 billion in lost economic value annually.
- Financial pressure remains a major challenge, with 55% of students struggling to secure funding for their education.
- As a result, 51% of college dropouts leave school because they cannot afford to continue their studies.
- Financial difficulties also delay graduation for 79% of students.
- While total U.S. student loan debt stood at USD 1.81 trillion in mid-2025, recent 2026 economic indicators show it has risen to USD 1.87 trillion.
- The average student loan balance for 2023 graduates was USD 29,300, including USD 33,800 for private school graduates and USD 27,100 for public school graduates.
College Dropout Statistics by Age Demographics
- According to Think Impact, students aged 19 or younger have the lowest dropout rates, at just 5% at two-year colleges and 15% at four-year universities.
- Students between 20 and 23 years face a sharply higher dropout rate of 51%, consistent across both two-year and four-year institutions.
- Students aged 24 to 29 years drop out at a rate of 52%, while those aged 30 years and older face the steepest risk at four-year colleges, at 54%.
- The National Student Clearinghouse Research Center further stated that students aged 20 or younger returned for their second semester at a rate of 89.7%, compared with just 61.4% for students aged 25 or older.
By Gender
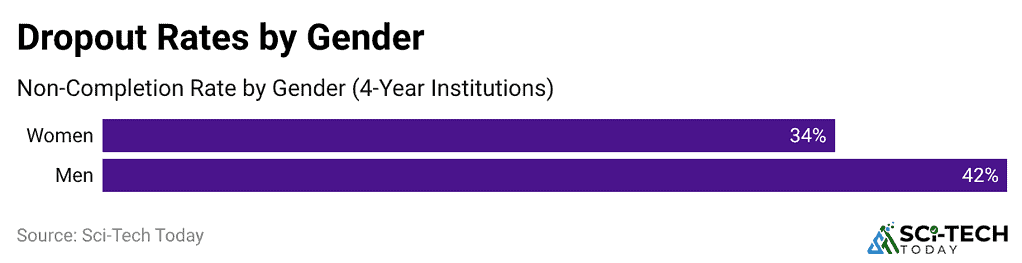
(Reference: collegehelpguide.com)
- Women show higher bachelor’s degree completion rates, with about 66% graduating within six years, while around 34% do not finish their studies within that period.
- Men graduate at a lower rate of 58% within six years, resulting in a higher non-completion rate of 42%.
By Race and Ethnicity
| Race/Ethnicity | Graduation Rate | Non-Completion Rate |
| Asian | 74% | 26% |
| White | 64% | 36% |
| Hispanic | 54% | 46% |
| Black | 40% | 60% |
| American Indian/Alaska Native | 39% | 61% |
Key Reasons for College Dropouts
| Reasons | Share of Students |
| Financial difficulties are the leading cause of college attrition. | 38% |
| Academic disqualification due to unmet academic requirements contributes significantly to student departures. | 28% |
| Difficulty adapting to campus social life affects student persistence. | 13% |
| Limited family support is linked to college dropout decisions. | 9% |
| Health-related issues are cited as the primary reason for leaving college. | 5% |
| Long commuting distances from campus contribute to student withdrawal. | 4% |
| Mental, emotional, or psychological challenges lead some students to discontinue their studies. | 3% |
| First-generation students from low-income families face the highest risk. | 89% |
College Dropout Rates by Institution Type
- According to Inside Higher Ed, private nonprofit 4-year colleges perform the best, with a 76% 6-year graduation rate and a relatively low 18.9% first-year dropout rate.
- Public 4-year institutions report the lowest first-year dropout rate at 17.9% and a 70.7% six-year completion rate.
- Private for-profit 4-year colleges face the greatest challenges, with a 38.7% first-year dropout rate and fewer than 36% of students graduating within six years.
- Community colleges graduate only 13% of students within two years, although the six-year completion rate has improved to 43.9%, up 3 percentage points over five cohorts.
- Many online institutions record eight-year completion rates below 50%, while Southern New Hampshire University reports a completion rate of 36%.
- Historically Black Colleges and Universities average a 23.2% four-year graduation rate, though institutions such as Spelman College (68%) and Howard University (60%) significantly outperform the sector average.
- Part-time students experience a 51.7% six-year dropout rate, compared with 25.1% for full-time students.
College Dropout Rates by Country
- An OECD report further stated that the lowest college dropout rates are reported in the United Kingdom (6.3%) and Norway (10%-17%).
| Country/Region | Dropout Rate |
| Italy | 33% |
| Germany | 28%-33% |
| Netherlands | 32.2% |
| Brazil (First-Year Dropout) | 25% |
| Brazil (Non-Completion Within +3 Years) | 51% |
| United States | 40% |
| Australia | 25% |
| India | 25% |
College Dropout Rate Statistics By Highest States Shares, 2025
| State | 6-Yr Graduation Rate | Dropout Rate | Total SCNC Dropouts (2024) |
| New Mexico | 38% | 62% | 264,616 |
| Alaska | 39% | 61% | 93,712 |
| Nevada | 41% | 59% | 334,492 |
| Arkansas | 43% | 57% | 295,232 |
| Louisiana | 44% | 56% | 458,711 |
| Idaho | 44% | 56% | 183,048 |
| South Dakota | 45% | 55% | 67,808 |
| West Virginia | 46% | 54% | 182,956 |
| Montana | 47% | 53% | 102,764 |
| Mississippi | 47% | 53% | 325,451 |
By Lowest States Shares
| State | 6-Yr Graduation Rate | Dropout Rate | Total SCNC Dropouts (2024) |
| Rhode Island | 69% | 31% | 121,304 |
| Massachusetts | 68% | 32% | 675,920 |
| Connecticut | 67% | 33% | 350,307 |
| New Hampshire | 66% | 34% | 94,135 |
| Vermont | 66% | 34% | 63,550 |
| Pennsylvania | 65% | 35% | 1,047,644 |
| New Jersey | 65% | 35% | 757,282 |
| Virginia | 65% | 35% | 880,067 |
| District of Columbia | 64% | 36% | 36,706 |
| California | 64% | 36% | 5,941,080 |
Top Occupations Statistics By People Who Drop Out of College
College Completion Rates For Low-Income Students
- The college completion rate for low-income students is 14.6% within six years of enrollment, which is far below the national average of 62%.
- Only 11.5% of students from families with incomes in the bottom 20% will complete their degree within six years.
- Low-income students attending four-year institutions have a higher completion rate of 21.8%, compared to only 7.9% at community colleges.
- Financial support and institutional aid programs have been shown to improve completion rates by up to 18% in some colleges that target low-income students.
Income Statement Statistics By No Postsecondary Degree And A Bachelor’s Degree
- A recent study shows that 52.4% of students from families with an income of USD 35,000 or less still need to finish college.
- On the other hand, 11.1% got an associate degree, and 22.9% earned a bachelor’s degree.
The table below shows the income brackets by shares of students’ degrees in 2024:
Education
| Income Bracket (USD) | No Postsecondary Share | Bachelor’s Degree Share |
| 35,000 or less | 52.4% | 22.9% |
| 35,001 to 55,000 | 41.8% | 30.4% |
| 55,001 to 75,000 | 37.3% | 38.2% |
| 75,001 to 115,000 | 31.4% | 41.3% |
| 115,001 and higher | 23.9% | 54.5% |
Average College Dropout Rate Statistics By Segments
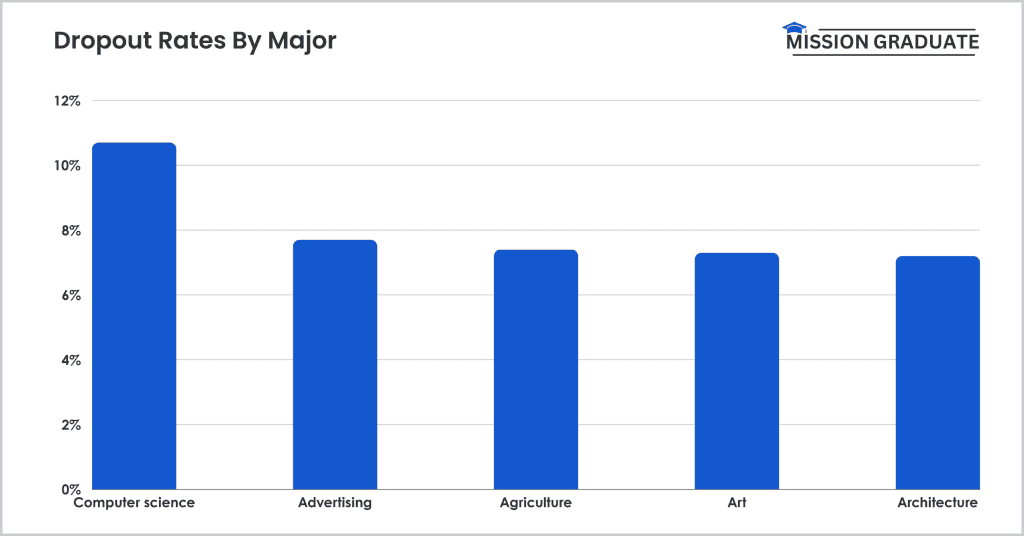
(Source: missiongraduatenm.org)
- Computer Science recorded the highest dropout rate at 10.7%, followed by Advertising at 7.7% and Agriculture at 7.4%.
- Other fields with relatively high dropout rates included Art at 7.3% and Architecture at 7.2%.
College Dropout Statistics Among Foster Care Youth
- According to fosterdata.org, around 20% to 30% of foster youth enroll in college, but only 8% to 12% earn a two- or four-year degree by their mid-to-late 20s, compared with 49% of the general population.
- Degree attainment remains particularly low, with only 3%-4% earning a bachelor’s degree and 2%-6% earning an associate’s degree.
- Inside Higher Ed report also indicates that foster youth are about 5× less likely to complete college than their non-foster peers.
- Approximately 50% of foster youth who enroll in college drop out during their first year.
College Dropout Rates Statistics For Students With Disabilities
- Approximately 41% of students with disabilities in higher education drop out before completing their degrees, and more than 27% without disabilities.
- Based on the types of disabilities, students with learning disabilities have a dropout rate of 46%.
- Similarly, students with anxiety and depression reported a dropout rate of 51%, followed by physical impairments with a lower dropout rate of 37%.
- According to College Dropout Statistics, Institutions that provide comprehensive support services, such as counseling and assistive technology tutoring, see a 17% improvement in retention rates for students with disabilities.
- In 2024, among low-income students with disabilities, the dropout rate reached 52%.
- College Dropout Statistics also mentioned that the dropout rate of male and female disabled students will reach up to 44% and 39%, respectively.
Educational Attainment Gap Between Student Parents and Non-Parents
- 52% of student parents leave college without a degree within six years, compared with 32% of non-parenting students.
- Only 17% of student parents graduate within 6 years, compared with 50% of non-parents.
- Student parents earn a degree within six years at a rate of 18%, compared with 27% for independent non-parents and 54% for dependent students.
- They are also 10× less likely to complete a bachelor’s degree within five years, while parents of preschool-aged children face nearly 2× higher dropout risk.
Impact Of College Dropout On Individuals
- College graduates earn, on average, USD 65,000 annually, while dropouts earn approximately USD 38,000, reflecting a 42% difference in annual earnings.
- Over a lifetime, a college dropout may earn USD 1 million less than someone with a bachelor’s degree.
- The unemployment rate for college dropouts is 6.5% in 2024, compared to 3.2% for those with a college degree.
- About 34% of college dropouts carry student loan debt without having earned a degree, and the average debt for dropouts will be USD 14,000 in 2024.
- College graduates report 21% higher job satisfaction compared to dropouts.
- Meanwhile, dropouts are 15% more likely to experience long-term health issues.
- Mental health challenges are prevalent, with college dropouts being 40% more likely to report depression and anxiety compared to graduates.
- College Dropout Statistics show that by age 50, the average retirement savings for college graduates is USD 220,000, while for dropouts, it is only USD 110,000, reflecting a 50% gap in long-term financial security.
- College dropouts are 60% less likely to move into higher-income brackets over time.
U.S. Unemployment Rates and Earnings by Education Level
| Education Level | Unemployment Rate | Median Weekly Earnings |
| Less than High School Diploma | 6.2% | USD 738 |
| High School Diploma | 4.2% | USD 930 |
| Some College, No Degree | 3.8% | USD 1,020 |
| Associate’s Degree | 2.8% | USD 1,099 |
| Bachelor’s Degree | 2.5% | USD 1,543 |
| Master’s Degree | 2.2% | USD 1,840 |
| Professional Degree | 1.3% | USD 2,363 |
| Doctoral Degree | 1.2% | USD 2,278 |
Conclusion
This article on College Dropout Statistics shows that dropping out of college has a significant impact on individuals and society. Those who leave college often face higher unemployment, lower incomes, and fewer opportunities for better jobs than graduates. For society, more dropouts can increase the need for social services, reduce economic growth, and lead to a less educated workforce.
To solve these problems, financial aid, academic support, and mental health services are important for helping students complete their education. Improving graduation rates can make society stronger and more successful.
