Introduction
Facebook Marketplace Statistics: In 2025, Facebook Marketplace has evolved into a formidable, multi-billion-dollar global commerce engine that fundamentally changed local and peer-to-peer (P2P) shopping.
Today, the platform continues its massive trajectory, leveraging a large user base that surpasses the active populations of many continents, making it a vital force in the social commerce landscape. Meta has strategically proved its infrastructure, adjusting fees and bolstering its advertising tools, which solidifies Facebook Marketplace’s position as an undeniable platform for everyone from normal people like us who want to sell their used items to serious small businesses.
This exclusive data-packed article will completely go through the latest Facebook Marketplace statistics for 2025, offering a deep dive into its immense scale, core user demographics, the economics of its fee structure, and the most profitable categories driving its success. We work hard to provide the most current and detailed analysis available to help you understand the true scope of this e-commerce giant. So, now without any further action, let’s get started.
Editor’s Choice
- The platform boasts an estimated 1 billion monthly visitors, demonstrating that nearly two-fifths of Facebook’s colossal active user base is engaged with commerce.
- The projected annual revenue generated by the platform is $30 billion for 2024.
- Sellers must remember that local pickup transactions incur a strict 0% commission and processing fee, offering the only way to retain 100% of the sale price.
- The mandatory service fee for all shipped orders processed through the Marketplace checkout is a fixed 10% of the total sale value, which necessitates a more precise pricing strategy to protect profit margins, especially on items priced between $10 and $50.
- The single largest demographic group is Men aged 25 to 34, accounting for a substantial 9% of total users.
- High-demand goods such as refurbished electronics and popular apparel can achieve an average sale time of under 24 hours from listing.
- Approximately 1 in 6 users reports having encountered a suspicious or outright fraudulent listing.
- A significant 33% of all small businesses in the United States have integrated Facebook Marketplace into their sales funnel.
- Users spend an average of 20 minutes per visit on the Marketplace, which is a high level of engagement that points toward genuine purchase intent rather than passive scrolling.
- Sellers must be aware of the steep $20 fee levied against them for chargeback disputes that are ultimately won by the buyer.
Facebook Marketplace Users Statistics
- The last official figure confirmed Facebook Marketplace surpassed 1 billion monthly users back in 2021, and internal reports suggest this figure has since grown by over 10% YoY in subsequent periods.
- This current massive scale solidifies its dominance over traditional platforms like Craigslist and regional players such as OfferUp and Kijiji.
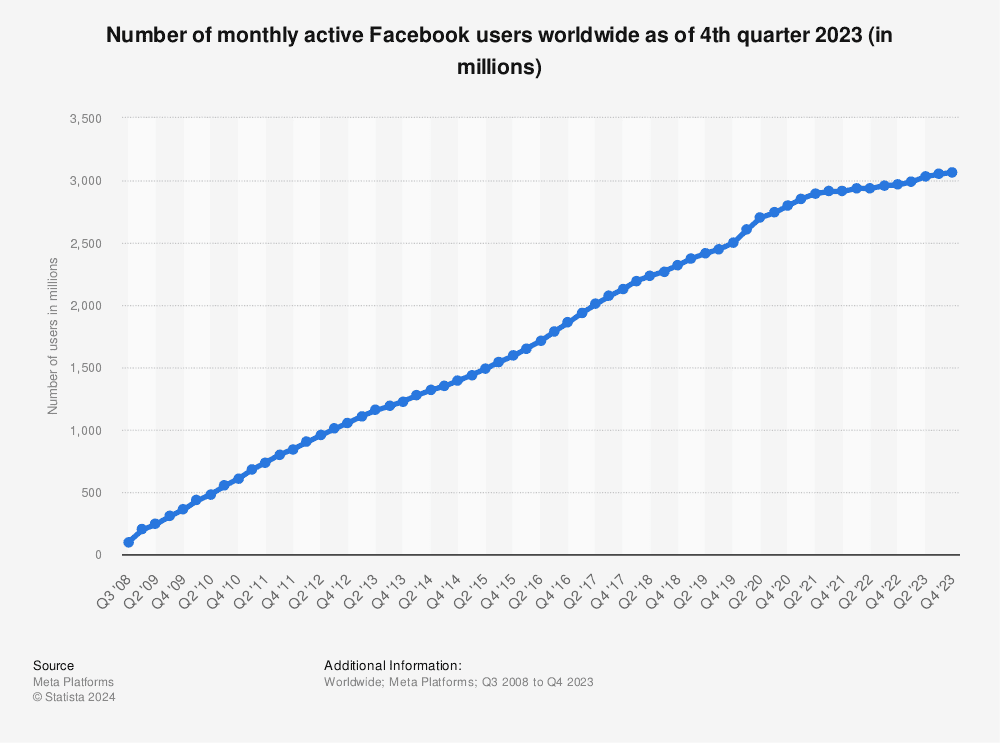
- The total monthly active users on the core Facebook platform reached an astronomical 3.065 billion in 2024.
- Approximately 16% of all active Facebook users report accessing the platform specifically for the purpose of browsing Facebook Marketplace listings, indicating that nearly 491 million people worldwide see it as a primary shopping destination.
- Engagement data shows that users who click on a paid advertisement within the Facebook Marketplace environment convert to an actual purchase 54.2% of the time.
- The platform actively facilitates over 3 billion connections between potential buyers and sellers every month via Facebook Messenger.
- In the critical North American region, specifically the U.S. and Canada, fully one in four daily active young adult users (DAUs) actively engage with Facebook Marketplace, making it a key focus for advertisers targeting the coveted 18 to 34 age bracket.
| Marketplace Scale Metric | Insights (2024/2025) |
| Monthly Active Visitors |
1.1 Billion (Estimated) |
|
User Intent |
16% (Of all Facebook users log in just for Marketplace) |
| Ad Conversion Rate |
54.2% (Users clicking ads convert to purchase) |
Users Demographics Statistics
 (Reference: electroiq.com)
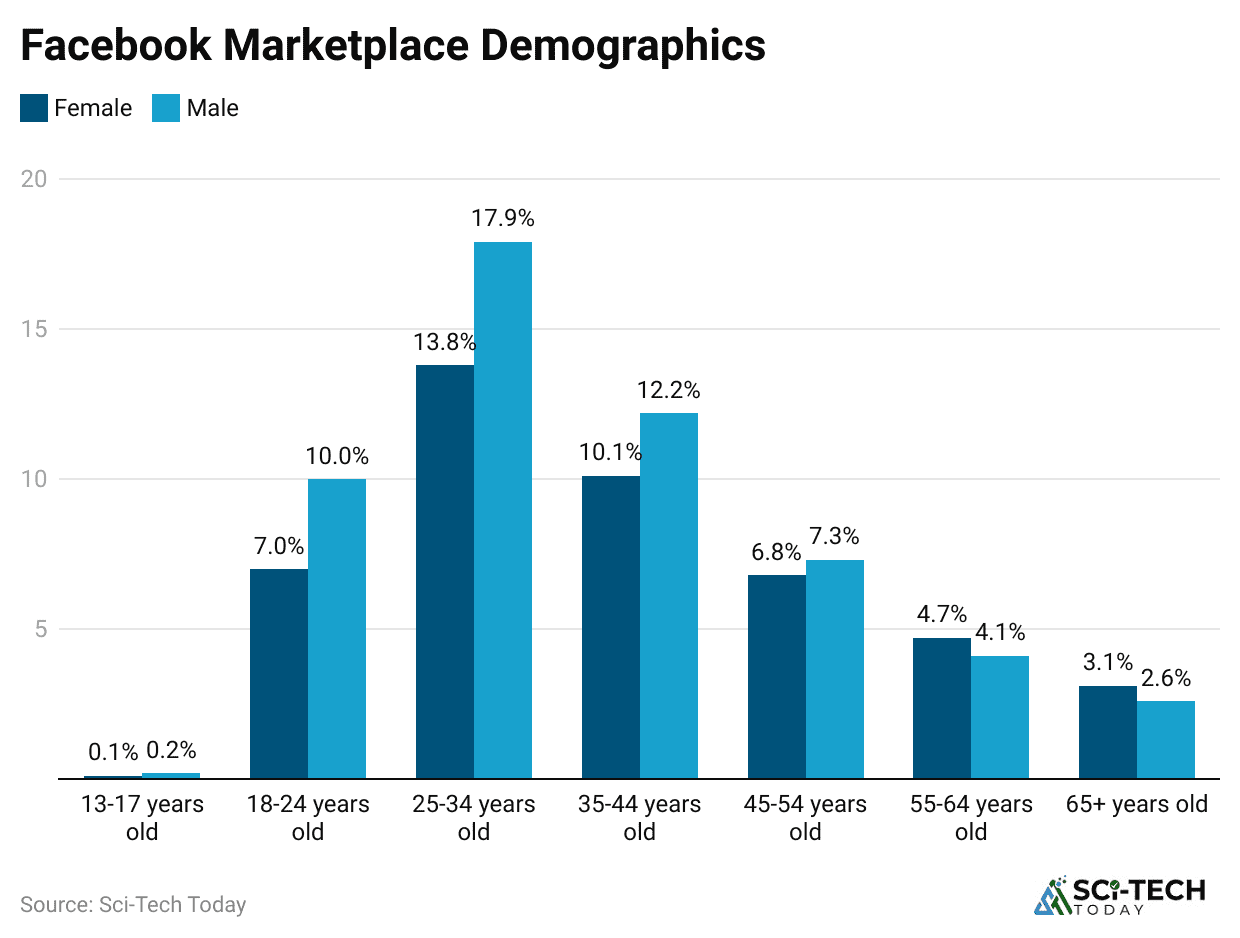
- The single most active demographic group is Men aged 25 to 34, who account for a substantial 17.9% of the total user base, followed closely by Women aged 25 to 34 at 13.8%.
- These two groups combined represent a significant 31.7% of all Facebook Marketplace activity, underscoring their dominance in the resale market.
- Users between the ages of 25 and 44 constitute the overwhelming majority of the platform’s engagement, with over 50% of all buying and selling activity attributed to this prime-spending age bracket.
- Despite the common perception, the gender split is quite active across the board, with nearly 60% of users in 2024 being identified as female.
- Mobile engagement is nearly total, as over 98% of Facebook’s overall user base accesses the platform via a mobile device.
- One-third, or 33%, of all small businesses operating within the United States utilize Facebook Marketplace as an additional or primary sales channel.
- The average visit duration to a Facebook Marketplace session is approximately 20 minutes.
| User Demographics/Behavior | Data (2025) |
| Largest User Group | Men 25 to 34 (17.9% of users) |
| Gender Distribution | 60% Female (Estimated in 2024) |
| Business Adoption | 33% (Of U.S. small businesses use it) |
| Session Length | 20 Minutes (Average per visit) |
Facebook Marketplace Revenue
 (Reference: scoop.market.us)
According to Market.us, the market for e-commerce software and platforms is experiencing an exponential phase of expansion, driven by widespread digital adoption and continuous technological development.
- The total market size for e-commerce platforms is projected to more than double in less than a decade, specifically expected to surge from $9.0 billion in 2023 to reach $21.0 billion by 2032.
- This phenomenal growth trajectory represents a robust Compound Annual Growth Rate (CAGR) of 13.7% across the 2023 to 2032 forecast period..
- Platform providers are utilizing advanced computational tools, including artificial intelligence (AI), machine learning, and comprehensive big data analytics, to craft highly intuitive and deeply personalized digital environments that significantly enhance the overall user experience.
Dominant Segments and Technology Preferences
Analyzing the market by customer type and technical delivery reveals which segments are currently driving the most value and where infrastructure investment is concentrated.
- The Business-to-Consumer (B2C) segment maintained the largest share of the platform market throughout 2022
- In 2023, infrastructure preference heavily favored agile solutions, with cloud-based platforms capturing more than 58% of the total market share, largely due to their inherent flexibility.
- The electrical and electronics sector commanded the leading position among all product categories in 2022, as consumers increasingly preferred the online environment for purchasing high-tech gadgets and devices.
Geographic Leadership and Key Players
Geographic analysis highlights where the current revenue is concentrated, while an examination of the competitive landscape identifies the primary platform leaders.
- North America served as the definitive global market leader in 2023, commanding a significant 32.8% regional market share and generating a total revenue of US$1.9 billion.
- Within the crucial U.S. market, Shopify stands out as the dominant platform provider, holding a commanding 28.41% market share and supporting a massive ecosystem of over 2.8 million active merchant sites with its powerful, user-friendly.
- Furthermore, the U.S. maintains its position as the world’s second-largest global e-commerce market overall, with projected total revenues set to surpass the US$875 billion mark.
| Statistic Category | Metrics (2023 to 2032) |
| Market Size Projection | Growth from $9.0 billion (2023) to $21.0 billion (2032) |
| Growth Rate (CAGR) | 13.7% (Compound Annual Growth Rate from 2023 to 2032) |
| Leading Market Segment | B2C Segment (Largest Share in 2022) |
| Leading Technology Type | Cloud-Based Platforms (Accounted for over 58% in 2023) |
| Leading Product Category | Electrical and Electronics (Led the market in 2022) |
| Geographic Leadership | North America (32.8% Market Share in 2023) |
| U.S. E-commerce Revenue | Projected to exceed US$875 billion (Total Market Revenue) |
| U.S. Platform Leader | Shopify (28.41% U.S. Market Share) |
Facebook Annual Revenue
 (Reference: techbehemoths.com)
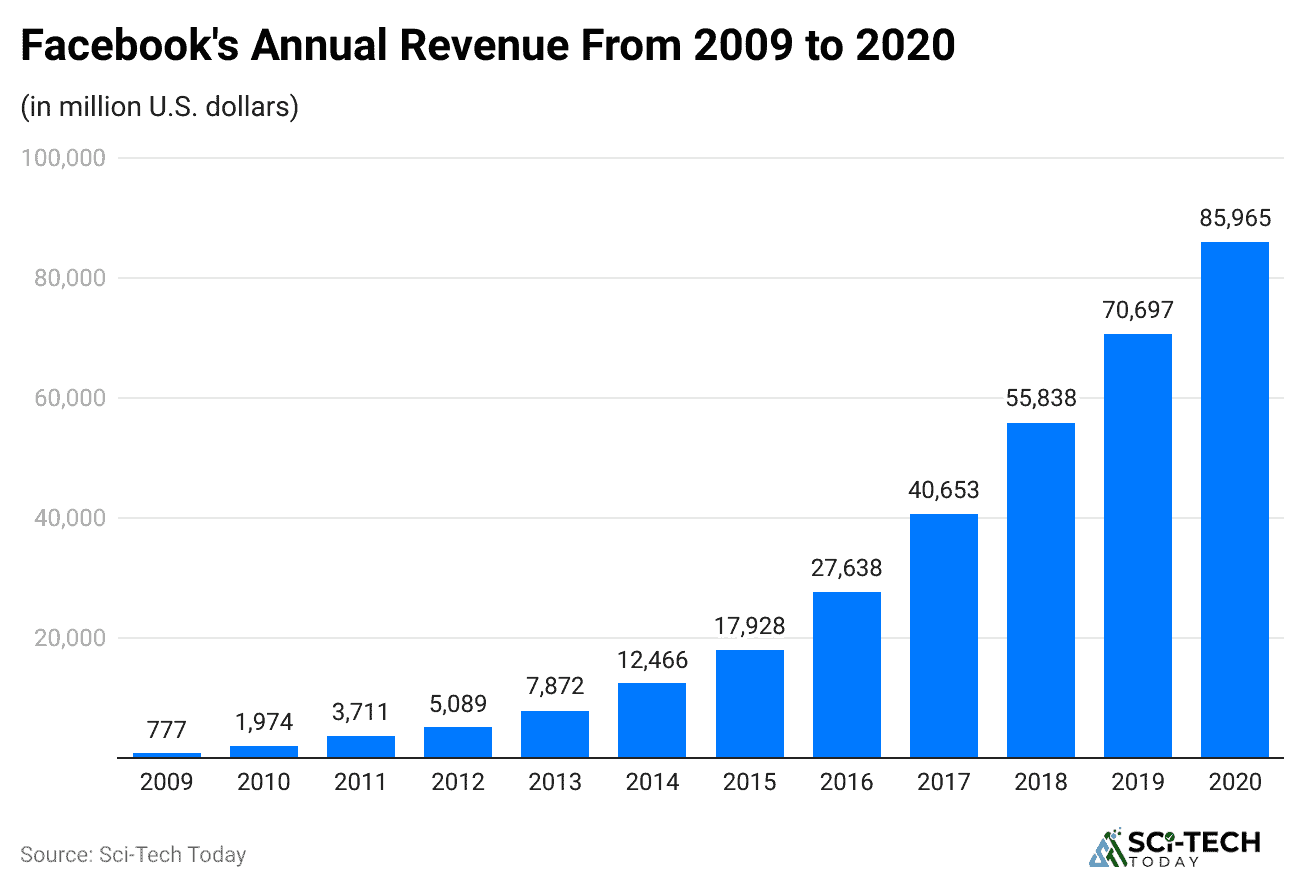
- Meta’s total annual revenue for 2024 hit a $164.5 billion, with the advertising segment, which is heavily fueled by the engagement data from Marketplace activity, contributing nearly $162 billion of that figure.
- The estimated annual revenue generated directly by Facebook Marketplace itself is projected to reach $30 billion by the end of 2024.
- The standard selling fee for items that use the secure Marketplace Checkout and shipping feature is a flat 10% commission on the total sale price (including item cost, shipping, and taxes), a substantial doubling from the historical 5% fee to cover expanded services.
- For shipped orders with a total sale price of less than $8, the fee structure imposes a minimum charge of $0.80.
- In contrast, all local pick-up transactions remain 0% commission and fee-free, encouraging users to coordinate in-person exchanges and utilize off-platform payments like cash or external apps such as Venmo.
- Sellers who use the platform’s payment system for shipped orders generally receive their funds and payouts within an average window of 5 business days following the confirmed delivery of the item.
- Crucially, when a buyer initiates a successful chargeback or payment dispute that is ultimately ruled in their favor, the seller is subject to a stiff $20 fee per transaction.
| Marketplace Economics Metric | Insights (2025) |
| Shipped Sale Commission | 10% (Of Total Sale Value) |
| Minimum Transaction Fee | $0.80 (For sales under $8) |
| Local Sale Fee | 0% |
| Chargeback Penalty | $20 (If buyer wins dispute) |
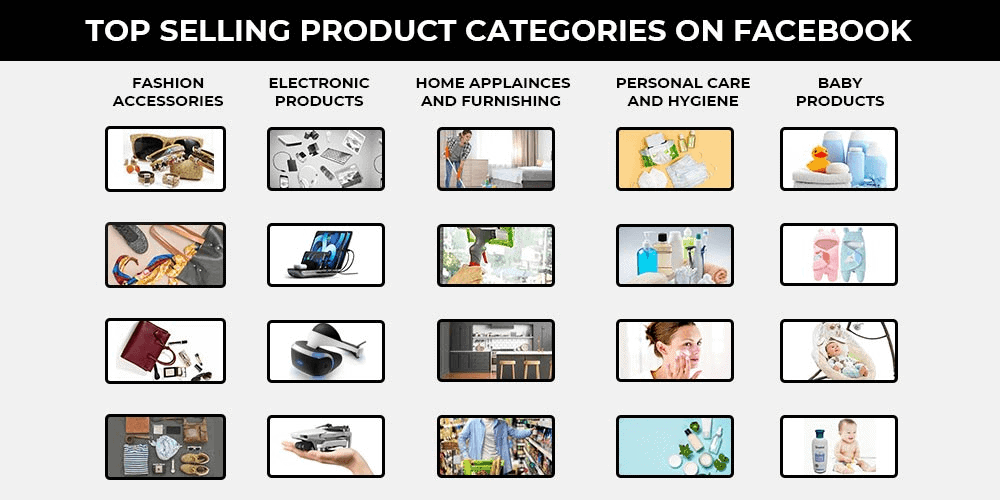
Top Selling Categories and Inventory
 (Source: crosslist.com)
- The total number of live active listings on Facebook Marketplace is a massive, though often estimated, figure that sits comfortably above 4 billion unique product listings at any given time.
- Furniture and Home Decor consistently rank as a top-selling category, often due to the difficulty and high cost of shipping large items, which makes the local pickup focus of Facebook Marketplace a massive advantage over purely shipped platforms.
- Electronics and Gadgets, especially refurbished smartphones, laptops, and gaming consoles, generate some of the fastest turnover rates, with high-demand items often selling in under 24 hours from the initial listing time.
- Clothing and accessories sales have surged, fueled by the growing resale and sustainability trends, with designer handbags and branded sportswear being some of the most profitable items that command prices of over $100 per transaction.
- Vehicles and Auto Parts are a major segment, with Meta investing heavily in specialized features for car sales, attracting buyers and sellers interested in the transparency of profile-linked accounts compared to anonymous classifieds.
- Collectibles and memorabilia, including sports cards, vintage toys, and vinyl records, demonstrate sustained growth, attracting hobbyists who are willing to pay a premium for unique, hard-to-find items, with transactions often exceeding $500 for rare pieces.
- The overall average turnover time for a well-priced, common household item, like a piece of furniture or a small appliance, typically falls within a narrow window of 3 to 7 days, indicating a fast-moving, high-velocity marketplace.
| Top Selling Category Statistics | Metric (2025) |
| Total Active Listings | 4 Billion+ (Estimated) |
| Fastest Selling Items | 24 Hours (High-demand electronics) |
| Key Categories | Furniture, Electronics, Apparel |
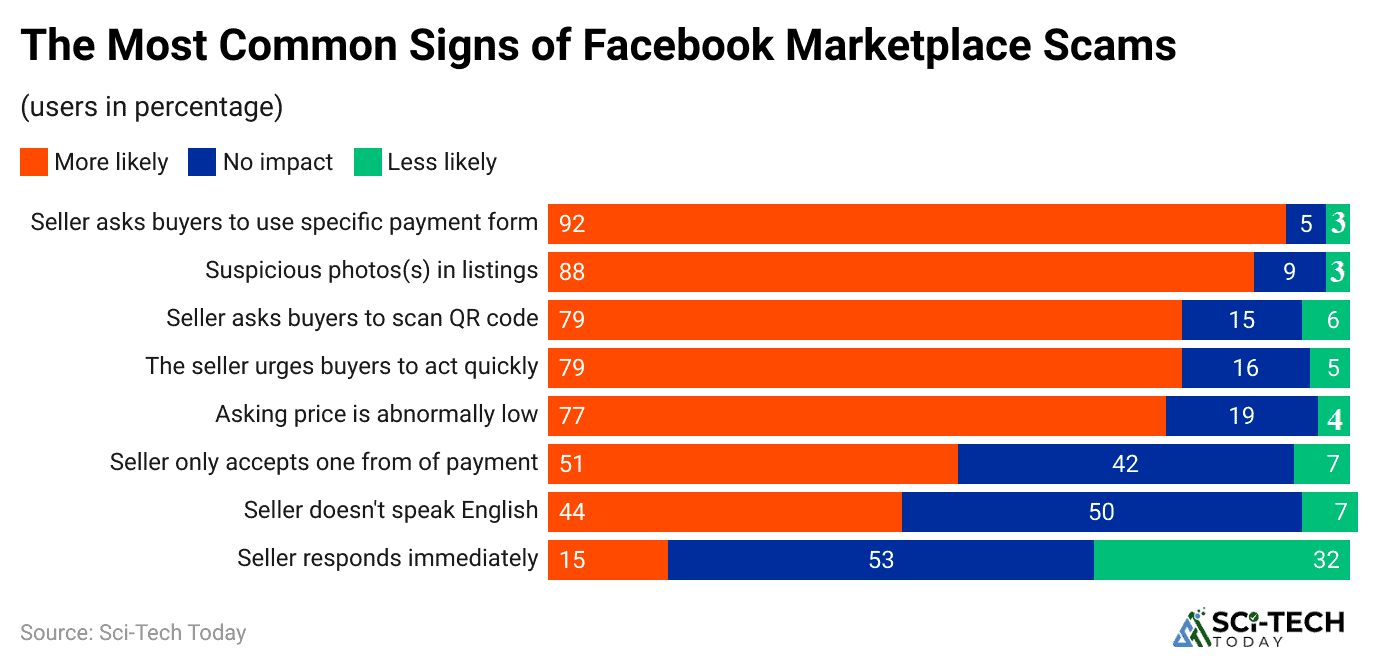
Facebook Marketplace and Security
 (Reference: allaboutcookies.org)
- Recent surveys indicate that approximately 1 in 6 users, which translates to over 16% of the monthly user base.
- The most common scam involves a fake overpayment or fake shipping label, where fraudsters attempt to gain the item for free or steal an excess payment in over 40% of reported fraud attempts.
- Meta’s internal systems, driven by AI and machine learning, reportedly flagged and removed over 1.1 billion fake Facebook accounts globally in Q3 of 2024 alone.
- A major factor in scam reduction is the increasing adoption of Meta Pay and the secure checkout feature, which offers Purchase Protection to buyers and reduces the incentive for off-platform payment scams, which often offer zero recourse.
- The use of verified profile badges and public user ratings is a significant trust indicator, with buyers reporting over 65% greater confidence in purchasing from sellers with an average rating above 4.5 stars.
- To combat the proliferation of fraudulent listings, Meta continues to invest heavily in automated detection systems that leverage sophisticated algorithms to analyze listing descriptions and images for common scam keywords and patterns, resulting in a reported 15% YoY reduction in flagged scam posts.
| Marketplace Security Metric | Data (2025) |
| Scam Encounter Rate | 1 in 6 users (Reports suspicious activity) |
| Scam Tactic Dominance | 40%+ (Fake overpayment/shipping scams) |
| Platform Enforcement | 1.1 Billion+ (Fake accounts removed in a single quarter) |
Facebook Marketplace vs. The Competition
 (Reference: hostinger.com)
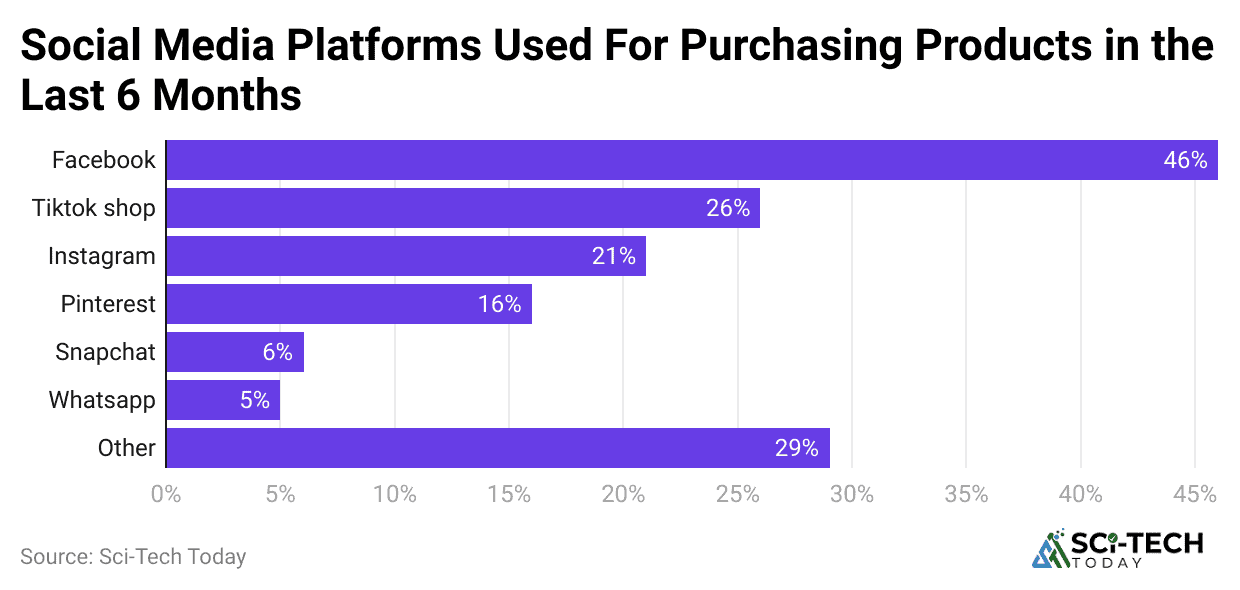
- Facebook Marketplace holds a commanding 51.19% share of the total social commerce market, significantly dwarfing its internal Meta competitors.
- It is currently ranked as the third most popular website globally for secondhand shopping, trailing behind only the massive international presence of eBay and the e-commerce dominance of Amazon, which acts as a third-party marketplace.
- Compared to eBay, which charges an average final value fee of 13% plus payment processing fees, Facebook Marketplace’s 10% shipping fee is slightly lower.
- The average sales price per transaction on Facebook Marketplace is estimated to be approximately £100 (or its equivalent in other currencies).
- For 39% of social media users, Facebook Marketplace or Instagram Shopping is their preferred destination for social media purchases, proving its effectiveness over other social platforms like TikTok and X for transaction-driven intent.
| Competitive Metric | Insights (2025) |
| Social Commerce Market Share | 51.19% |
| P2P Fee Advantage | 0% (Local vs. 13% eBay Average) |
| Average Transaction Value | £100 (Estimated) |
Conclusion
Overall, this data is conclusive: Facebook Marketplace is an undeniable, powerful, and deeply ingrained force in the global commerce ecosystem for 2025, powered by its enormous 1.1 billion monthly user base. It has successfully bridged the gap between the mass market appeal of a social network and the functional necessity of a local classifieds service, achieving a dominant 51.19% share of the social commerce landscape.
The platform is not simply a secondary sales channel; it’s an economic asset for Meta, generating an estimated $30 billion in annual revenue, and a critical component for 33% of U.S. small businesses. Despite the fee increase to 10% on shipped orders, the scale and the continued zero-fee option for local deals maintain its competitive edge over eBay and other P2P marketplaces.
For any business or individual seller today, the data dictates that success on Facebook Marketplace comes down to three factors: leveraging the free local market for maximum profit, correctly pricing to account for the 10% shipped-sale fee, and focusing on the high-demand categories like furniture, electronics, and apparel, which drive the market’s high velocity.
As Meta continues to improve its anti-scam measures and integrate the platform deeper into the Meta ecosystem, Facebook Marketplace is positioned for sustained growth, making it a critical focal point for the future of resale and local commerce. I hope you guys find this article helpful. If you have any questions, kindly let us know, and thanks for staying up till the end.
