






Introduction
Credit Card Ownership and Usage Statistics: In recent years, thousands of people use credit cards to buy things every day, especially online. Most people are using at least one card because it is quick and simple. Credit cards often feel safer than cash, and they provide rewards such as cash back, points, and additional purchase protection.
This article on credit card ownership and Usage Statistics not only reports the total number of cardholders but also examines usage patterns and explains which groups are more likely to hold cards and what factors affect their spending. Several statistical indicators are derived from insights into payment habits, such as on-time payments, minimum payments only, or the maintenance of an emergency balance.
Editor’s Choice
- The total number of credit card accounts in 2025 is estimated to reach around 642 million.
- Expensify further stated that more than 800 million credit cards are in circulation across the United States.
- Only 15% of U.S. adults applied for a new credit card in 2025.
- Each year, approximately 25.5% of American shoppers apply for a new credit card, and approximately 77.8% of those applications are approved.
- Among cardholders, 14.2% have poor credit scores (300-579), and 14.9% fall in the fair range (580-669).
- capitaloneshopping.com further reports that people aged 40 and younger are most likely to apply for new credit cards, with 29.1% doing so each year.
- North America leads with 74.7% of consumers owning a credit card, followed by Oceania (54.3%) and Europe (37.8%).
- Among boomers ages 61-79, 84% have at least one card.
- In the U.S., the South has the highest credit card share at 52%.
- From January to December 2024, Brazil accounted for the largest share of credit card wins, at 72%, followed by Canada (68%) and South Korea (61%).
- A report from Coin Law further states that, in 2025, credit cards will be the primary payment method for 52.8% of U.S. adults nationwide.
- In 2025, Chase led U.S. issuers in purchase volume, with USD 1.21 trillion in purchase volume.
- Approximately 60% of Gen Z reported having a credit card in their early 20s.
- As of 2025, almost 27% of credit card applications were denied; those under 30 were the primary reason, due to low scores.
General Credit Card Ownership And Usage Statistics
- A report published by bankrate.com states that approximately 74% of Americans have a credit card, and 46% of cardholders carry unpaid balances.
- Credit is used for roughly 35% of payments, and top issuers include American Express, Bank of America, and Capital One.
(Source: infogram.com)
- Most people keep around three to four active cards in their wallets.
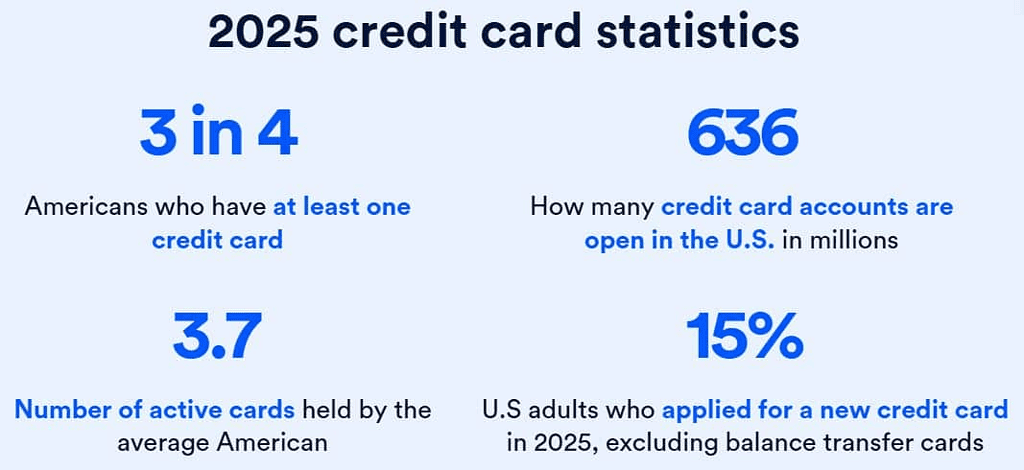
- There are 636 million credit card accounts open in the U.S.
- It also states that the average American holds 3.7 active cards.
- Only 15% of U.S. adults applied for a new credit card in 2025.
- According to Capital One Shopping, in 2025, Americans hold approximately 1.27 billion credit cards, and this total is expected to reach approximately 1.45 billion by 2030.
- About 216.3 million U.S. adults (81%) have at least one credit card in their own name.
- On average, each cardholder keeps three active cards and makes up to 264 card purchases per year.
- Since 2005, the number of active credit card accounts has risen by 40.9%.
- Additionally, the average number of cards per person increased by 25.6%, from 2.4 in 2020.
- On average, an American carries about 3.9 credit cards, including those stored in a digital wallet.
- Credit cards account for approximately 31% of all payment transactions nationwide.
Global Number Of Credit Card Accounts Statistics
(Reference: imagedelivery.net)
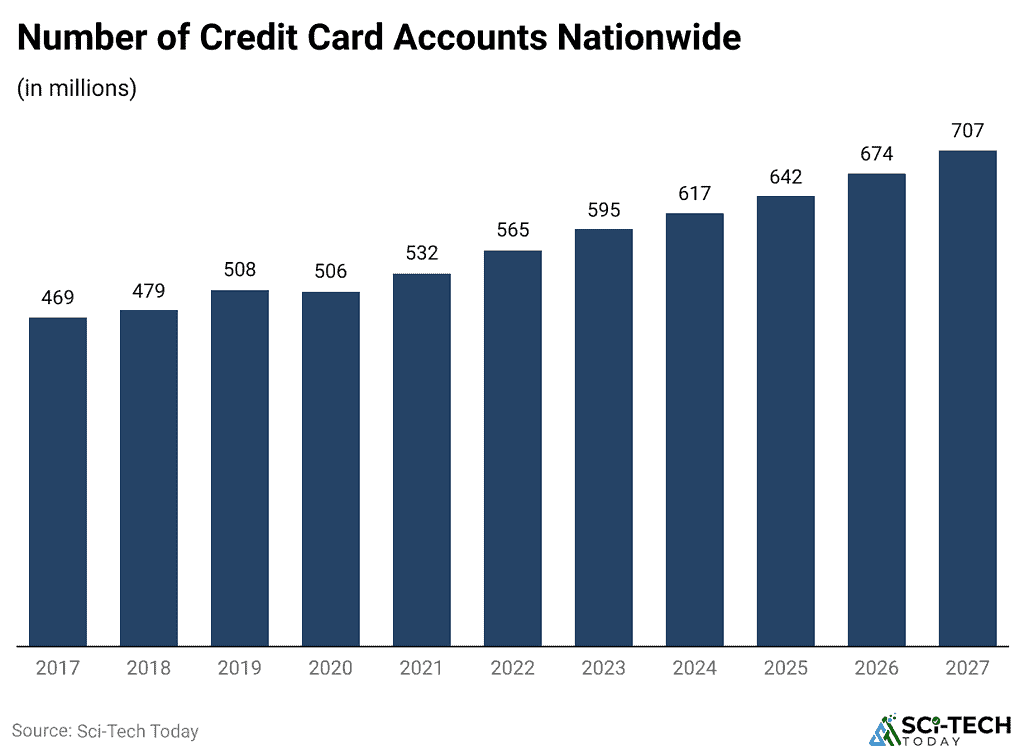
- The total number of credit card accounts in 2025 is estimated to reach around 642 million.
- Followed by 674 million in 2026 and 707 million in 2027.
Credit Card Account Statistics
- Each year, approximately 25.5% of American shoppers apply for a new credit card, and approximately 77.8% of those applications are approved.
- As of 2025, consumers have an average credit score of 714.
- People with scores from 681 to 759 apply most often, with 32.2% seeking a new card annually.
- Among consumers scoring 680 or below, 28.0% applied within the past year, whereas 22.7% of those scoring 760 or higher did so.
- Across all cards, the average total credit limit per person is USD 29,855.
- Cardholders carry an average balance of USD 6,618 in 2025.
- Over the past year, 15.7% asked for higher limits, and 62.2% were approved.
Cardholders Credit Scores Statistics
(Source: imagedelivery.net)
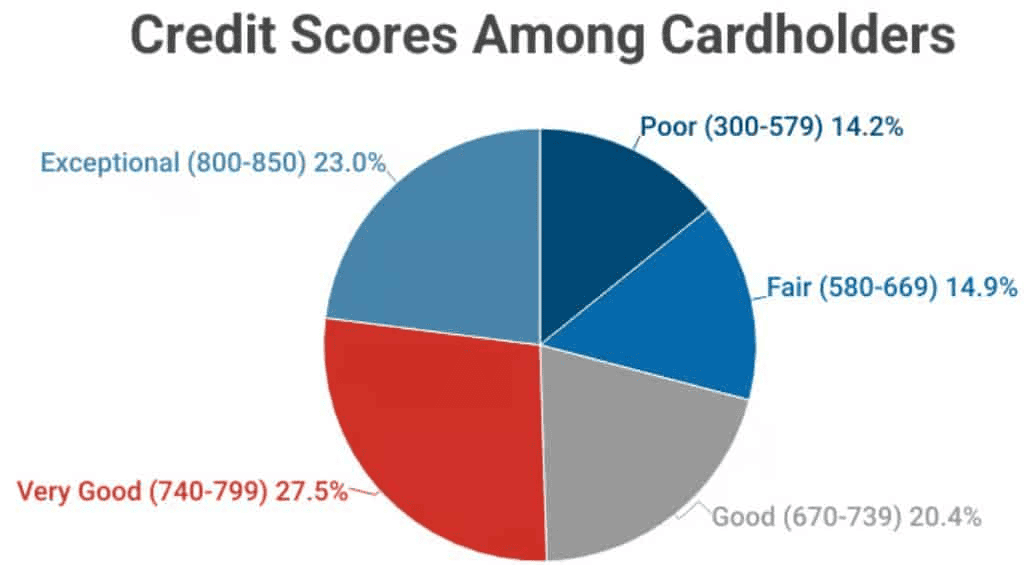
- Among cardholders, 14.2% have poor credit scores (300-579), and 14.9% fall in the fair range (580-669).
- Another 20.4% are rated good (670-739), while the largest share, 27.5%, have very good scores (740-799).
- The remaining 23.0% are in the exceptional category (800-850).
Credit Card Ownership Statistics By Demographics
- capitaloneshopping.com further reports that people aged 40 and younger are most likely to apply for new credit cards, with 29.1% doing so each year.
- In 2025, 23.2% of cardholders in this age group also ask for a credit limit increase.
- Among consumers aged 41 to 59, almost 27.1% apply annually, and 17.8% request a higher limit.
- Individuals aged 60 and over, 21.1% apply for cards, whereas only 8.5% seek a limit increase.
- Card ownership increases with age: individuals aged 45-79 hold 4.4 active cards, those aged 29-44 hold 3.4, and those aged 18-28 hold 2.2.
By the Top 10 States in the U.S.
| State | Average Cards per Cardholder | Estimated Total Credit Cards (millions) |
| California | 3.8 | 95.5 |
| Texas | 3.8 | 72.7 |
| Florida | 4 | 61.1 |
| New York | 3.9 | 50.2 |
| Pennsylvania | 3.8 | 32.2 |
| Illinois | 3.9 | 31.6 |
| Ohio | 3.8 | 28.7 |
| Georgia | 3.7 | 25.9 |
| New Jersey | 4.2 | 25.4 |
| North Carolina | 3.6 | 25.3 |
Credit Card Usage Statistics
(Reference: imagedelivery.net)
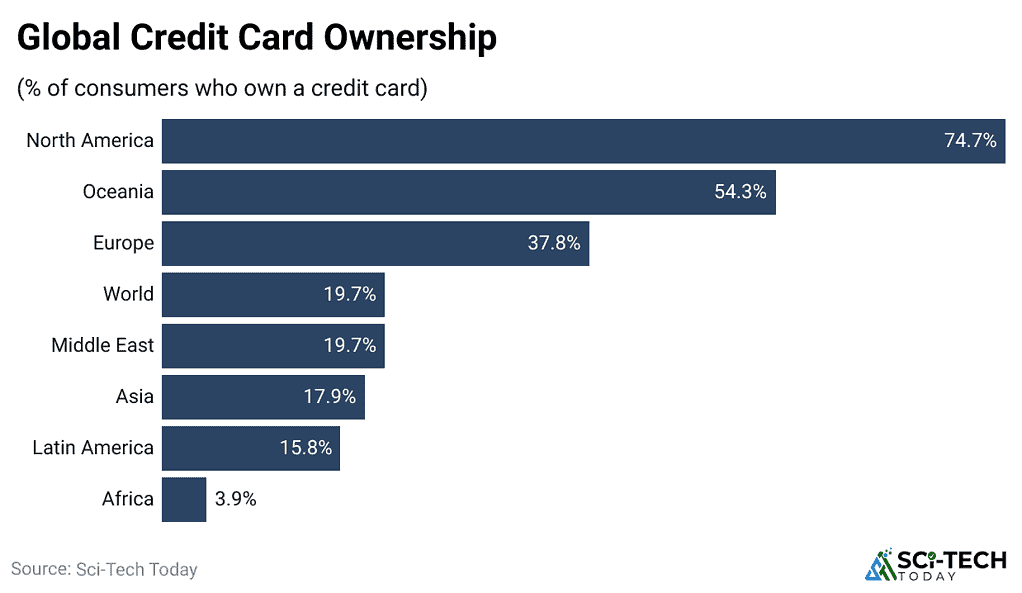
- North America leads with 74.7% of consumers owning a credit card, followed by Oceania (54.3%) and Europe (37.8%).
- Globally, the share of consumers who own a credit card is 19.7%, which is the same as in the Middle East (19.7%).
- Usage rates are lower in Asia (17.9%) and Latin America (15.8%), and are lowest in Africa (3.9%).
Americans Have At Least One Credit Card Statistics
(Reference: bankrate.com)
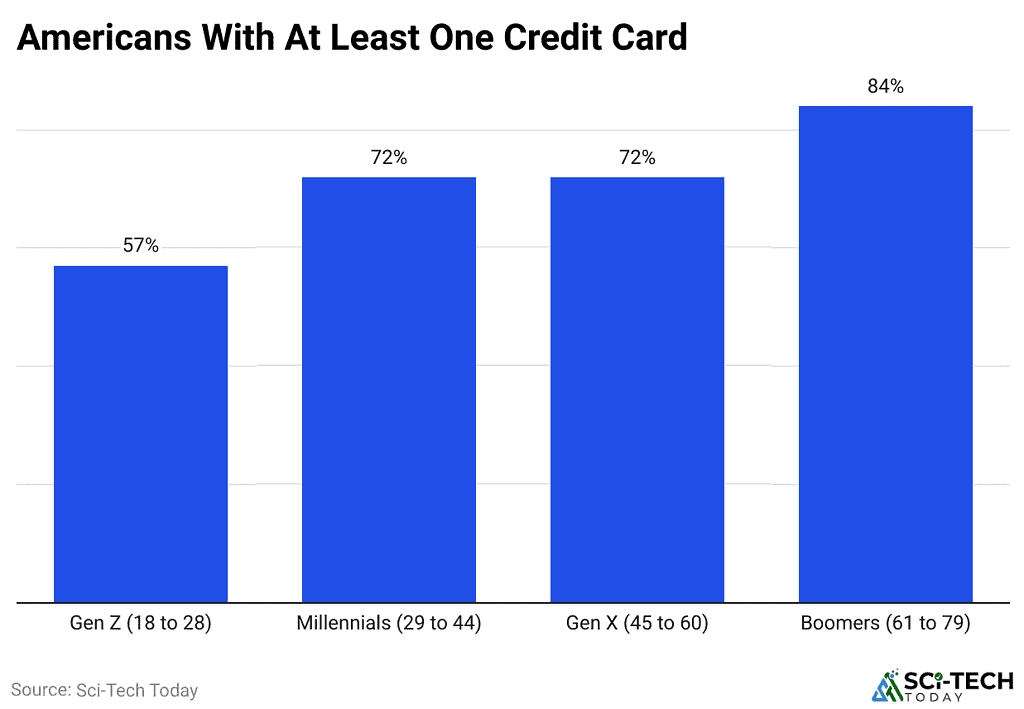
- Among boomers ages 61-79, 84% have at least one card; Gen X ages 45-60 and millennials ages 29-44 both sit at 72%, while Gen Z is lower at 57%.
- Card ownership is close between genders: 74% of men have cards, compared with 72% of women.
- 90% of people earn more than USD 100,000, followed by 88% (USD 80,000-USD 99,999), 83%(USD 50,000-USD 79,999), and 61% (under USD 50,000).
- Suburban residents lead at 77%, followed by city (73%), rural (69%), and town (66%). By race, rates are 77% White, 71% Hispanic, 56% Black, and 67% other races.
- In the U.S., the South has the highest credit card share at 52%, followed by the Midwest at 45% and the Northeast at 43%, whereas the West has the lowest share at 41%.
Country Uses Debit Card Statistics
(Source: statcdn.com)
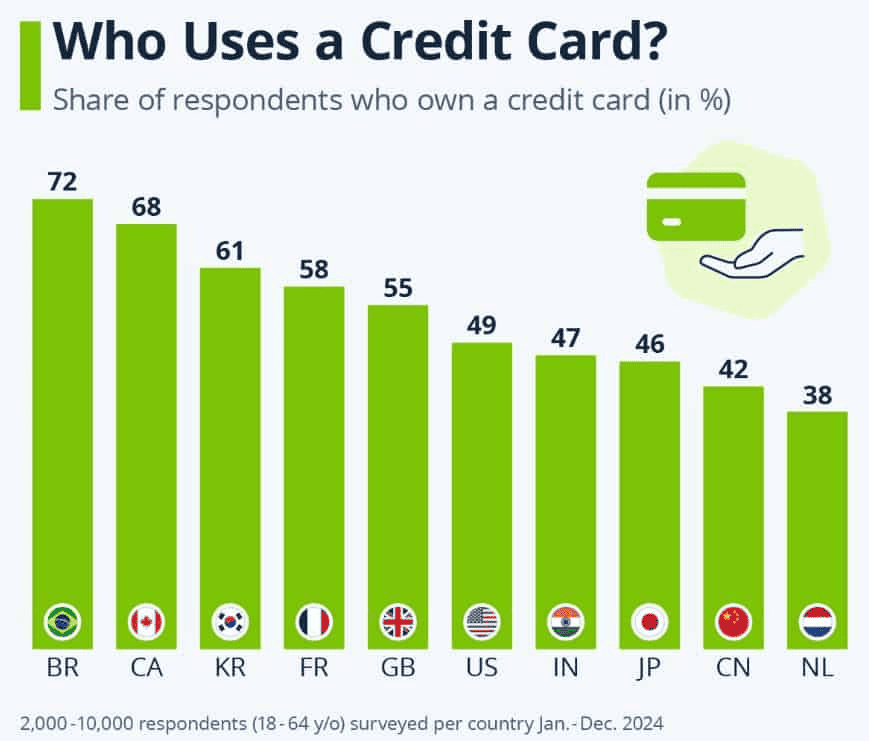
- From January to December 2024, Brazil accounted for the largest share of credit card wins, at 72%, followed by Canada (68%) and South Korea (61%).
- Meanwhile, the countries’ debit card use shares include France (58%), Great Britain (55%), the United States (49%), India (47%), Japan (46%), China (42%), and the Netherlands (38%).
Credit Card User Preferences
- Coin Law reports that in 2025, credit cards remained the main payment tool for 52.8% of U.S. adults.
- 91% of Millennials own at least one credit card, followed by 83% (Gen X) and 68% (Baby Boomers).
- Value drives selection. Among cardholders, 81% say cash back matters most.
- Credit cards linked to Apple Pay, Google Pay, and Samsung Pay are up 49% year over year.
- Online purchasing now accounts for 44% of credit card transactions.
- The average shopper holds 4.3 cards, but people earning over USD 150K often carry 6 or more to stack rewards.
- Additionally, 62% use card-linked loyalty programs, and 84% of them prioritise travel benefits.
Credit Card Issuers Statistics By Purchase Volume
(Source: coinlaw.io)
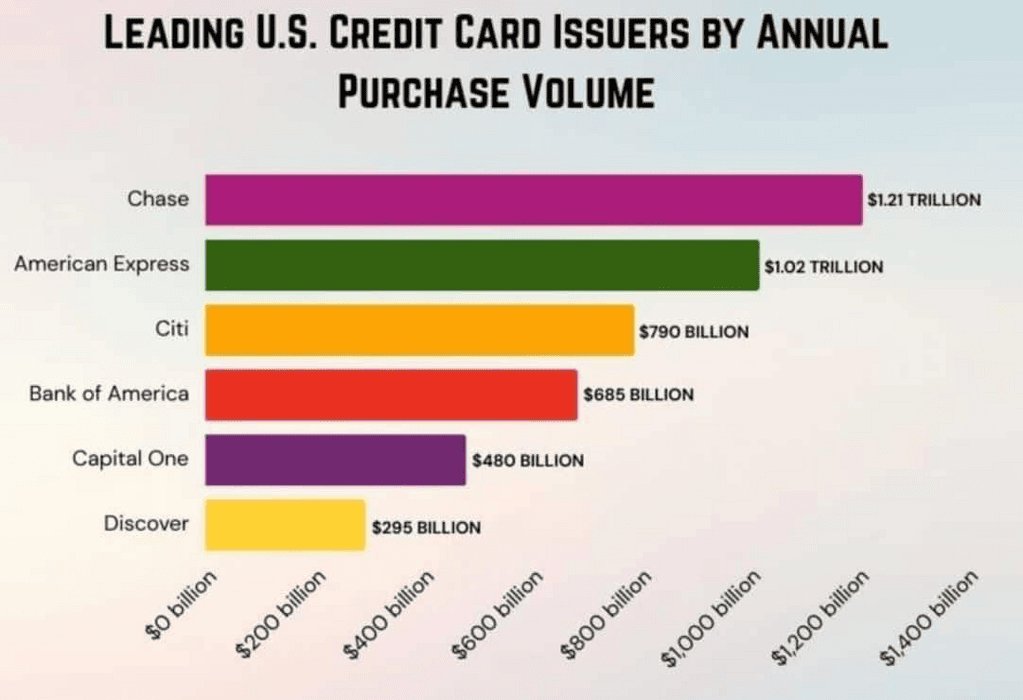
- In 2025, Chase led U.S. issuers in purchase volume, with USD 1.21 trillion in purchase volume.
| Company | Valuations of 2025 (USD) |
| American Express | 1.02 trillion |
| Citi | 790 billion |
| Bank of America | 685 billion |
| Capital One | 480 billion |
| Discover | 295 billion |
Reasons People Choose Credit Cards Over Other Payment Methods
- According to Expensify.com, tap-to-pay reduces checkout time by 63%, so payments are much quicker than using cash.
- Approximately 77% of shoppers choose credit cards primarily for better fraud protection than debit cards.
- Rewards typically return approximately 1.6 cents per dollar spent, and building credit matters to 41% of Gen Z and 40% of millennials who often use cards.
Credit Card Spending Habits Statistics
- Less than 50% of adult card users carried a balance during the last 12 months.
- Meanwhile, credit cards pay for 33% of restaurant purchases.
- Still, card users spend the most at restaurants, amounting to nearly USD 30 billion annually.
- In 2024, more than 80% of U.S. shoppers used credit or debt to finance the holidays.
- Online purchases account for 69%, and 32% are made via mobile devices.
Credit Card Usage Statistics By Demographics
- Approximately 60% of Gen Z reported having a credit card in their early 20s, whereas 54.5% of millennials reported having one at the same age.
- On average, an American carries about 3.9 active credit cards.
- Credit cards account for approximately 31% of total retail spending.
United States Credit Card Debt Analyses by Age Group
| Age group (Years) | Typical (median) credit card debt (USD) | Average credit card debt (USD) | Share with credit card debt |
| 18-34 | 1,700 | 4,070 | 48.5% |
| 35-44 | 2,900 | 6,370 | 52.6% |
| 45-54 | 3,000 | 6,660 | 57.0% |
| 55-64 | 3,500 | 7,530 | 44.3% |
| 65-74 | 3,500 | 7,720 | 33.9% |
| 75+ | 1,700 | 3,990 | 29.8% |
Credit Cards Daily Spending Statistics By Industry
- Coinlaw.io reports that in 2025, retail accounted for 28%, while dining out and food delivery accounted for 23%, and travel and transport for 16%.
- Followed by Groceries (12%), Health (9%), Digital entertainment (11%), Education and child care (3%).
Credit Card Statistics By Application And Rejection Rates
- As of 2025, 27% of credit card applications were denied, and among people under 30, the primary reason was low scores.
- Approximately 43% of millennials applied for at least one new card, but credit and income checks resulted in an 18.5% rejection rate.
- If the score is below 600, denials exceed 42%.
- High-income homes saw only 6.5% denied.
- Premium rewards approvals now average 728, while prequalification cuts rejections by 13%.
- Men are approved at 73%, and women at 69%.
Credit Card Ownership and Usage Statistics by Impacts of Economic Factors
- According to Expensify.com’s 2025 report, with inflation remaining high, middle-income families are using credit cards 18% more for daily expenses.
- By early 2026, total U.S. credit card debt had risen to more than USD 1.17 trillion, while average interest rates reached 22.8%.
- Emergencies account for 25% of surprise billing charges, primarily due to medical bills.
Conclusion
The article on credit card ownership and usage statistics further elaborates that it concerns not only card ownership but also how people manage their finances. Globally, thousands of people choose credit cards for receiving secure payments, convenience, and fast online or in-store shopping. As they include higher interest rates, require minimum payments only, and overspending can quickly increase the balance and create difficult debt.
To stay financially safe, people should use credit cards carefully, know the fees, and pay the full amount or pay on time every month. The above statistical information will help you better understand the topic.
FAQ
People use them for easy payments, online shopping, emergencies, and sometimes for rewards and offers.
Safe payments, convenience, rewards, and the ability to help build a credit history when used properly.
Overspending, paying the minimum amount, late fees, and high interest charges can lead to debt.
Overspending, paying only the minimum amount, late fees, and high interest charges can lead to debt.
Use it only for planned expenses, check fees and interest rates, and repay the full amount (or at least pay on time) every month.