
Introduction
Online Shopping Statistics: Online shopping has irrevocably changed the global retail landscape, changing how billions of consumers find, evaluate, and purchase products and services.
This deep dive into online shopping statistics presents the most current and authoritative data, offering vital insights into market valuation, regional growth dynamics, consumer behavior, adoption, and the future trajectory of the e-commerce world. For businesses and analysts alike, understanding these core online shopping statistics is very important for decision-making in this competitive digital era.
Editor’s Choice
- The global total retail e-commerce sales figure is projected to reach an unprecedented $6.8 trillion by 2025.
- The worldwide population engaging in online shopping is expected to swell to nearly 77 Billion People in 2025.
- By 2025, online purchases are anticipated to account for a significant 21% of all global retail sales.
- Sales generated purely through mobile devices, known as M-commerce, are forecasted to surpass $4.089 trillion.
- China retains its position as the single largest e-commerce market globally, being responsible for well over 50% of the world’s total e-commerce transactions by volume.
- The industry’s most persistent challenge remains the high average cart abandonment rate, which consistently hovers around 19%.
- The single most influential factor motivating buyers to complete an online purchase is Free Shipping, cited by approximately 48% of U.S. online buyers as their main incentive.
- Digital Wallets have become the preferred global payment method, accounting for approximately 49% of all e-commerce transactions in 2023.
The Scale of Global Online Shopping
 (Source: shortpixel.ai)
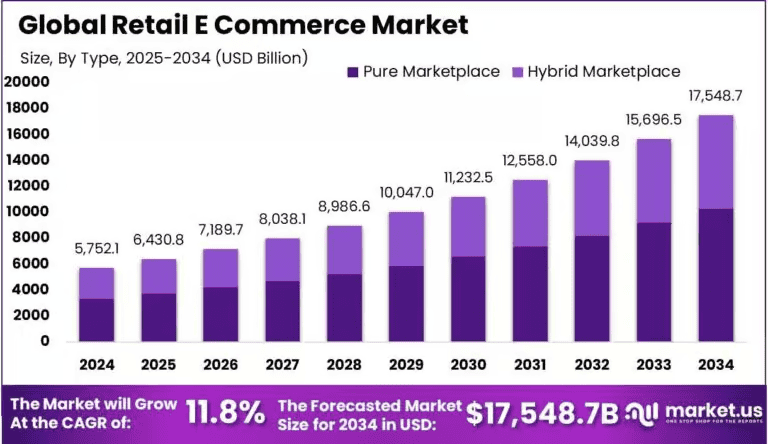
According to Market.us, the monumental growth of online shopping is best understood through its expansive market size and impressive compound annual growth rate across all continents. This segment details the overarching financial metrics that make up the current e-commerce ecosystem and its predicted near-term expansion.
Market Valuation and Growth Metrics
- Global retail e-commerce sales have ballooned to exceed $6.151 trillion in recent measurements.
- Industry projections forecast that the total global retail e-commerce sales will reach $6.8 trillion by the end of 2025.
- The overall e-commerce market is currently experiencing a CAGR of 13.9% between 2023 and 2027.
- By the year 2027, it is anticipated that online shopping will account for 22.6% of all global retail purchases.
- In terms of user volume, an estimated 2.71 billion people across the globe are active participants in online shopping.
- The number of global digital buyers is expected to rise past 3 billion by 2028, underscoring the relentless penetration of online shopping into previously underserved or less digitized markets.
| Data Summary | Market Valuation |
| Global Retail E-commerce Sales Current |
$6.151 Trillion |
|
Projected Sales by 2025 |
$6.8 Trillion |
| Projected E-commerce Share of Retail 2027 |
22.6% |
|
Global Active Online Buyers |
2.71 Billion |
| Annual Growth Rate CAGR 2023 to 2027 |
13.9% |
Consumer Behavior in Online Shopping
 (Reference: tidio.com)
Purchase Frequency and Intent
- A substantial 31% of the global population of online buyers makes at least one purchase every single month.
- The largest concentrated segment of frequent buyers encompasses approximately 818 million buyers.
- A significant trend shows that 80% of buyers routinely conduct thorough product research online before committing to any purchase.
- Cross-border online shopping is becoming increasingly common, with 52% of global online buyers actively searching for and purchasing products from international retailers.
- The biggest concern cited by 42.6% of buyers when engaging in cross-border online shopping is the issue of delayed shipments and logistical hold-ups.
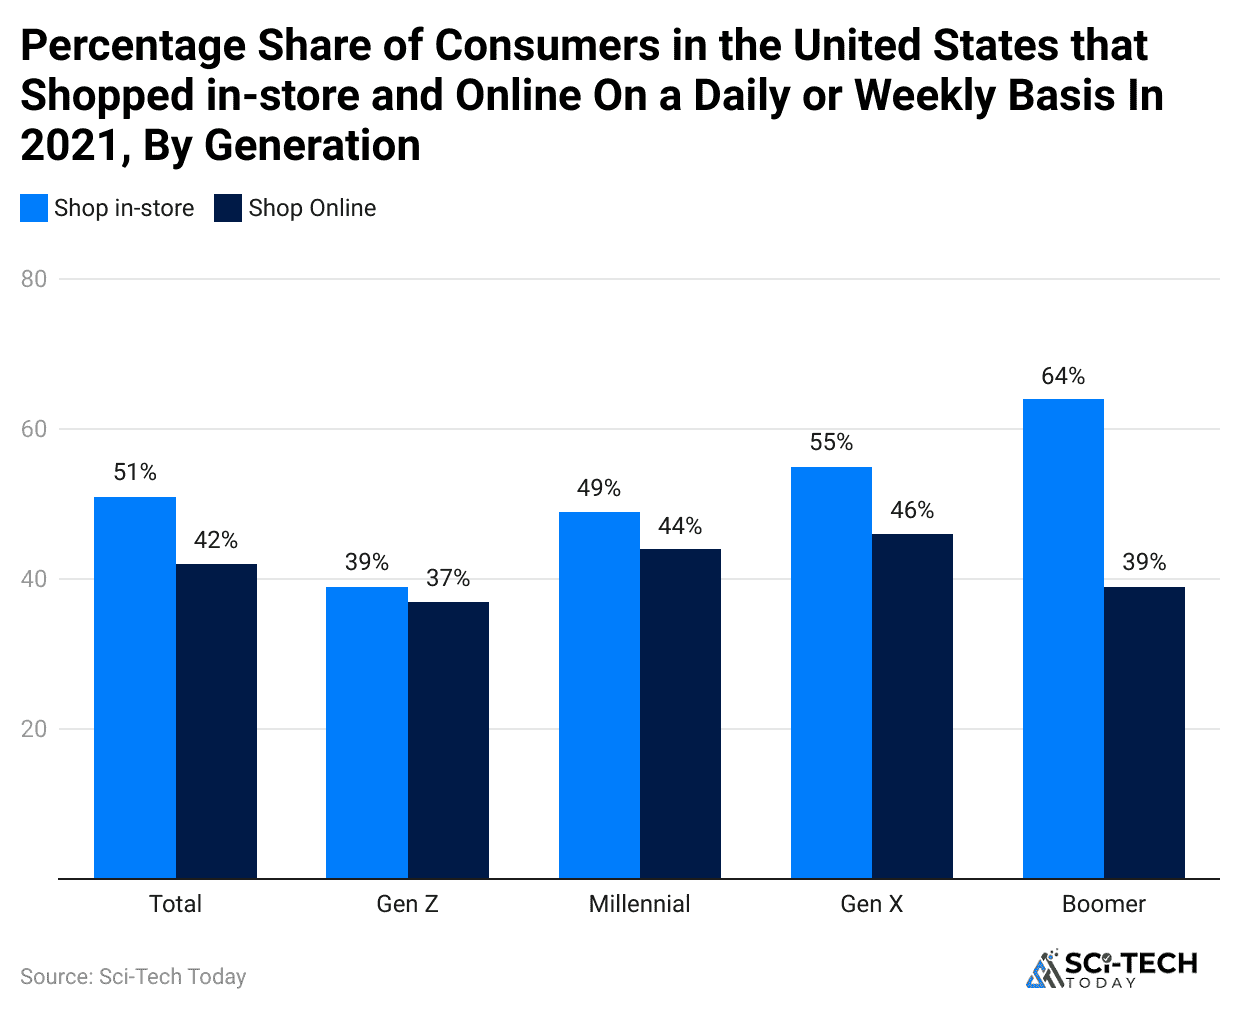
Device Preferences and Path to Purchase
- While mobile devices drive discovery, 69% of buyers still report completing their final purchases using a desktop or laptop computer.
- An overwhelming 85% of consumers exhibit multi-device shopping behavior, starting their product research on one device, such as a smartphone, and ultimately finalizing the transaction on a completely different platform.
- For the younger demographics, specifically Gen Z buyers, over 54% believe that social media platforms are more effective tools for product discovery than traditional search engines.
- Data shows that 35% of all people cite large online shopping marketplaces, like Amazon or eBay.
- The use of voice search for product discovery is escalating rapidly, with over 51% of buyers in the United States already utilizing voice assistants like Alexa or Google Assistant to find desired products.
| Data Summary | Consumer Habits |
| Weekly Online buyers | 818 Million |
| Buyers Researching Before Purchase | 80% |
| Purchase Completion Device Preference | Desktop/Laptop 69% |
| Multi-Device Shopping Adoption | 85% |
| Cross-Border Shopping Frequency | 52% of Global buyers |
| Millennials Influenced by Social Media | 35% |
Geographical and Regional Dynamics of Online Shopping
 (Reference: tidio.com)
Leading Markets and Spending Power
- China indisputably reigns as the world’s largest online shopping market, responsible for well over 50% of the world’s total e-commerce transactions.
- The United States market is projected to generate an impressive $1.29 trillion in e-commerce revenue in 2025, firmly establishing it as the 2nd largest and a dominant force in high-value digital transactions.
- Western Europe generally demonstrates the highest average annual spending per online buyer, with the United Kingdom frequently cited as having per-buyer spending that can exceed $4,200 annually.
- North America holds a massive market share in specialized sectors, particularly in advanced technology and software sales, with its total e-commerce revenue standing near $1,137 billion.
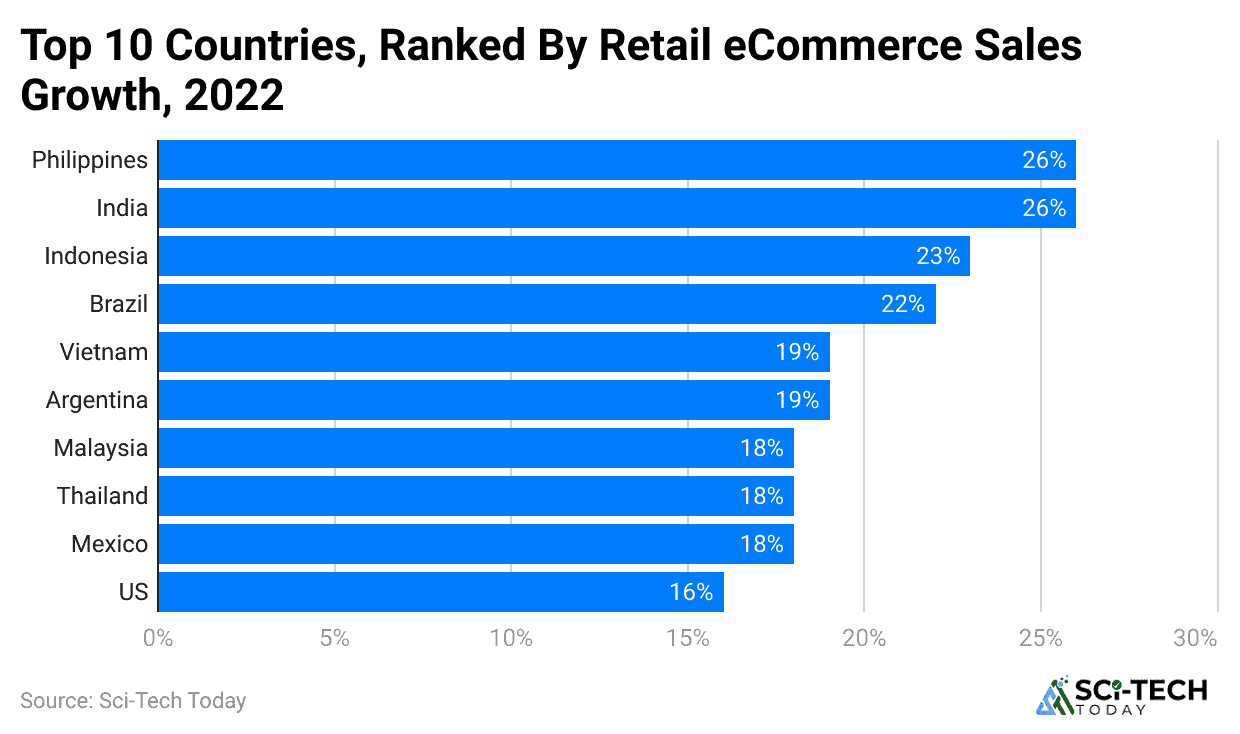
- The most dynamic growth in the number of new online shopping users is currently being observed in the Middle East & Africa and Latin America regions, which both experienced user growth rates above 4.6% YOY.
- Despite its mature market, the number of online buyers in the United States continues to expand, projected to grow by an additional 60 million individuals between 2024 and 2029.
User Penetration and Preferences
- A striking 92% of consumers in the U.S. report actively engaging in online shopping, indicating a near-saturation point for the consumer base in one of the most developed e-commerce markets.
- A significant 43% of U.S. consumers express a preference for shopping online over making purchases in physical stores.
- Growth rates for new online shopping adoption are slowing in highly saturated markets like Western Europe, which recorded a comparatively modest user growth rate of only 1.1% in a recent annual measurement.
- In the Asia-Pacific region, the country of South Korea stands out with 44.4% of its internet users reporting weekly mobile purchases.
| Data Summary | Regional Trends |
| Top Global Market Value | China 50% of Global Transactions |
| U.S. Projected Revenue 2025 | $1.29 Trillion |
| Highest Average Spend Per Buyer | United Kingdom $4,200 Annually |
| Highest User Penetration | U.S. 92% of Consumers |
| Highest Mobile Shopping Adoption | South Korea 44.4% Weekly Mobile Purchases |
| Highest New User Growth Area | Middle East & Africa 5.2% Increase |
Cart Abandonment and Conversion Statistics in Online Shopping
 (Reference: oberlo.com)
The Cost of Cart Abandonment
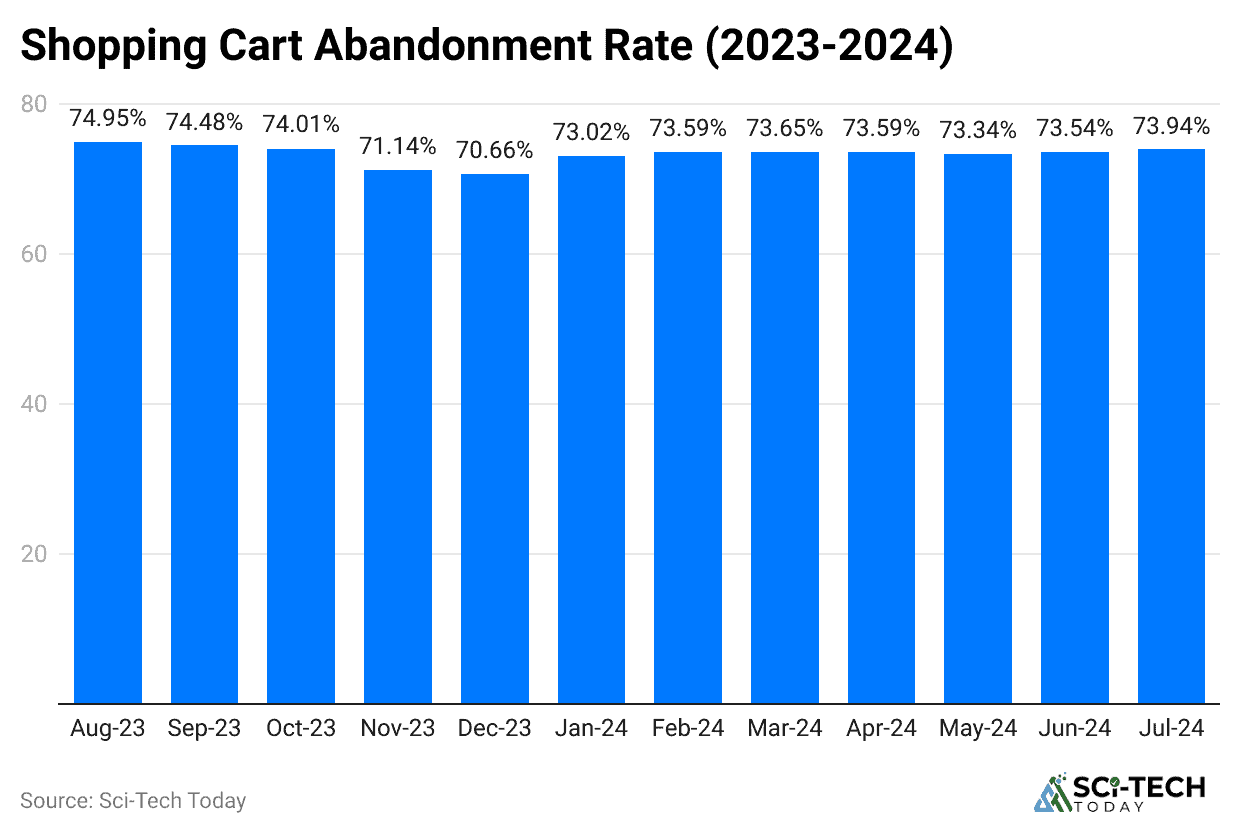
- The average global cart abandonment rate consistently hovers at a high of 70.19%.
- The financial loss due to abandoned carts is significant, with e-commerce retailers collectively losing an estimated $18 billion annually in potential revenue globally.
- The top reason cited by 48% of online buyers for abandoning their cart is the unwelcome surprise of extra costs.
- A lengthy or overly complex checkout process leads to abandonment for 17% of buyers.
- Site performance is a measurable deterrent, as a slowdown in website loading times can cause shopping cart abandonment to increase by a substantial 30%.
Incentives and Barriers to Purchase
- Free delivery is overwhelmingly the primary motivator, with 48% of U.S. online buyers specifically citing it as the main reason they choose to shop on a platform like Amazon.
- The requirement for a new customer to create an account before purchasing causes 24% of potential buyers to abandon their shopping cart.
- Concerns regarding the delivery timeline are significant, as 22% of buyers will abandon a purchase if the anticipated delivery times are considered too long or unacceptable for their needs.
- Customer reviews wield immense influence, as a powerful 93% of buyers report reading reviews before making a purchase, and 94% are influenced by negative reviews to avoid a specific business entirely.
| Data Summary | Conversion Metrics |
| Global Cart Abandonment Rate | 70.19% |
| Annual Lost Revenue Abandoned Carts | $18 Billion |
| Top Abandonment Reason | High Extra Costs 48% |
| Abandonment Due to Required Account Creation | 24% |
| Abandonment Due to Slow Site Speed | Increases by 30% |
| buyers Reading Reviews | 93% |
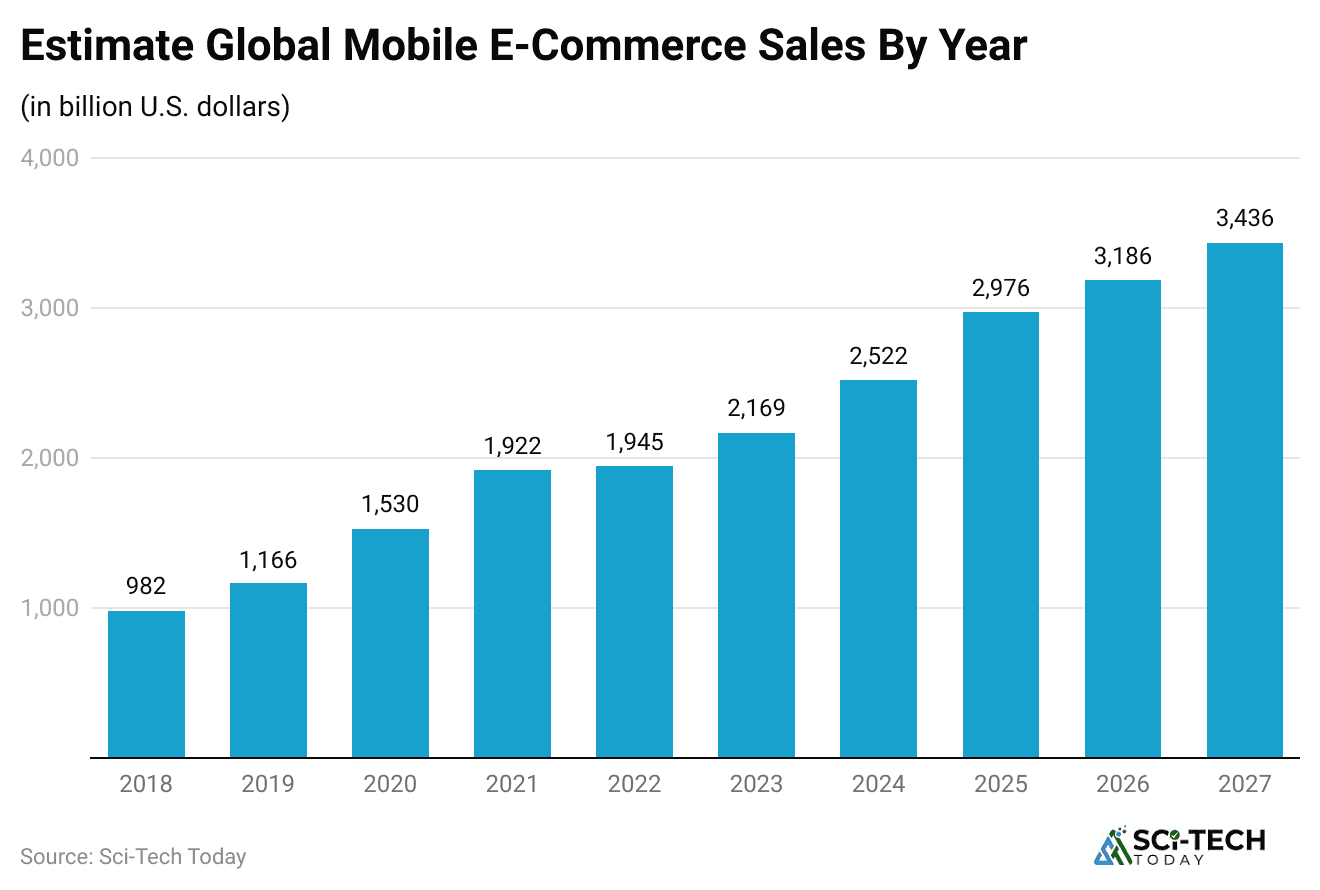
The Dominance of Mobile Commerce and Payment Trends
 (Reference: redline.digital)
M-commerce Saturation
- Mobile commerce revenue is rapidly approaching a total of $2 trillion globally for 2024, demonstrating the immense financial volume flowing through smartphone-based transactions for online shopping.
- Mobile devices account for an impressive 66% of all global retail orders placed online, firmly establishing the smartphone as the dominant tool in the end-to-end online shopping journey.
- Experts predict that mobile e-commerce sales alone are set to breach the $710 billion mark in the United States by 2025, underscoring the massive financial potential of mobile-first.
- Specifically, in advanced markets like the United Kingdom, mobile shopping already represents more than 50% of all online retail sales, illustrating a complete market transformation towards mobile dependency.
- Despite their overwhelming popularity for adding items to the cart, mobile devices generally exhibit lower conversion rates at checkout compared to desktop computers, pointing to lingering security or user experience gaps.
Evolving Payment Methods
- Digital wallets such as PayPal, Apple Pay, and Google Wallet have solidified their position as the preferred method, accounting for a massive 49% of all global e-commerce transactions in 2023.
- The usage share of digital wallets in e-commerce transactions is expected to keep climbing, with a projected CAGR of 14.9% between 2023 and 2027.
- The popularity of Buy Now, Pay Later BNPL services is seeing explosive growth, and is anticipated to account for nearly 11% of all online purchases in the U.S. by April 2024, driven heavily by younger consumers.
- Despite the rise of digital wallets, traditional credit and debit cards remain highly relevant in the U.S., with 52% of consumers using debit and 47% opting for credit cards for their online shopping needs in 2023.
- Payment security remains a major concern, as a high number, 73% of consumers, explicitly prioritize payment security when they are choosing an online retail platform for their purchases.
| Data Summary | Mobile & Payments |
| Mobile Retail Order Share | 66% |
| Projected U.S. Mobile Sales 2025 | $710 Billion |
| Digital Wallet Transaction Share | 49% |
| Projected BNPL Share U.S., 2024 | 11% |
| Consumers Prioritizing Payment Security | 73% |
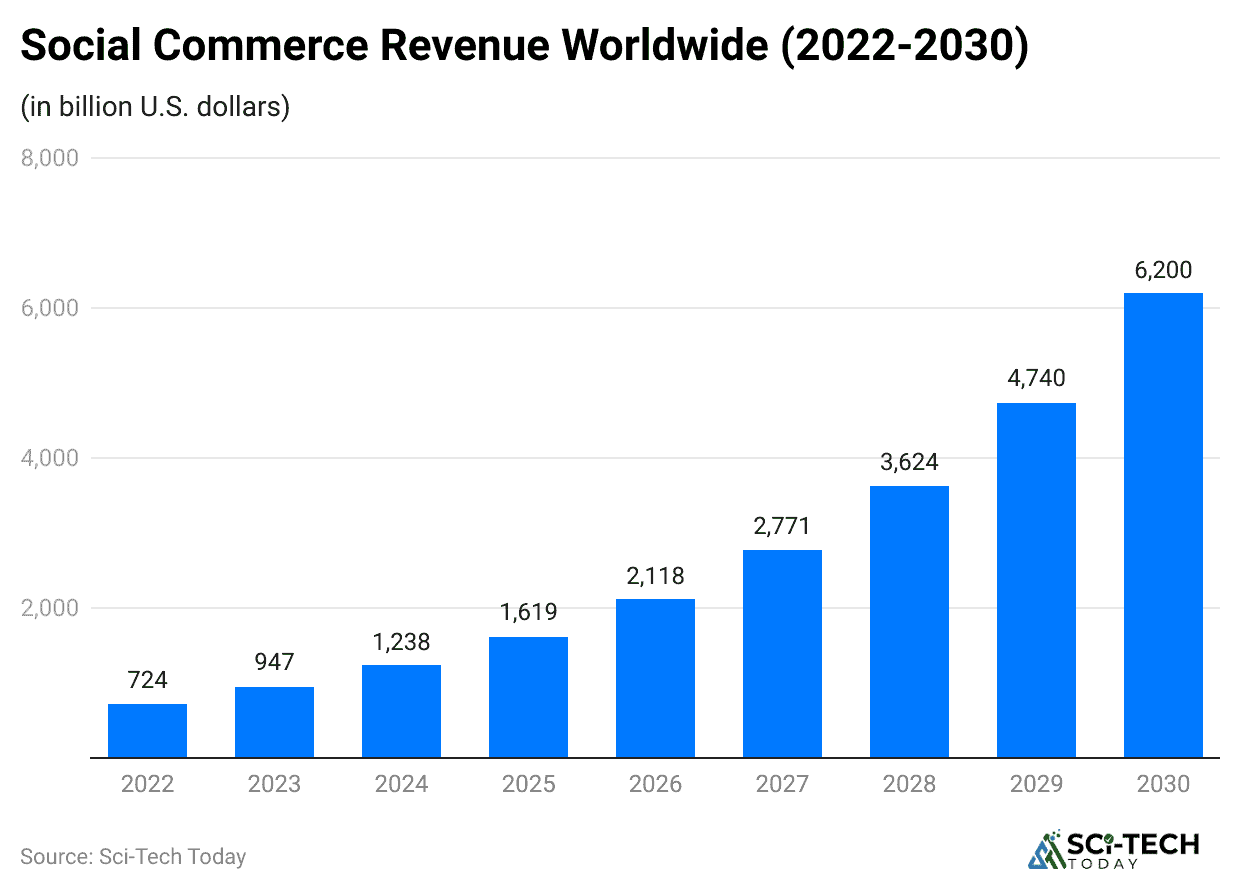
The Influence of Social and Visual Commerce in Online Shopping
 (Reference: tidio.com)
The Social Commerce Tidal Wave
- Global spending on social media commerce reached a massive $992 billion in a recent year, demonstrating the already significant financial volume passing through social platforms.
- Projections indicate a monumental future for this channel, with social commerce spending forecast to surge to an astonishing $8.5 trillion globally by 2030, fundamentally redefining the boundaries of online shopping.
- The United States has a massive user base engaging in this activity, with over 106.8 million people who actively shop online via various social media platforms.
- A substantial 40% of U.S. buyers report that their purchase decisions are directly influenced by the content and promotions they encounter on social media channels.
- Influencer recommendations hold significant sway, with 49% of social commerce buyers confirming they make a purchase based on the suggestion of a social media influencer they follow.
Visual and Immersive Shopping
- 87% of consumers report taking direct action, such as clicking a product link or visiting a brand profile, after encountering a product on visual platforms like Instagram.
- For product discovery, 54% of social media users explicitly turn to platforms like Facebook and TikTok to research new products, bypassing traditional search engines for initial exploration.
- Platforms focused on visual inspiration are highly effective: 80% of Pinterest users state that they discover new brands or products directly through their use of the platform.
- Younger consumer groups like Millennials and Gen Z are notably more likely, by a factor of 2 to 3 times, to shop using new immersive touchpoints, including virtual try-ons and live stream shopping events.
| Data Summary | Social & Visual Commerce |
| Annual Global Social Commerce Spending | $992 Billion |
| Projected Spending by 2030 | $8.5 Trillion |
| U.S. Social buyers | 106.8 Million |
| Buyers Influenced by Social Media | 40% of U.S. buyers |
| Consumers Taking Action After an Instagram Post | 87% |
Preferred Categories and Retailer Dominance in Online Shopping
 (Reference: e-strategy.com)
Leading Product Categories
- The Clothing, Shoes & Jewellery category maintains a strong position, with 43% of U.S. consumers reporting having ordered apparel items online within the past year.
- Globally, Clothing and footwear are the most favored categories for cross-border online shopping, purchased from abroad by 39% of consumers seeking variety or lower prices.
- Beyond apparel, the Home & Kitchen category is highly popular, attracting 32% of online buyers who look for furnishings, appliances, and decorative items through digital channels.
- Post-pandemic trends show a profound change in consumer behavior: before 2020, only 36% of Americans ordered groceries online, but that number has since jumped significantly to 55%.
- The U.S. grocery delivery e-commerce segment alone is a massive market, expected to generate revenues that will exceed $422 billion by 2028.
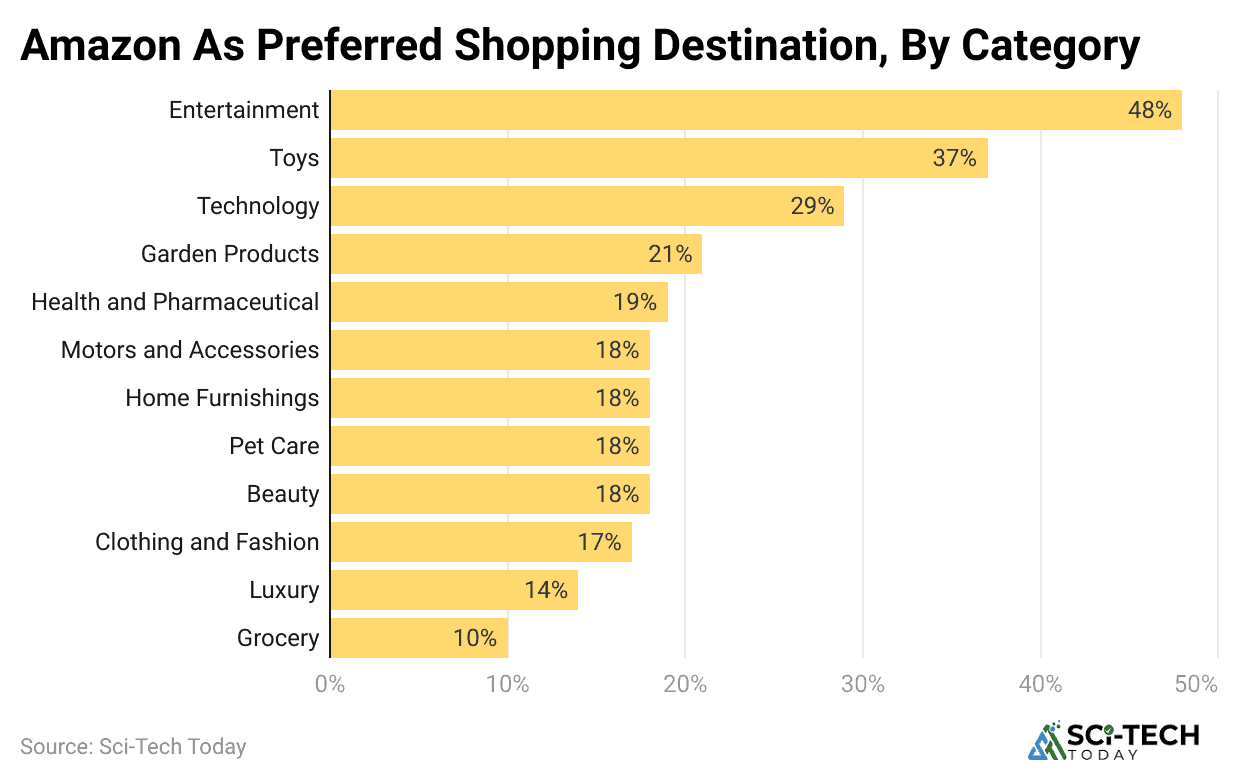
E-commerce Platform Market Share
- Amazon maintains an overwhelming monopoly on the online shopping space in the U.S., dominating the sector with a colossal market share of 37.8%, making it the primary starting point for millions of buyers.
- Walmart is a distant but strong competitor, holding a significant 6.3% share of the total online retail market, leveraging its extensive physical infrastructure to support its digital operations.
- Major brands like Apple and eBay are also formidable players, capturing market shares of 3.9% and 3.5% respectively, underscoring the fragmented, yet concentrated, nature of the leading platforms.
- The presence of specialized retailers like The Home Depot and Best Buy, both holding shares of 2.1% and 1.6% respectively, demonstrates the crucial role of niche and vertical e-commerce solutions.
- The scale of Amazon’s dominance is further cemented by the fact that nearly half, 48% of consumers, cite free delivery as the main reason they choose to conduct their online shopping on its platform.
| Data Summary | Categories and Platforms |
| Largest U.S. E-commerce Market Share | Amazon 37.8% |
| Most Popular Category U.S. Purchases | Clothing 43% |
| Most Popular Cross-Border Category | Clothing and Footwear 39% |
| Post-Pandemic Grocery Adoption U.S. | 55% of Americans |
| Projected U.S. Grocery E-commerce Revenue 2028 | $422 Billion |
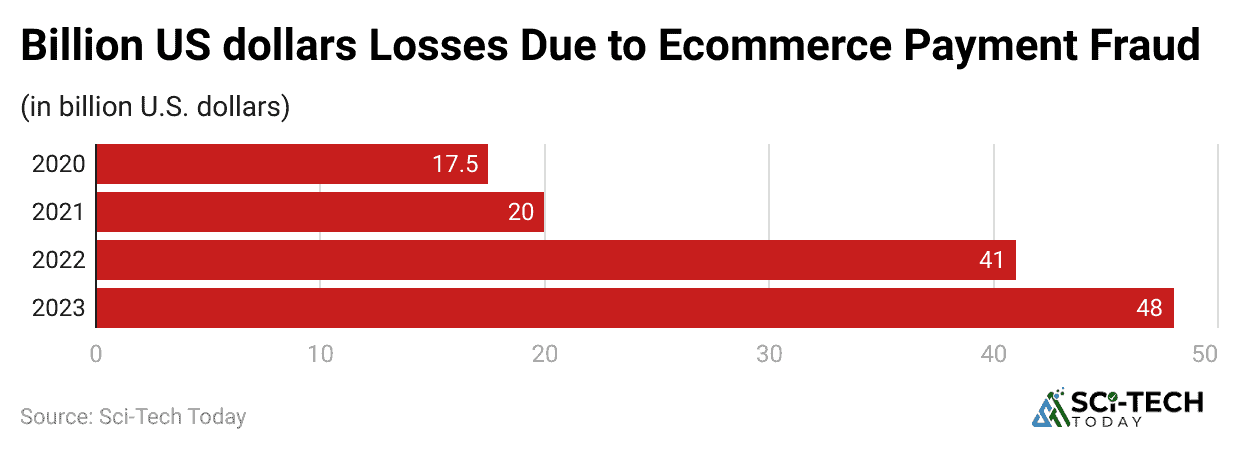
Security and Fraud Concerns in Online Shopping
 (Reference: purchasecommerce.com)
Consumer Trust and Risk Perception
- A significant majority, 92% of U.S. online buyers, express deep concern regarding security when making purchases, signaling that security features are a critical factor in vendor selection.
- A substantial 81% of survey respondents believe that online fraud is a widespread issue, underscoring a general air of skepticism about the safety of digital transactions.
- Phishing remains a potent threat to the online shopping ecosystem, with major online shopping brands accounting for an alarming 41.65% of all financial phishing attempts recorded across the web.
- Nearly one in five users, 18% of online buyers, admit to being hesitant about trusting e-commerce websites with their personal credit card information during the checkout process.
- To build trust, 83% of buyers state that they would be more inclined to shop on websites that transparently and openly address their specific efforts and technologies for preventing fraud.
Business Response and Transparency
- The data indicates that a notable 58% of consumers do not feel that their online retailers are being “overly cautious” or proactive enough in their attempts to prevent digital fraud.
- Beyond fraud, personal spending habits also pose a threat: 38% of consumers worry about the potential for overspending when using credit cards for their convenient online shopping purchases.
- The overall low conversion rate in mobile commerce is partially attributed to these security concerns, as users generally feel more secure entering sensitive payment details on a desktop interface.
| Data Summary | Security and Trust |
| U.S. buyers are Concerned About Security | 92% |
| Buyers Believing Fraud is Widespread | 81% |
| Phishing Share Targeting E-commerce Brands | 41.65% |
| Users Hesitant to Share Credit Card Info | 18% |
| Consumers Who Want Retailers to be More Proactive | 58% |
Conclusion
Overall, these comprehensive statistics analyzed here demonstrate that online shopping is the dominant, rapidly expanding future of global commerce. With global sales projected to reach nearly $7 trillion, and nearly 2.8 billion people participating.
The data highlights several critical, actionable takeaways for any business operating in this space: the urgent need to address the 70.19% cart abandonment rate caused by unexpected fees, the necessity of a seamless mobile experience given that 66% of all orders originate on mobile devices, and the immense, impending influence of social commerce, projected to become an $8.5 trillion market by 2030. I hope you like this article. If you have any questions, kindly let us know. Thanks for reading our complete analysis.
