






Introduction
Subscription Economy Statistics: The subscription economy has become, kind of one of the defining business models of the digital era, reshaping industries like software, streaming, e-commerce, healthcare, automotive, and even manufacturing. Rather than relying on single-purchase moments, companies are leaning more toward predictable repeat revenue, usually via subscription-based services, usage-based billing, and hybrid pricing in between. In 2026, progress in AI, cloud computing, embedded payments, and personalized customer experiences will continue to drive further adoption of subscriptions across regions worldwide.
On the business side, this tends to lift customer lifetime value (CLV), while consumers get a more flexible way to access products and services without major upfront costs, at least not in that same way. Below you can find key subscription economy statistics, covering market size, revenue growth, consumer patterns, SaaS adoption, and emerging trends shaping recurring revenue models in 2026.
Editor’s Choice
- In 2025, the global Subscription Economy Market was valued at USD 557.7 billion.
- The market is projected to reach USD 2,516.5 billion by 2035, growing at a CAGR of 16.3% during 2026–2035.
- North America dominated the market in 2025, holding 42.10% of the global share, equivalent to USD 234.79 billion.
- Consumer adoption is almost universal, with 78% of adults maintaining at least one active subscription, and the average person having around 6.7 subscriptions overall.
- Subscription fatigue is becoming a real business pressure point, as 42% of consumers say they feel overwhelmed by the sheer number of services they pay for.
- In the U.S., consumers spend roughly USD 1,887 per year on subscriptions, while also wasting about USD 321 annually on unused services.
- Healthy SaaS businesses are still showing pretty strong economics, with 108% Net Revenue Retention (NRR) and a sustainably minded 3:1 LTV-to-CAC ratio.
- 43% of SaaS companies already use hybrid pricing models, and this share should rise to 61% by the end of 2026.
- 77% of the leading enterprise software companies have moved to usage-based pricing.
- Payment failures account for roughly 20-40% of total subscription churn, so involuntary churn is one of the most avoidable revenue losses.
- AI-driven payment recovery systems can recover about 60-80% of failed payments.
Subscription Economy Market Size
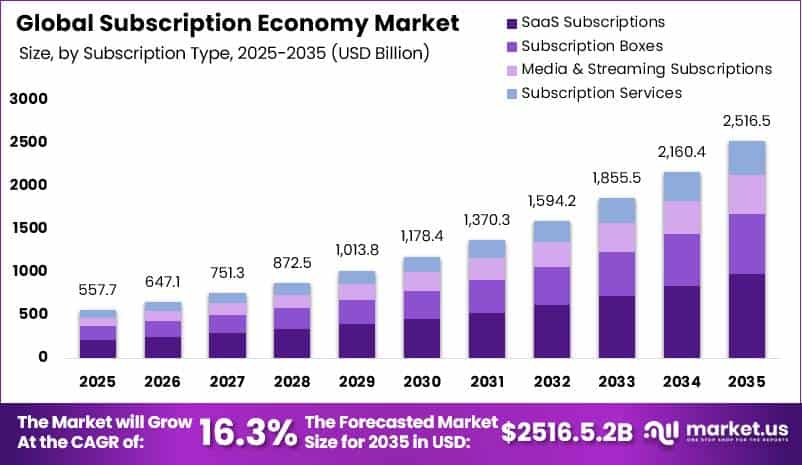
(Source: Market.us)
- According to Market.us, the global Subscription Economy Market was valued at USD 557.7 billion in 2025. The market is projected to reach USD 2,516.5 billion by 2035, expanding at a CAGR of 16.3% during 2026–2035.
- North America held the leading position in 2025, capturing 42.10% of the global market and generating USD 234.79 billion in revenue.
- By Subscription Type, SaaS Subscriptions led with a 38.60% market share, while Media & Streaming Subscriptions are expected to grow at the fastest rate.
- By Business Model, Business-to-Business (B2B) accounted for the largest share at 54.20%, while Business-to-Consumer (B2C) is projected to witness the fastest growth.
- By Payment Model, Recurring Fixed Subscription held the leading share of 49.30%, whereas Usage-Based (Pay-as-you-go) is expected to be the fastest-growing segment.
- By Platform Type, Subscription Management Platforms captured the largest share of 41.10%, while Customer Retention & Analytics Tools are anticipated to grow the fastest.
- By End User Industry, IT & Software (SaaS) led the market with a 36.90% share, while Media & Entertainment is expected to register the highest growth.
- By Customer Type, Enterprises accounted for the largest market share of 58.70%, while SMEs are projected to be the fastest-growing segment.
- By Engagement Type, Monthly Subscriptions held the largest share at 46.80%, whereas On-demand Subscriptions are expected to witness the fastest growth.
- The subscription economy keeps being one of the fastest-growing parts in the global digital economy, mostly driven by real consumer demand and that repeatable recurring revenue vibe.
- In practice, these projections show how subscription models stay favored across cloud services, e-commerce, digital media, and software platforms.
- As per Netflix (January 2025), the firm reported a 16% year-over-year lift in revenue, and that was backed by noticeable growth in paid memberships.
- Roku Inc. rolled out Howdy, an ad-free streaming service set at USD 2.99 per month. It’s a good example of how low-cost subscription pricing is being used to lure value -conscious viewers, while at the same time widening recurring revenue opportunities.
Subscription Economy Consumer Adoption and SaaS Growth
- The newest subscription economy stats point to a market fueled by ongoing revenue, solid consumer take-up and stubborn, resilient SaaS business models.
- According to the Zuora Subscription Economy Index 2026, the global subscription economy is valued at around USD 275 billion and continues to expand at about a 12% year-over-year rate. That number implies sustained interest in subscription-based products and services, not just a short-term fad.
- The West Monroe Partners Survey says 78% of adults have at least one active subscription.
- Meanwhile, C+R Research reports that the typical consumer runs 6.7 subscriptions, this includes free or trial plans, household bundles, or even physical subscription boxes. That mix basically shows subscription services are woven into daily routines in a way that’s hard to ignore.
- Also, for entertainment, the Deloitte Media Survey finds the average household holds 4.1 streaming subscriptions, so demand for digital content keeps hanging around.
- Grand View Research estimates the subscription box market at USD 38 billion, indicating genuine consumer interest in scheduled physical deliveries, not just apps and software.
- Credible 2026 benchmark data from Recurflux and CustomerGauge put the healthy median B2B SaaS monthly churn at roughly 0.5% to 2.0% (or 10-14% annually).
- The SaaS Capital Index reports an impressive 108% net revenue retention (NRR), suggesting that current customers continue to generate more repeat revenue over time, even as budgets tighten.
- The Bessemer Cloud Index indicates a healthy 3:1 lifetime value (LTV) to customer acquisition cost (CAC) ratio, a clear sign that SaaS unit economics remain strong.
- The McKinsey Consumer Survey notes that 42% of consumers report subscription fatigue, indicating growing pressure to demonstrate real value rather than simply keep billing.
- The above numbers imply that the subscription economy keeps expanding, supported by strong consumer participation, more digital services, and solid retention indicators for SaaS.
Consumer Subscription Spending And Behavior
- On the demand side, consumer behavior looks like a mix of stubborn entrenchment and sharper scrutiny.
- Fortunly’s 2026 subscription spending stats say U.S. consumers spend an average of USD 1,887 per year on subscriptions.
- 44% of U.S. consumers spent more on subscriptions in 2025 than the year before, underscoring the shift from owning things to access across entertainment, software, and even everyday products.
- The same study finds that the average U.S. consumer has 3.4 figure strictly measures individual active paid digital subscriptions.
- Importantly, consumers waste an average of USD 26.79 per month on unused paid subscriptions, over USD 321 per year, suggesting that a significant portion of subscription revenue still comes from non-use and that there is ongoing pressure for providers to demonstrate continuous value.
- Recurly’s 2026 State of Subscriptions report, based on data from 76 million unique subscribers and 2,200 global merchants, reinforces this, noting that 52% of consumers cancelled at least one subscription in the past year due to lack of use, emphasizing that churn risk is tied directly to perceived utility
Enterprise and SaaS Subscription Benchmarks
- On the supply side, B2B SaaS subscription businesses in 2026 face a more competitive, efficiency-focused environment.
- The 2026 SaaS Benchmarks Report, which summarizes private B2B SaaS performance, notes that median revenue growth has settled at 26% and net revenue retention (NRR) has compressed to 101%.
- The average customer acquisition cost (CAC) for B2B SaaS is USD 239, but it varies widely by vertical.
- Fintech sits at USD 1,450 CAC, MedTech is USD 921, and project management software lands around USD 891. The reason those CAC numbers matter is pretty simple: the subscription models only beat transactional models when lifetime value meaningfully outweighs acquisition cost. So if CAC climbs faster than retention and ARPU, subscription unit economics start to feel shaky even though the billing is recurring.
- Recurly’s 2026 report also says acquisition rates across subscription businesses have “stabilized around 3%,” while overall subscription growth has cooled to 12.6%.
- A 2026 trends analysis, referencing Gartner and Omdia data, notes that 72.9% of organizations expect IT budgets to increase in 2026.
- Gartner and Omdia data also project software growing 14.7% to USD 1.43 trillion, and IT services increasing 8.7%, which all reinforces the long-term direction toward ongoing services and subscription contracts.
Hybrid Billing and Usage-Based Pricing (UBP)
- Hybrid and usage-based pricing are now among the fastest-growing monetization approaches in SaaS, and they’re slowly replacing classic flat-rate subscriptions. Instead, the pricing models stretch and scale with what customers actually consume.
- According to NXCode’s 2026 SaaS Pricing Strategy Guide, which cites Chargebee’s State of Subscriptions, 43% of SaaS companies already use hybrid pricing models. These mix a fixed subscription fee with extra usage charges.
- NXCode expects that number to rise to 61% by the end of 2026, so yeah, it’s clear the industry is accepting the idea pretty fast.
- For example, Flexera’s 2026 SaaS Management Analysis, which summarizes Metronome’s State of Usage-Based Pricing Report, says 77% of the world’s largest software companies now use consumption-based pricing to generate more revenue from existing customers, not just from new signups.
- The same work also mentions that 78% of organizations that rolled out usage-based pricing did it within the last five years. That kind of timing shows how quickly the market changed, almost like it was immediate.
- NXCode notes that companies running primarily consumption-based pricing see roughly 8 percentage points faster revenue growth, compared with businesses that stick only to fixed per-seat subscriptions.
- Lago claims that top usage-based SaaS businesses often reach around 120-140% net dollar retention (NDR), mostly through organic expansion, not through relentless sales -driven upselling.
- Similarly, Stripe points out that strong hybrid pricing schemes usually keep net revenue retention (NRR) above 100%, meaning expansion beats churn and keeps net revenue positive overall.
- According to Gartner’s pricing forecasts, which Zylos’s 2026 SaaS Pricing Research cites, about 70% of organizations are expected to lean toward usage-based pricing rather than classic per-seat arrangements by 2026, while roughly 40% of enterprise SaaS offerings are expected to include a usage-billing component as well.
- Altogether, the numbers point to SaaS pricing being in a sort of structural shift. There is 43% hybrid adoption today, going up to 61%, then 77% of top software companies using consumption pricing, 78% rolling it in within five years, 8-percentage-point faster revenue growth, 120-140% NDR, NRR above 100%.
- 70% business inclination toward usage-based pricing, and 40% of enterprise SaaS products adding usage billing, so the story is pretty clear: hybrid and usage-based pricing look like the more preferred monetization approaches for today’s cloud and AI -driven software providers.
Involuntary Churn and Payment Failures
- A challenge that often gets ignored in subscription operations is involuntary churn, meaning customers leave because of payment failures, not because they actually chose to cancel.
- Chargebee notes that involuntary churn typically stems from expired cards, insufficient funds, outdated billing details, or payment processing errors, resulting in revenue leakage that can be reduced and, ideally, prevented.
- Industry benchmarks from Redux Payments and Razorpay suggest that about 20%-40% of total SaaS and subscription churn is involuntary.
- Redux Payments says B2B subscription businesses usually bring back something like 40%-50% of failed-payment subscribers.
- Meanwhile, Recurflux, drawing on Recurly data, also confirms that when you tune up payment recovery operations, churn can drop significantly.
- Recurly explains that firms with dedicated payment recovery programs can lift recovery by roughly 10-20 percentage points, moving it from around 53% into the high 60%-low 70% range.
- Recurflux adds that top-quartile SaaS teams recover 55%-70% of failed payments, but the broader industry average sits closer to 30%-45%.
- For companies that just rely on default retry systems, recovery tends to fall within the 20%-30% range.
- Finsi.ai reports AI-driven dunning platforms can recover 60%-80% of failed payments.
- Basic retry logic is far lower at about 15%-25%, while email-only recovery campaigns land around 30%-50%. When teams use multi-channel AI outreach, recovery can reach 55%-80%.
- Hybrid options, where human assistance supports the automation, tend to sit around 50%- 70% recovery. So yeah, the playbook shifts from “just try again” to more structured recuperation.
- According to Razorpay, businesses using smart retry logic plus automated dunning reduced churn from 12% to 2%. They also reported recovering more than USD 50,000 in annual recurring revenue (ARR).
- From a different angle, Recurly reports an average subscription churn rate of 5.57% across 1,500 subscription websites tracked over 19 months. That kind of dataset basically reinforces the idea that billing optimization alone can noticeably improve retention, even without extra complexity.
- The statistics point to involuntary churn as one of the top, high-return optimization chances in subscription businesses.
- With 20%-40% of churn tied to payment failures, and then 55%-70% recovery rates among the best performers, 60%-80% recovery powered by AI-driven dunning, plus clear, measurable churn drops from 12% to 2%.
Conclusion
The subscription economy continues to reshape global commerce by enabling predictable, recurring revenue, improving customer rapport, and allowing more flexible pricing models. While rapid market growth, strong consumer adoption, and broad SaaS innovation underscore the effectiveness of subscription models, companies also need to address emerging issues, such as subscription fatigue, involuntary churn, and rising customer acquisition costs.
Organizations that blend hybrid pricing, automate billing with AI, deliver more personalized customer journeys, and run proactive payment recovery efforts are repeatedly seeing better retention and more sustainable growth. And as recurring revenue becomes the backbone of digital companies, those who keep tuning customer value, pricing flexibility, and retention methods will likely lock in a long-lasting competitive edge.
FAQ
The global subscription economy market is estimated to reach USD 647.1 billion in 2026.
The average consumer manages roughly 6.7 subscriptions across both digital and physical services.
Hybrid pricing combines fixed subscription fees with usage-based charges to improve revenue flexibility.
Involuntary churn occurs when customers are lost due to payment failures, such as expired cards or insufficient funds.
AI-powered dunning and payment recovery systems can recover 60-80% of failed payments, significantly reducing revenue loss.