Introduction
Google search statistics: Google Search remains a digital giant, an almost invisible utility that underpins the modern internet economy. It is a definitive engine of commerce, a barometer of global human interest, and the single most critical touchpoint in the consumer journey. To operate in the digital world without a profound understanding of Google Search statistics is to be blind.
Indeed, this is not a general overview; this is a meticulous, data-driven analysis made to serve as the definitive benchmark for understanding the scale, market dominance, and future trajectory of Google Search. We will discuss the most current, granular, and impactful statistics available today, moving from its fundamental scale to the behaviors that change billions of daily decisions. Let’s get into it.
Editor’s Choice
- The scale of global user activity on Google Search is validated by the approximately 4 billion searches processed daily, which translates to over 5 trillion searches annually.
- Google Search maintains its near-monopoly with a global market share of 83%, meaning a failure to rank here is a failure to reach nearly 9 out of 10 potential users worldwide.
- The immense value of elite worldwide is underscored by the fact that 67% of all clicks are captured by the first five organic results, and the top-ranking position alone commands a click-through Rate (CTR) of approximately 28.5%.
- Mobile devices are the primary access point, driving roughly 58% of all Google Search traffic, and technical performance is critical, as websites loading in under 3 seconds see a 20% increase in organic traffic.
- The high commercial intent of mobile users is proven by local search data, where 46% of all searches have local intent, and 76% of users searching locally on their smartphone visit a business within 24 hours.
- For e-commerce, the platform is indispensable, with 63% of all shopping journeys originating on Google Search and organic traffic driving up to 40% of an e-commerce business’s total revenue.
- The advertising ecosystem offers a massive return, as businesses realize an average of $8 in revenue for every $1 spent on Google ads, with a third of all commercial clicks (33%) going to the top three paid ad positions.
- Content depth is a quantifiable ranking factor, with top-ranking organic pages typically possessing comprehensive content averaging around 1,890 words, aligning with the algorithm’s preference for authoritative content.
- The future is increasingly visual and AI-driven, evidenced by Google Lens processing over 8 billion visual searches monthly, and the fact that AI algorithms now influence more than 90% of all search results.
- User behaviour indicates high trust in structured data, with an estimated 25 to 30% of searches ending without any click (zero-click), forcing marketers to optimize to instant answers like featured snippets to capture direct visibility.
Google Search Volume and Scale
 (Reference: scoop.market.us)
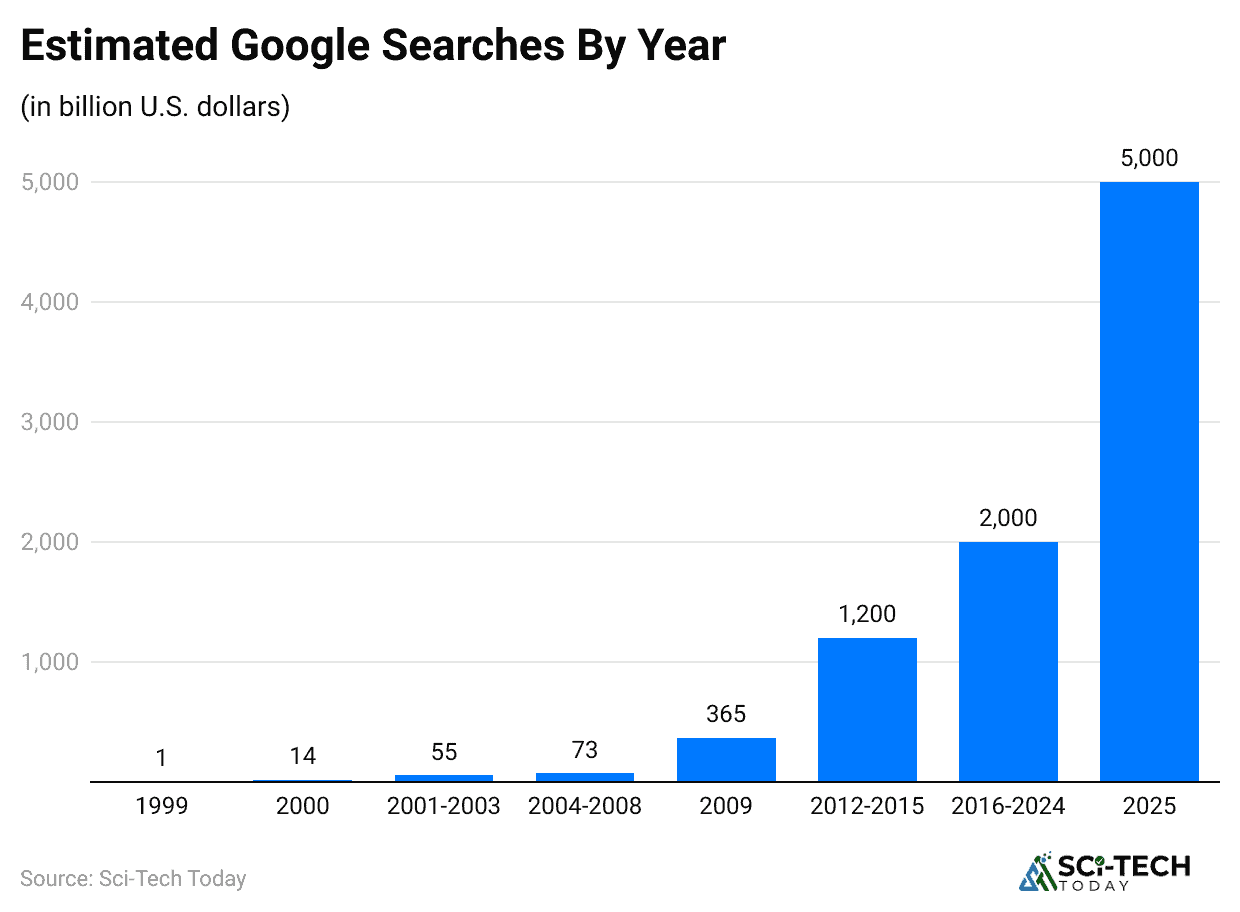
- The daily search volume on the platform is, with an estimated number of queries processed by Google Search every 24 hours between 8.5 billion and 16.4 billion, demonstrating a continued, exponential growth in global information demand.
- Annually, Google Search is estimated to handle well over 5 trillion searches, a figure that has more than doubled 2X since the company’s last public disclosure of annual search volume in 2016.
- The platform’s dominance is quantified by a global market share that consistently hovers between 85% and 90%, with recent reports placing it at roughly 89.83% worldwide, leaving its nearest competitor, Bing, with a minimal share, often less than 4%.
- In terms of raw velocity, Google Search processes approximately 189,815 search queries every single second, which translates to about 11.4 million searches per minute.
- A detail reveals that around 15% of daily searches on Google Search are entirely new, meaning they have never been entered into the system before, totaling over a billion unique queries annually.
| Core Metric | Google Search Statistic (as of Q3 2025) |
| Searches Per Day |
16.4 Billion (Estimated High) |
|
Global Market Share |
89.83% |
| Searches Per Second |
~189,800 |
|
Percentage of New Queries |
15% (Daily) |
| Annual Search Volume |
5 Trillion |
Google Search Market Share and Competitive Landscape
 (Source: seo.ai)
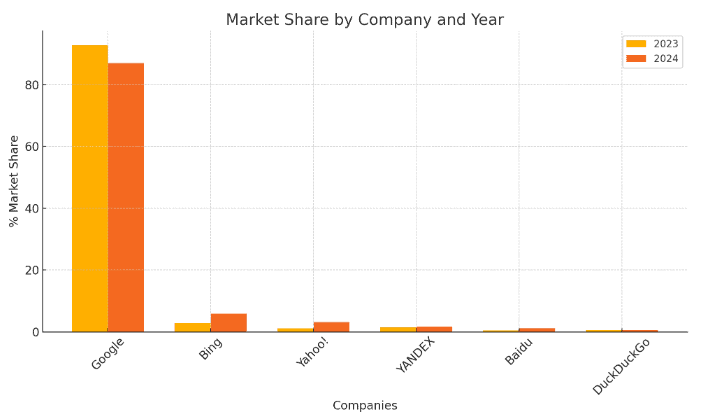
While Google Search reigns supreme, a nuanced understanding of its market share breakdown across geography and device, and the incremental gains of its competitors, provides critical context for global market penetration and strategy diversification.
- The platform’s global market dominance is not uniform across all regions, with its share rising to well over 95% in numerous countries in South America and Africa, indicating a virtual monopoly in developing digital markets.
- Despite its near-total control, recent reports show a subtle yet significant decline in Google Search’s global share, dropping from a high of over 92% a few years ago to the high 80% range (89.57%) as of mid-2025.
- The primary rival, Microsoft’s Bing, has seen incremental yet steady gains, with its global share rising to around 4% or higher, fueled significantly by its integration with generative AI technology via Copilot, making it a viable consideration for paid search budgets.
- The global mobile search market is even more heavily skewed towards Google Search, where its share often exceeds 95%, cementing its status as the default gateway to the mobile internet, especially through the Android operating system and pre-installed apps.
- In contrast to the Western world, countries like Russia and South Korea demonstrate significantly lower market share for Google Search, with local champions like Yandex and Naver dominating those specific national markets, with Google’s share dropping to as low as 20% in Russia.
| Market Share Metric | Google Search Statistic (Q3 2025) |
| Overall Global Share | 89.83% (Slightly Decreasing) |
| Mobile Search Share | 95% |
| Bing’s Global Share | 4 to 6% (Growing) |
| Organic Traffic Domination | 93.05% of all organic traffic (2025 est.) |
| Regional Variance (Example) | 20% in Russia (Yandex Dominant) |
Voice Search Market Summary
 (Source: market.us)
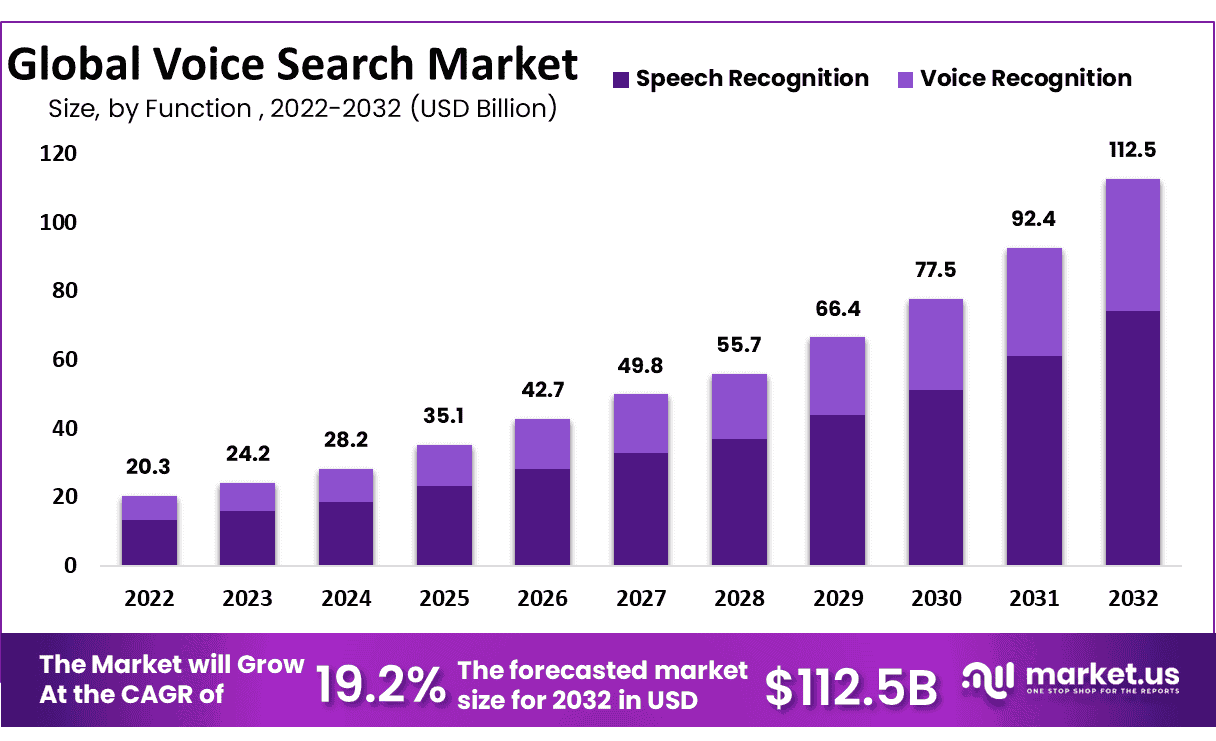
- According to a market.us report, the voice search market is projected to skyrocket from $24.2 billion in 2023 to $112.5 billion by 2032.
- Compound Annual Growth Rate (CAGR): This represents a strong growth rate of 19.2% over the forecast period (2023 to 2032).
- Main Growth Driver: The primary force behind this expansion is the increasing adoption of voice-enabled devices like Amazon Echo and Google Home.
- Largest Component Segment: The Speech Recognition segment holds the majority of the market share at 66%, largely due to its integration in smartphones and smart automobiles.
- Leading Deployment Method: Cloud Deployment is the leading segment with a 59% share, driven by the widespread adoption of cloud technology across various industries.
- Dominant Technology: Non-AI-based technology accounts for a 73% market share, attributed to its established presence and accessibility.
- Most Lucrative Industry: The Healthcare Sector is the most profitable industry vertical, bringing in a 29% revenue share, driven by its use in collecting data for Electronic Health Records (EHRs).
- Leading Region: North America commands the global market with a 33% share and is expected to exhibit a high CAGR, fueled by the rising adoption of voice search on devices like smartphones, smart TVs, and home appliances.
| Category | Segment | Key Statistic |
| Market Value (2023 to 2032) | Total Market Growth | $24.2 Billion (2023) to $112.5 Billion (2032) |
| CAGR | Growth Rate | 19.2% (2023 to 2032) |
| Component | Speech Recognition | 66% Global Market Share |
| Deployment | Cloud Deployment | 59% Market Share |
| Technology | Non-AI-Based Technology | 73% Market Share |
| Industry Vertical | Healthcare Sector | 29% Revenue Share |
| Region | North America | 33% Global Share |
Google Search User Behavior and Click-Through Rate (CTR)
 (Source: agencyanalytics.com)
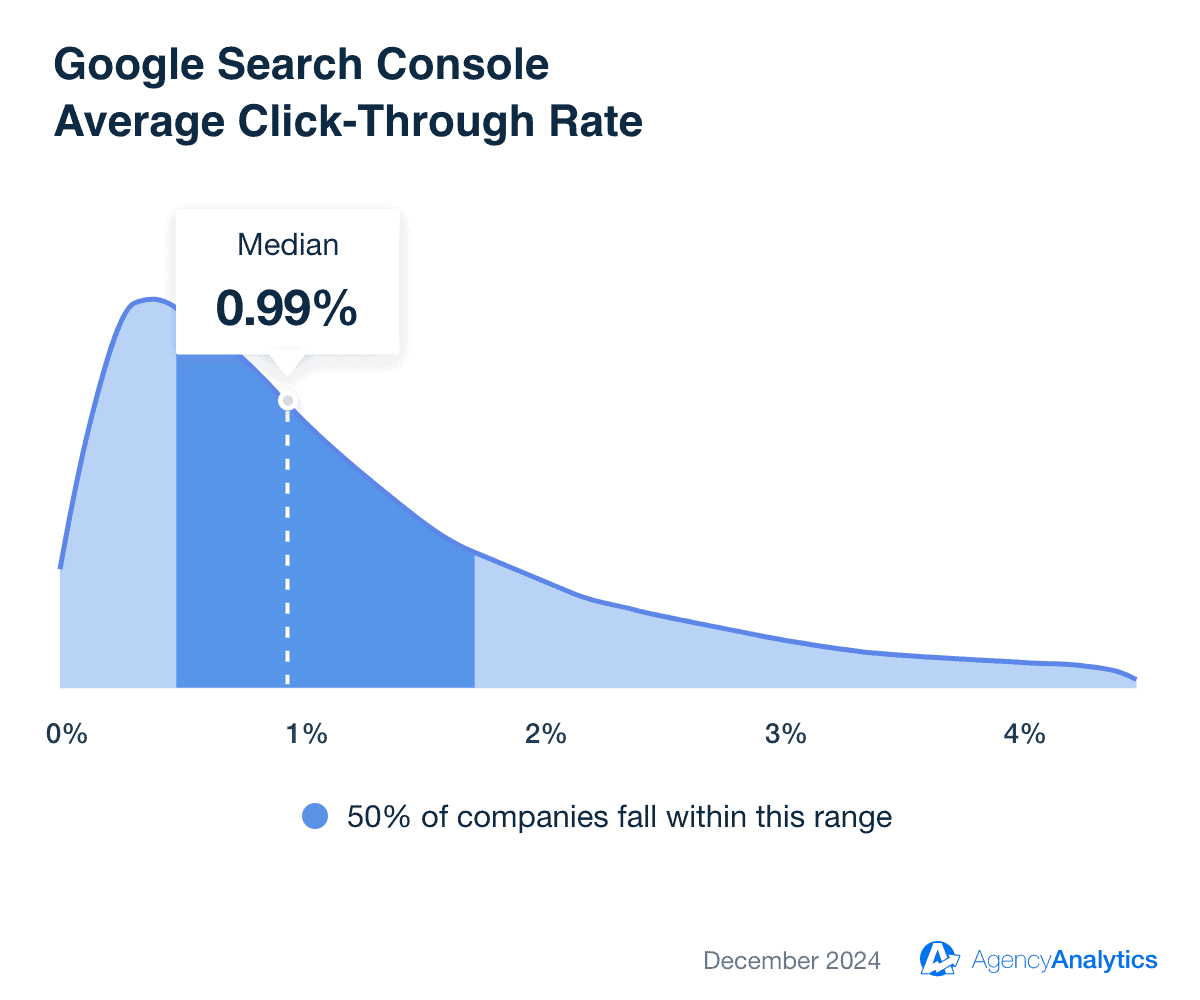
- The vast majority of user engagement is concentrated at the very top of the search results, with an estimated 67% of all clicks being captured by the first five organic results, making the distinction between a top-five position and a lower-ranked position a difference of night and day for traffic volume.
- A staggering 75% of users admit to never scrolling past the first page of search results, effectively making all content ranked on the second page or beyond digitally invisible to the vast majority of the searching public.
- The average Click-Through Rate (CTR) for the number one organic position on a Google Search results page is an estimated 28.5%, a number that dramatically falls to around 13% for the second position and continues to decline sharply for every rank thereafter.
- Up to 25 to 30% of desktop Google Search queries and 17% of mobile queries end without the user clicking on any result at all, a phenomenon known as “zero-click searches,” which is primarily driven by the platform providing instant answers through features like Featured Snippets and Knowledge Panels.
- Searches that include a local intent, such as “near me” or “best [service] open now,” are particularly valuable, with around 46% of all Google Search queries having a local component, leading to an immediate local map pack result.
| User Behavior Metric | Google Search Statistics (Analytical Data) |
| Clicks on Top 5 Results | 67% (Concentration of Traffic) |
| First Page Adherence | 75% of users never scroll past page one. |
| CTR of Rank 1 | 28.5% |
| Zero-Click Search Rate | 25 to 30% (Desktop) |
| Local Search Intent | 46% of all searches are local-focused. |
Mobile Google Search Dominance
 (Reference: demandsage.com)
- Mobile devices account for an estimated 58% of all Google Search traffic globally, firmly establishing the smartphone as the dominant tool for finding information, browsing, and initiating both local and global transactions.
- Google Search’s commitment to the mobile experience is evidenced by its implementation of mobile-first indexing, which is now applied to over 90% of the websites globally, meaning the platform now uses the mobile version of a site for all indexing and ranking decisions.
- The speed of a mobile site directly correlates with its traffic performance, as research shows that websites that load in under 3 seconds can see up to 20% more traffic from Google Search compared to slower-loading competitors.
- A one-second delay in mobile load time can result in a 7% loss in conversions, quantifying the direct financial cost of poor mobile speed optimization.
- In a behavior that highlights the high-intent nature of mobile queries, 76% of people who conduct a local search for a business on their smartphone will visit a physical location within a day, and 28% of those searches will result in an actual purchase.
- Mobile searches for “best” products and services, indicating a strong commercial investigation intent, have increased by over 80% year-over-year in certain categories, confirming that the mobile device is the primary research tool for consumers before making a high-value purchase.
| Mobile Metric | Google Search Statistics (Data Analysis) |
| Traffic Share | 58% (Dominant Channel) |
| Indexing Standard | 90% of sites use Mobile-First Indexing. |
| Speed vs. Traffic | Sites under 3-second load time get 20% more traffic. |
| Local Action Rate | 76% of local mobile searches lead to a physical visit within 24 hours. |
| “Best” Query Growth | 80% Year-over-Year |
Google Search Advertising (Google Ads)
 (Reference: demandsage.com)
- Advertising revenue from Google Search and its related properties accounts for an overwhelming 77% of Alphabet’s (Google’s parent company) total revenue, generating hundreds of billions of dollars annually, confirming its role as the undisputed cash engine of one of the world’s largest companies.
- Businesses, on average, realize a remarkable Return on Investment (ROI) by generating approximately $8 in revenue for every $1 spent on Google Ads, making the platform one of the most efficient digital marketing channels for driving direct sales and lead generation.
- The average Cost-Per-Click (CPC) across all industries for Google Search ads hovers around $2.69, though this figure can vary wildly, with highly competitive B2B and legal keywords often commanding CPCs of $50 or more, while e-commerce remains more affordable.
- Despite user preference for organic results, the top three paid advertisements on a Google Search results page capture approximately 33% of the total clicks for commercial queries, proving that premium ad placement can successfully compete with and often outperform lower-ranked organic results.
- A significant 80% of global Pay-Per-Click (PPC) budgets are allocated to Google Ads, reinforcing the global confidence in the platform’s targeting accuracy, scale, and proven conversion power compared to other paid advertising channels.
| Advertising Metric | Google Search Statistic (Financial Data) |
| Revenue Contribution | Accounts for 77% of Alphabet’s total revenue. |
| Average ROI | $8 is generated for every $1 spent on Google Ads. |
| Top Ad Click Share | Top 3 paid ads capture 33% of total search clicks. |
| Average CPC | $2.69 (Industry-variable) |
| PPC Budget Allocation | 80% of all global PPC budgets are spent on Google Ads. |
Google Search Engine Optimization (SEO)
 (Source: ashokcharan.com)
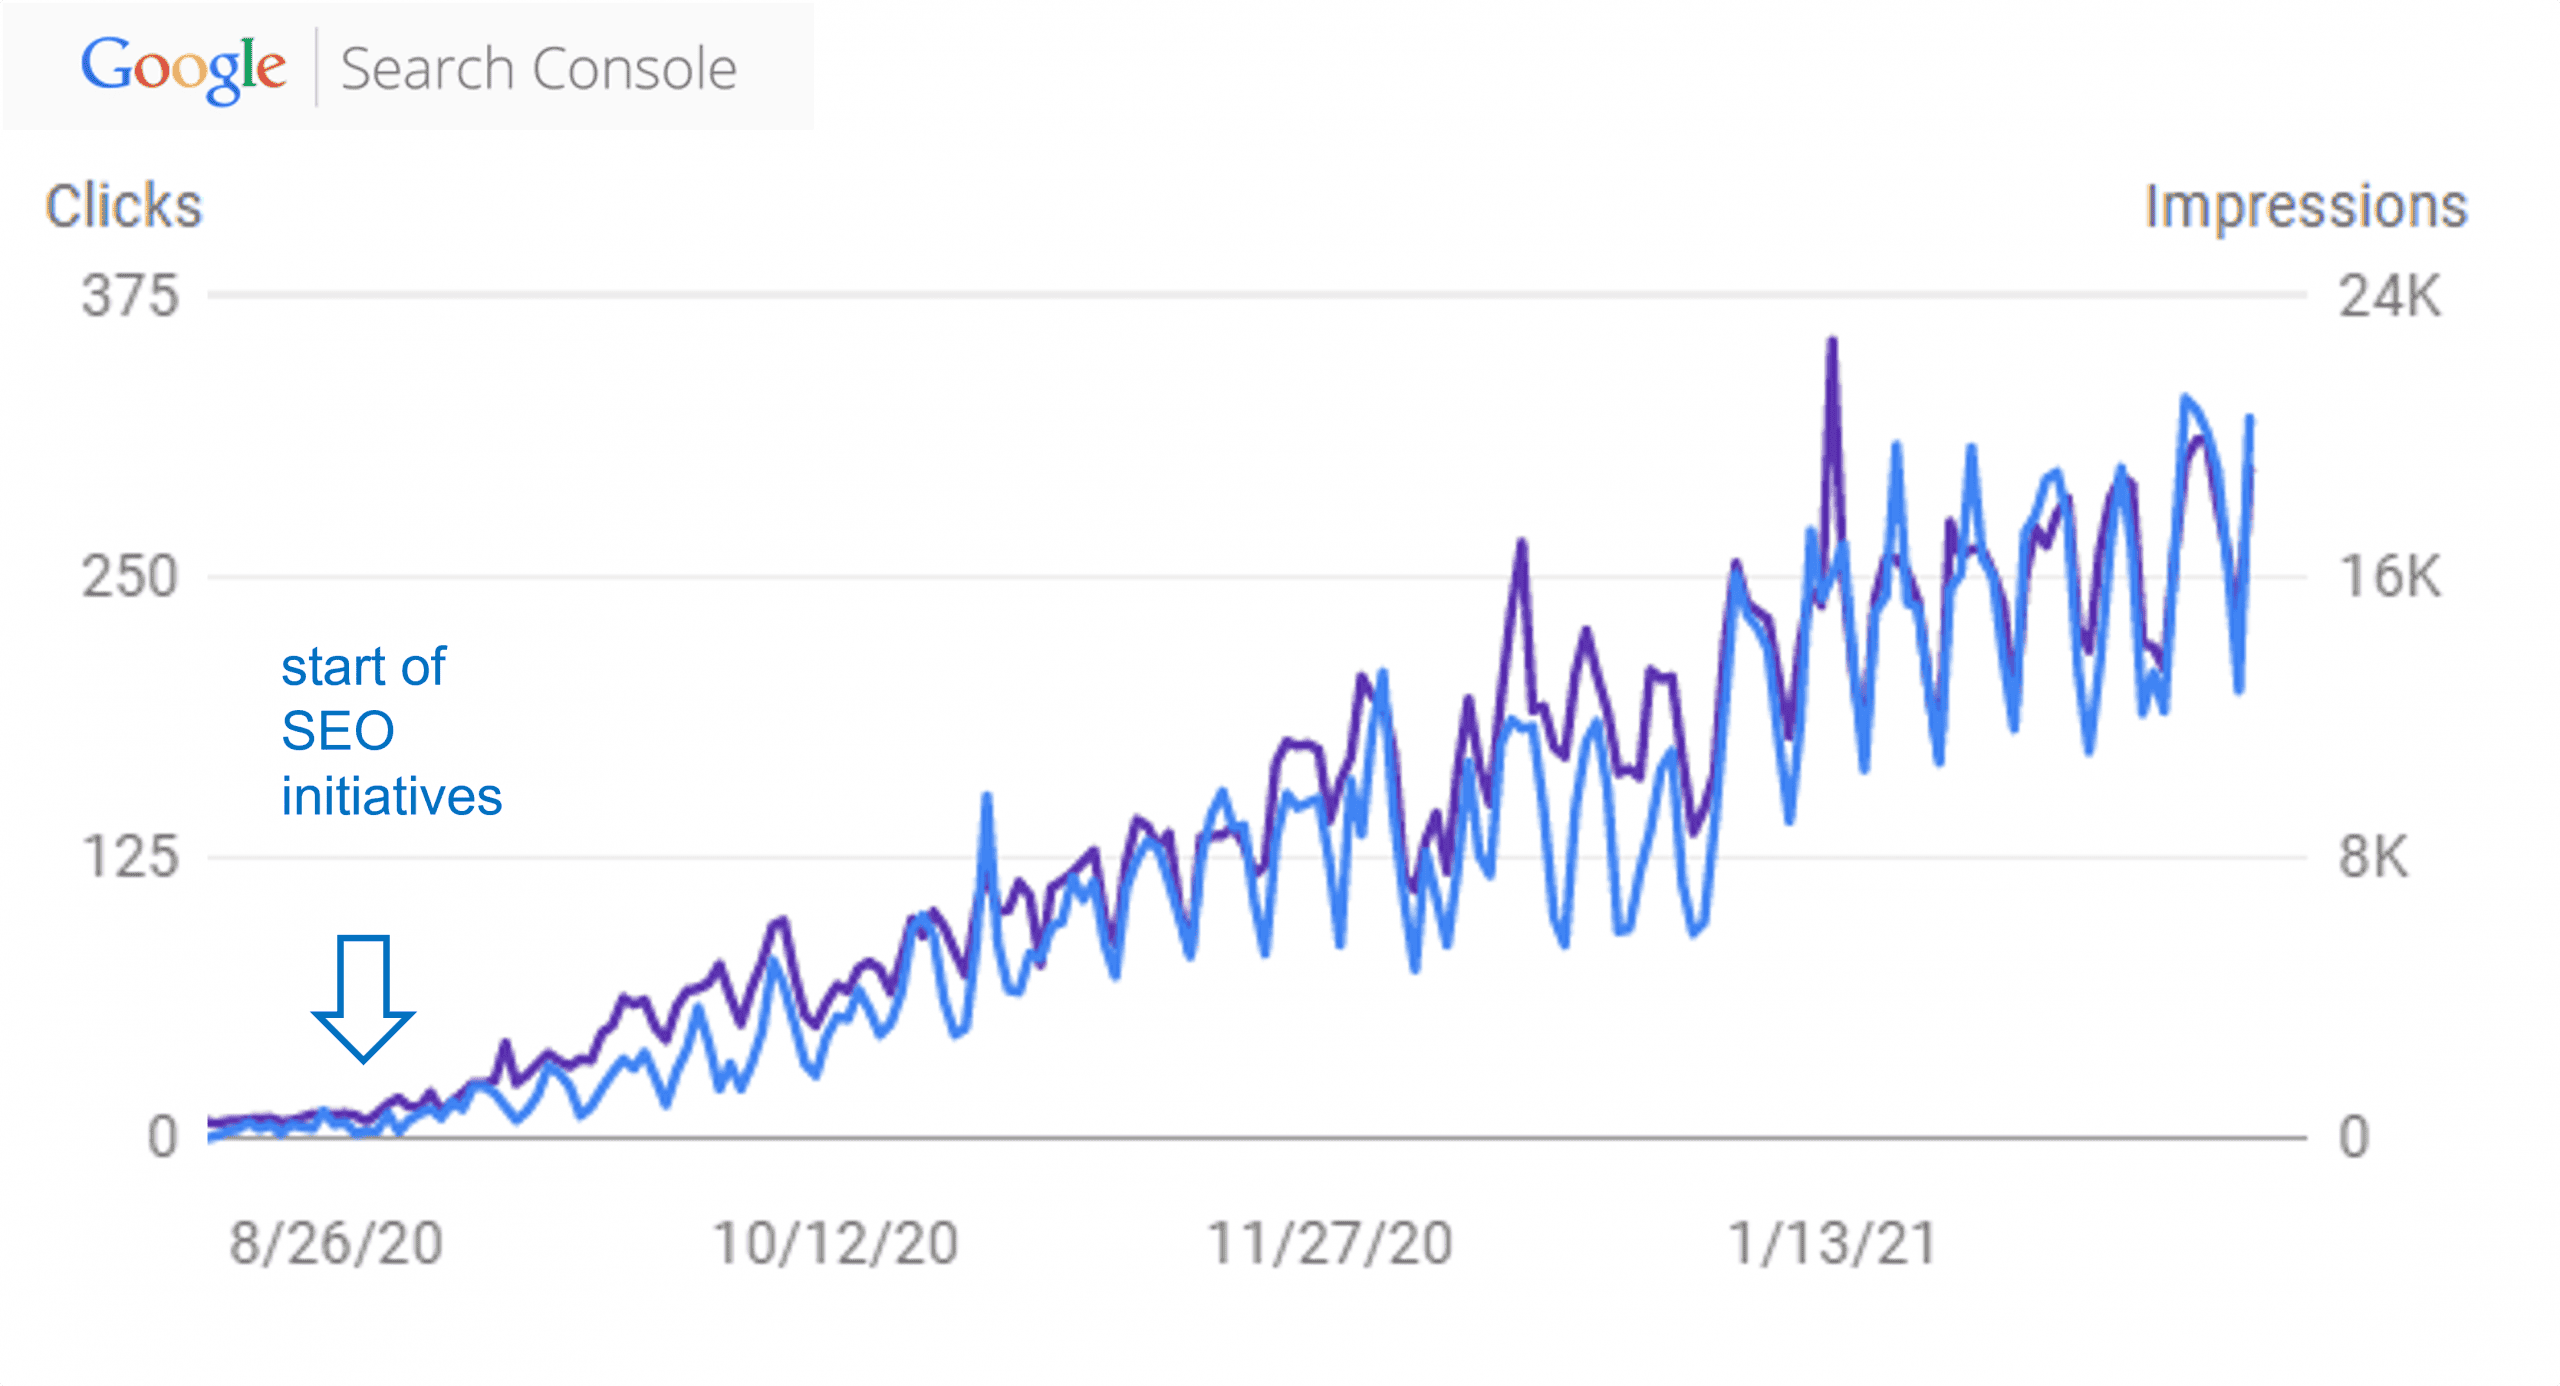
- A high percentage of web experiences, precisely 93%, commence with a search engine, and given Google Search’s dominance, this figure confirms that organic search is the most critical starting point for online customer acquisition and brand discovery.
- The length of content on pages that rank on the first page of Google Search is typically substantial, with studies suggesting an average of around 1,890 words for top-ranking articles.
- Content that ranks in the top five positions is statistically more likely to come from an authoritative domain, as a strong domain rating (a measure of link authority) is a key correlating factor for success in high-competition Google Search results.
- The average website session duration, or time a user spends on a site after clicking a Google Search result, is approximately 2 minutes and 17 seconds, and the average has a high bounce rate.
- Despite the common focus on informational searches, a significant 51% of all web traffic originates from organic search, and for many e-commerce businesses, organic traffic is responsible for driving as much as 40% of their total revenue.
| SEO Metric | Google Search Statistic (Performance Data) |
| Online Experience Start | 93% of all web experiences begin with search. |
| Traffic to Revenue | 51% of web traffic is organic; 40% of e-commerce revenue is organic-driven. |
| Top Rank Content Length | The average top-ranking page has 1,890 words. |
| Average Session Duration | 2 minutes, 17 seconds |
| User Scroll Behavior | 75% of users never scroll past the first page. |
Google Search Trends and Consumer Behavior
 (Source: thinkwithgoogle.com)
- A substantial portion of modern search behavior is geared towards visual content, with predictions suggesting that as many as 70% of search queries will incorporate a visual component by the year 2025.
- The interest in emerging technologies, particularly Artificial Intelligence (AI), has exploded, with Google Search interest for the term “AI” and related queries growing by an astonishing 240% YoY.
- Consumer search behavior is heavily influenced by the purchasing stage, with a study showing that 57% of Millennials use Google Search to conduct extensive brand research before committing to any significant purchase.
- A significant portion of younger users, specifically 40% of Gen Z, are beginning to use social platforms like TikTok and Instagram as alternative search tools for product discovery and reviews.
- Google Search queries related to environmental and social responsibility, such as “sustainability” and “eco-friendly products,” have seen an 80% increase over the past year.
| Trend & Behavior Metric | Google Search Statistic (User Intent Data) |
| Visual Search Prediction | 70% of queries will include a visual component by 2025. |
| AI Query Growth | 240% growth in AI-related search interest. |
| Gen Z Search Shift | 40% of Gen Z use social media as a primary search tool. |
| Brand Research | 57% of Millennials use the platform for pre-purchase brand validation. |
| Ethical Search Growth | 80% increase in sustainability-related queries. |
Google Search and E-Commerce
 (Reference: aaravinfotech.com)
- The majority of online shopping journeys, approximately 63%, commence directly on Google Search, either through organic results or Google Shopping ads, effectively making the platform the virtual storefront for almost two-thirds of all e-commerce transactions.
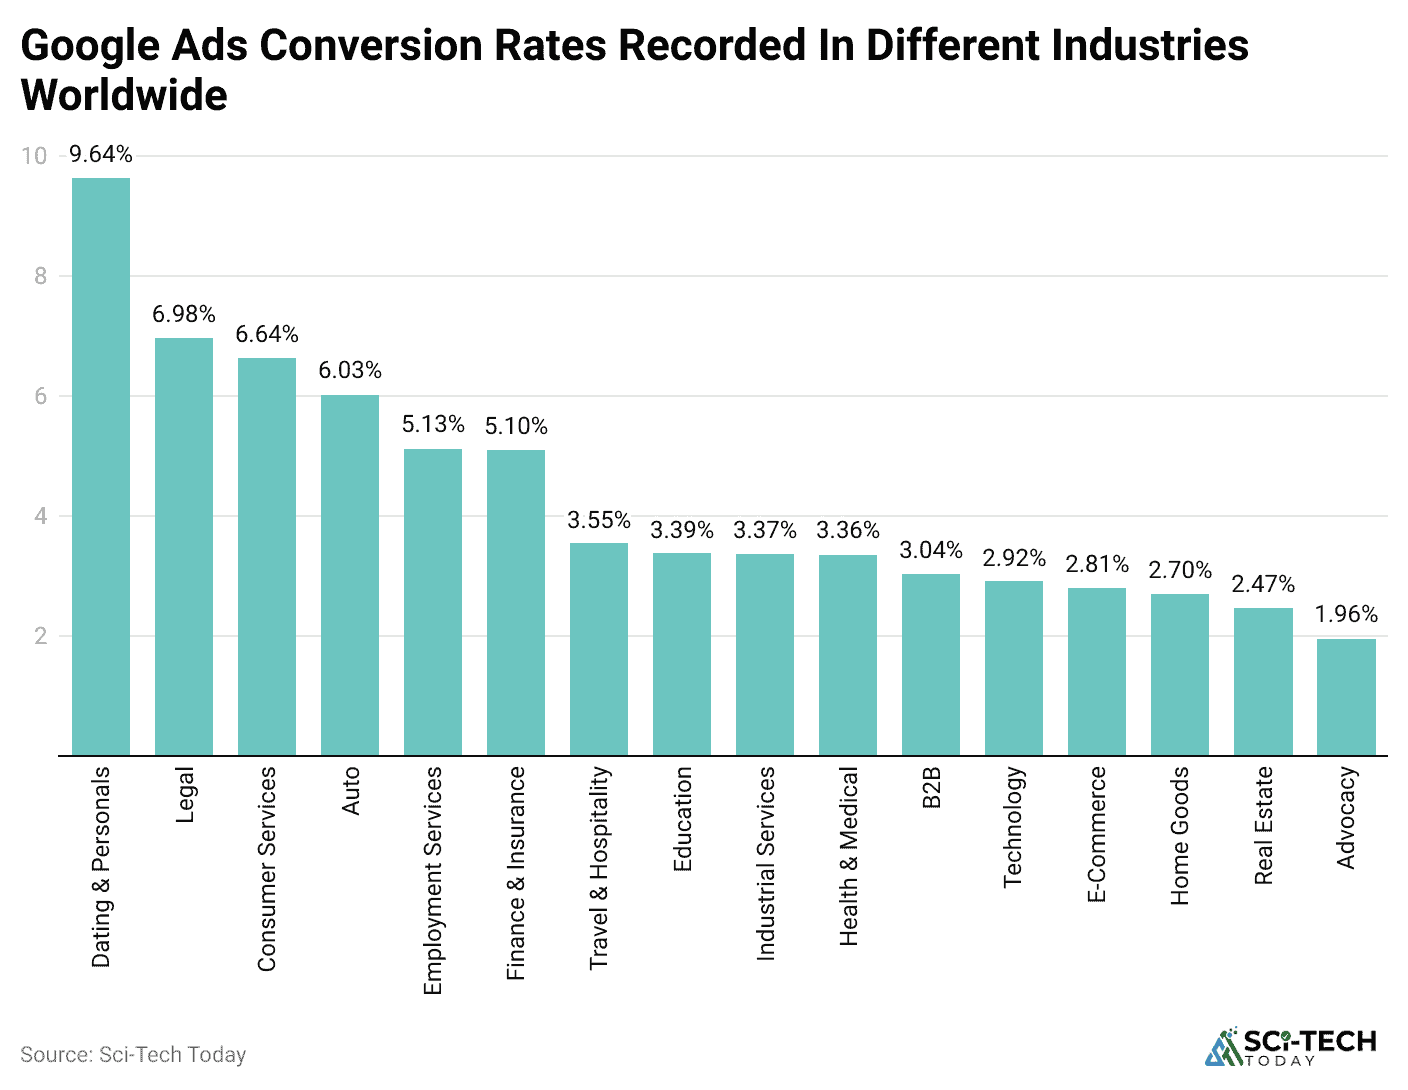
- Google Shopping ads are proving to be remarkably effective, with the average conversion rate for these visual, high-intent advertisements standing at an estimated 1.91%, which is highly competitive and often exceeds the conversion rate of standard text-based search ads.
- A significant portion of purchasing decisions is heavily influenced by customer validation, with 52% of online buyers reporting that they will actively read Google reviews before finalizing a purchase.
- During the critical holiday shopping season, Google Search is estimated to account for as much as 35% of all holiday sales, highlighting its immense influence during periods of peak commercial activity and high consumer spending.
- For the overall e-commerce space, 80% of all traffic is driven by organic search, reinforcing the principle that long-term e-commerce success is fundamentally reliant on a sophisticated and well-executed SEO strategy rather than a continuous, non-sustainable reliance on paid advertising alone.
| E-Commerce Metric | Google Search Statistic (Sales and Conversion Data) |
| Shopping Journey Start | 63% of all shopping trips begin on the platform. |
| Organic Traffic Value | 80% of all e-commerce traffic is organic-driven. |
| Shopping Ad Conversion Rate | Average conversion rate of 1.91% for Google Shopping Ads. |
| Review Influence | 52% of online buyers read Google reviews before purchasing. |
| Seasonal Sales Impact | Originates 35% of all holiday sales. |
Future Trajectories in Google Search
 (Source: bloggerspassion.com)
- The integration of new, large language models and other AI algorithms like BERT and MUM now influences over 90% of all Google Search results.
- Search personalization is projected to see a dramatic increase, with predictions suggesting that AI-driven search will increase the individual tailoring of results by as much as 50% by 2025.
- The usage of visual search technologies like Google Lens continues to soar, with the tool now processing over 8 billion visual searches monthly.
- Video content is becoming an increasingly important indexable asset, with Google Search predicting that the indexing of video content will increase by 20% annually, pushing video to the forefront of organic visibility across many high-volume queries.
- The expansion of AI-driven features, such as Google’s AI Overviews, is projected to drive 30% higher engagement rates in personalized search results by 2025, even as it risks reducing traditional clicks to publishers.
| Future Trend Metric | Google Search Statistic (Projection and AI Impact) |
| AI Algorithm Influence | BERT/MUM influences 90% of all search results. |
| Personalization Increase | 50% increase in personalized results by 2025. |
| Google Lens Usage | Processes 8 billion visual searches monthly. |
| Video Indexing Growth | Projected 20% annual increase in video indexing. |
| AI Overview Engagement | Expected to drive 30% higher engagement in tailored search results. |
Conclusion
Overall, these statistics are clear: Google Search is not merely a player in the digital landscape; it is the infrastructure upon which the digital world is built. From processing trillions of queries annually to dominating over 95% of the mobile search landscape and directing the vast majority of e-commerce revenue, its influence is absolute.
For any organization, the journey to success must be built on the bedrock of these numbers. They prove that investing in high-quality, long-form content (averaging 1,890 words), achieving mobile speed (under 3 seconds), and competing for the elite top-five ranks (67% of clicks) are non-negotiable requirements. I hope you like this article. Thanks for staying up till the end.
