






Starter
Apple TV Statistics: Apple TV+ is a streaming service from Apple that subscribers in the US and other countries can access. It started on November 1, 2019. The platform primarily offers movies and TV shows created by Apple, known as Apple Originals. Apple introduced the service during a big event in March 2019. At that event, stars like Jennifer Aniston, Oprah Winfrey, and Steven Spielberg joined Apple onstage to talk about their shows.
You can watch Apple TV+ on Apple’s website or by using the Apple TV app. This app is now available on most Apple products, and it also works on some smart TVs, gaming systems, and streaming devices from other brands. Apple TV+ now has over 47 million paying subscribers. We will look closer at Apple TV Statistics in this article.
Editor’s Must-Read
- Apple TV+ presently holds 10% of the subscription video-on-demand (SVOD) market in the US.
- With Apple TV+, you can also stream the content on up to six devices at the same time per subscription.
- Approximately 45% of Apple TV viewers are 30 to 50 years old.
- ARS Technica reported, based on Apple TV Statistics, that 60% of Apple TV users are female, whereas 40% are male.
- In Q1 2025, Apple TV is expected to attract nearly 44.1 million viewers, representing a 4.75% increase from the previous year.
- Apple TV boasts almost 25 million subscribers, with an additional 50 million promotional access.
- In all, almost 26% of US video-on-demand users use Apple TV+.
- Overall, 20% of video-on-demand users in the United States say they are likely to use Apple TV+ again.
- In April 2025. Almost 29% of US video-on-demand users were informed about Apple TV+ in the media, on social media, or in an ad in the past 4 weeks.
Apple TV 4K Specifications
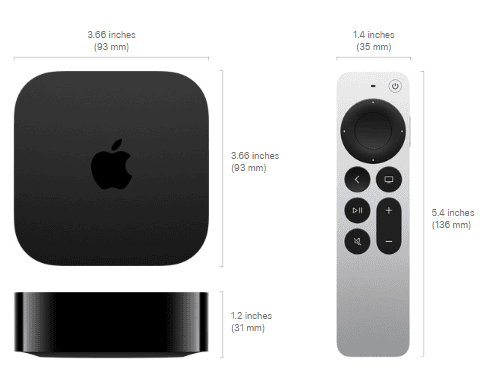
(Source: apple.com)
| Specifications | Apple TV | Remote |
|
Height | 1.2 inches (31mm) | 5.4 inches (136mm) |
| Width | 3.66 inches (93mm) |
1.4 inches (35 mm) |
|
Depth | 3.66 inches (93 mm) | 0.36 inch (9.25 mm) |
| Weight (Wi-Fi model) | 7.3 ounces (208g) |
2.3 ounces (66g) |
|
Weight (Wi-Fi Ethernet Model) | 7.5 ounces (214g) | – |
| Capacity | 64 GB (Wi-Fi model) |
128 GB (Wi-Fi+ Ethernet model) |
Daily Performances of Apple TV
| Date | Subscribers | Views | Estimated Earnings |
|
2025-06-12 | 2.06M | 1,547,023,291+226,011 | USD353.71 – USD1,061.12 |
| 2025-06-11 | 2.06M | 1,546,797,280+535,862 |
USD838.62 – USD2,515.87 |
|
2025-06-10 | 2.06M+10K | 1,546,261,418+793,710 | USD1,242.16 – USD3,726.47 |
| 2025-06-09 | 2.05M | 1,545,467,708+857,896 |
USD1,342.61 – USD4,027.82 |
|
2025-06-08 | 2.05M | 1,544,609,812+481,047 | USD752.84 – USD2,258.52 |
| 2025-06-07 | 2.05M | 1,544,128,765+327,402 |
USD512.38 – USD1,537.15 |
|
2025-06-06 | 2.05M | 1,543,801,363+498,444 | USD780.06 – USD2,340.19 |
| 2025-06-05 | 2.05M | 1,543,302,919+443,170 |
USD693.56 – USD2,080.68 |
|
2025-06-04 | 2.05M | 1,542,859,749+461,342 | USD722 – USD2,166 |
| 2025-06-03 | 2.05M | 1,542,398,407+444,693 |
USD695.94 – USD2,087.83 |
|
2025-06-02 | 2.05M | 1,541,953,714+514,639 | USD805.41 – USD2,416.23 |
| 2025-06-01 | 2.05M | 1,541,439,075+519,808 |
USD813.5 – USD2,440.5 |
|
2025-05-31 | 2.05M | 1,540,919,267+1,878,912 | USD2,940.5 – USD8,821.49 |
| 2025-05-30 | 2.05M | 1,539,040,355+2,274,092 |
USD3,558.95 – USD10,676.86 |
|
2025-05-29 | 2.05M+10K | 1,536,766,263+1,671,646 | USD2,616.13 – USD7,848.38 |
| 2025-05-28 | 2.04M | 1,535,094,617+488,543 |
USD764.57 – USD2,293.71 |
|
2025-05-27 | 2.04M | 1,534,606,074+679,171 | USD1,062.9 – USD3,188.71 |
| 2025-05-26 | 2.04M | 1,533,926,903+710,683 |
USD1,112.22 – USD3,336.66 |
|
2025-05-25 | 2.04M | 1,533,216,220+1,175,426 | USD1,839.54 – USD5,518.63 |
| 2025-05-24 | 2.04M | 1,532,040,794+643,634 |
USD1,007.29 – USD3,021.86 |
|
2025-05-23 | 2.04M | 1,531,397,160+1,191,640 | USD1,864.92 – USD5,594.75 |
| 2025-05-22 | 2.04M+10K | 1,530,205,520+671,788 |
USD1,051.35 – USD3,154.04 |
|
2025-05-21 | 2.03M | 1,529,533,732+387,355 | USD606.21 – USD1,818.63 |
| 2025-05-20 | 2.03M | 1,529,146,377+320,216 |
USD501.14 – USD1,503.41 |
|
2025-05-19 | 2.03M | 1,528,826,161+455,727 | USD713.21 – USD2,139.64 |
| 2025-05-18 | 2.03M | 1,528,370,434+409,293 |
USD640.54 – USD1,921.63 |
|
2025-05-17 | 2.03M | 1,527,961,141+493,978 | USD773.08 – USD2,319.23 |
| 2025-05-16 | 2.03M | 1,527,467,163+411,470 |
USD643.95 – USD1,931.85 |
|
2025-05-15 | 2.03M | 1,527,055,693+434,299 | USD679.68 – USD2,039.03 |
| 2025-05-14 | 2.03M | 1,526,621,394+423,820 |
USD663.28 – USD1,989.83 |
Apple TV Popular Content Statistics
- Top Movies on Apple TV in 2025
| 1 | F1 | 845 |
| 2 | The Gorge | 727 |
| 3 | Fountain Of Youth | 428 |
| 4 | The Family Plan | 397 |
| 5 | Greyhound | 376 |
| 6 | The Family Plan 2 | 370 |
| 7 | Luck | 262 |
| 8 | Napolean | 230 |
| 9 | Wolfs | 216 |
| 10 | Outcome | 205 |
- Top TV Shows as of July 2026
| Sr. No | Shows | Points per day |
| 1 | Silo | 1,014 |
| 2 | Cape Fear | 813 |
| 3 | Trying | 578 |
| 4 | Widow’s Bay | 514 |
| 5 | Your Friends & Neighbors | 508 |
| 6 | Ted Lasso | 462 |
| 7 | Sugar | 407 |
| 8 | Severance | 182 |
| 9 | Margo’s Got Money Troubles | 165 |
| 10 | For All Mankind | 160 |
- By March 2024, Apple TV+ has 271 films and television programs for users to watch in the US alone. This is an almost 100-title increase from what was there in April 2023.
- The available titles have increased dramatically over the last month in some of the key international markets of Apple TV+, such as Brazil, Germany, Mexico, the UK, and the US.
- Here’s a breakdown of how many movies and shows are offered in each of these top countries:
| Month-Year | Brazil | Germany | Mexico | United Kingdom | United States |
| Apr 2023 | 171 | 162 | 163 | 163 |
175 |
|
May 2023 | 179 | 167 | 170 | 172 | 186 |
| Jun 2023 | 183 | 168 | 172 | 174 |
189 |
|
Jul 2023 | 179 | 168 | 172 | 167 | 191 |
| Aug 2023 | 182 | 172 | 176 | 170 |
190 |
|
Sep 2023 | 185 | 176 | 176 | 176 | 192 |
| Oct 2023 | 188 | 181 | 184 | 174 |
193 |
|
Nov 2023 | 195 | 187 | 190 | 192 |
205 |
|
Dec 2023 | 200 | 187 | 187 | 195 | 204 |
| Jan 2024 | 202 | 191 | 190 | 198 |
208 |
|
Feb 2024 | 210 | 196 | 192 | 205 | 216 |
| Mar 2024 | 212 | 217 | 194 | 203 |
271 |
Apple TV Active Devices in the US
- Apple was inactive in the smart TV industry, with Roku and Amazon leading in units sold.
- Apple has added more active devices each year in the United States, but it is still behind Roku, with around 50 million units.
| Year | Devices(mm) |
|
2024 | 33 |
| 2023 |
32.3 |
|
2022 | 31.7 |
| 2021 |
29.9 |
|
2020 | 28.3 |
| 2019 |
25.9 |
|
2018 | 24.6 |
| 2017 |
22.4 |
|
2016 | 20.1 |
| 2015 |
17.3 |
Apple TV Subscribers Statistics
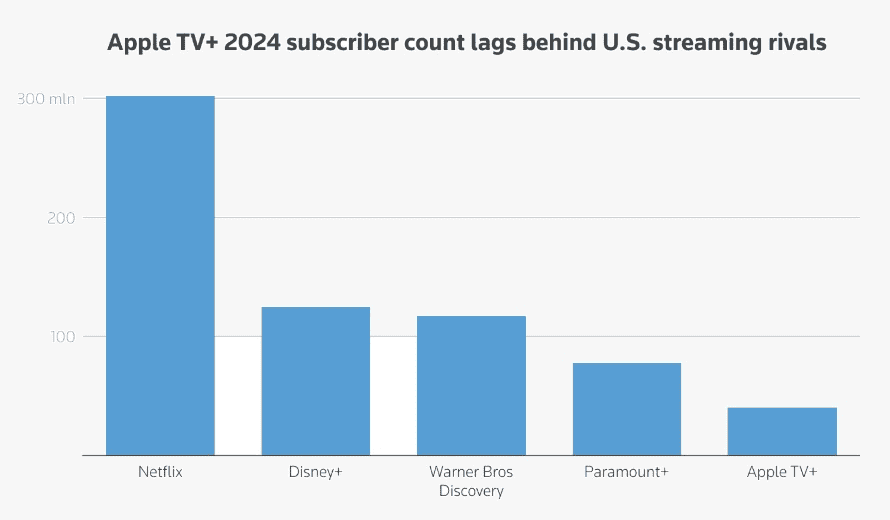
- Apple has invested USD 20 billion in Apple TV+, which is a significant gamble in an industry where Netflix, Disney, and Amazon are all competing for viewers.
(Source: typepad.com)
- Following is a table showing Apple TV+ subscribers 2019 to 2024(mm)
| Year | Subscriber(mm) |
|
2024 | 30 |
| 2023 |
40 |
|
2022 | 55 |
| 2021 |
48 |
|
2020 | 33.6 |
| 2019 |
5.7 |
Apple TV Limited Viewership Statistics
- According to Nielsen tracking, the streaming content viewed on TV’s Apple TV+ accounts for less than 1% of the monthly TV viewership, compared to Netflix’s 8.2% and Max’s 1.2% as of February 2025.
- As reported by The Verge using Apple TV Statistics, Apple has received flak not just due to its limited advertising but also due to its poor marketing strategy for Apple TV+.
- For instance, according to iSpot statistics, Apple mentioned that it spent USD 14.9 million on ads for Apple TV+, while it was USD 28.6 million for the iPhone, in October 2019.
Apple TV Losses Statistics
- According to The Information, a worker who reviewed Apple TV+’s business plan said the service might lose between USD 15 billion and USD 20 billion during its first 10 years.
- For comparison, Disney’s streaming services lost approximately USD 11.4 billion from the launch of Disney+ in late 2020 through April 2024.
- Disney’s streaming finally made a profit for the first time in the quarter ending June 29, 2024.
- Apple’s current financial condition remains solid. The corporation has an estimated value of USD 4 trillion and a net income of USD 93.7 billion in the previous fiscal year. Even with Apple TV+ losing nearly USD 1 billion per year, there is not much to worry about.
- Streamlining can open up many avenues for growth for Apple. Many new streamers who were failing initially have started earning money.
- Other competing apps for Apple TV+ earn extra income from advertising or from raising prices. Apple TV+ does not use advertisements and also has not raised its prices since Fall 2023.
Apple TV Global Market Share Statistics
- Apple TV controls 13% of the worldwide streaming device market.
- Roku is the top player with a 38% market share, making it the most popular streaming device globally. Amazon’s Fire TV comes next with 18%.
- The Indian Express cited Apple TV Statistics, showing that Samsung has a 12% share, and Android TV holds 5.9%.
- There are 31.7 million active Apple TV units in the US. Although Apple hasn’t focused heavily on smart TVs, the number of devices sold has been slowly increasing.
- Apple TV accounts for 13.1% of US-connected TV (CTV) users, while Roku leads with 51.7% of the market.
- About 4 million Americans use Apple TV to stream content on their TVs. Half of US households have smart TVs that connect directly to the internet. The rest use streaming gadgets.
Apple TV User Demographics Statistics
- In 2024, 60% of Apple TV viewers are female, and 40% are male.
- The largest group of users falls between the ages of 35 and 54, comprising 45% of the total audience.
- Adults aged 18 to 34 are the next largest group at 26%. People under 18 make up 12%, while those 55 and older account for 17% of users.
- There are approximately 44.1 million Apple TV users in the US as of 2024, representing a 4.8% increase from 42.1 million in 2023.
- The number of users is expected to grow to 45.9 million in 2025 and reach 47.7 million by 2026.
- Business Od Apps reported, based on Apple TV Statistics, that roughly 55% of Apple TV accounts are used by 1 to 3 people, while four or more users share the remaining 45%.
- Additionally, approximately 33% of people who have recently purchased Apple devices also report using Apple TV.
- This indicates that Apple TV is most popular among adults aged 35–54 and those in smaller households, and it’s continuing to grow in the US streaming market.
Apple TV App Store Statistics
- On average, developers release nine new apps per day or around 75 per week on the Apple TV App Store. In February 2023, 230 new apps were added, including categories such as entertainment and VPN services.
Most apps are free, but some cost money:
- There are many paid applications costing less than USD 1
- Approximately 73 applications charge between USD 9 and USD 10, including those with pay-per-use models
- Apple TV Statistics stated that Bloomberg revealed 33.3% of the applications available on the platform have been rated by users, and 41.6% of these applications have ratings from 4.5 to 5.
- As of 2024, there are 18,096 applications on the Apple TV App Store (tvOS). An application is added daily, making it 7 applications in a week or 54 per month.
Out of all the apps:
- Approximately 5,750 apps have been rated by users, which accounts for about 31.6% of the total.
- The other 68.4% (or about 12,371 apps) don’t have user reviews yet.
- Among the apps with ratings, 41.6% have high scores between 4.5 and 5 stars, indicating that users are generally satisfied with them.
- Most apps on the tvOS App Store are free to download.
For the ones that do cost money:
- Many are available at less than USD 1
- As many as 73 applications are within the price range of USD 9 – 10, and the majority of them provide a pay-per-use option.
- Within just a month of February 2023, Apple TV has brought in 230 new applications, and the trend seems to be following the same course in 2024.
- With 31.6% of applications rated by users, the scope is wide open for feedback.
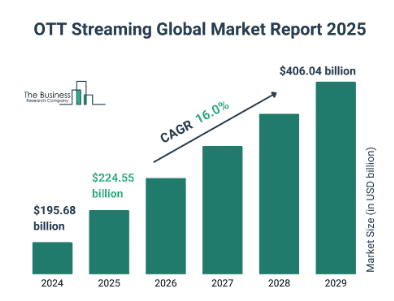
OTT Streaming and Video Quality Statistics
(Source: thebusinessresearchcompany.com)
- During the pandemic, Apple TV had an 8.5% share of OTT video watch time, ranking third behind Roku. Chromecast had 6.8%, and Android TV had 5.5%.
- Today, the competition between Apple TV and Google TV continues as both companies strive to capture a larger share of the CTV market.
- As of Q2 2023, Apple TV delivered the fastest video start time (VST) at 2.9 seconds, with only a 4.2% year-over-year drop.
- Apple TV also had the lowest buffering rate at 0.1%, tying with Roku.
- Its bitrate improved by 9.2% YoY, placing Apple TV in the top 5 for video quality.
- Average viewer engagement per session is 24.4 minutes, a 1.2% drop from the previous year. In comparison, Chromecast leads with 34.5 minutes per viewing session.
Summary
In 2025, the total number of Apple TV+ users exceeded 100 million, including approximately 50 million people who received free access through promotions, such as the 1-year free trial offered with new Apple device purchases. Even though updated figures haven’t been released, experts believe the number of paying subscribers could now be around 50 million.
This rise in Apple TV+ users is likely due to a decline in Prime Video users in the US, as well as Apple’s strong push for exclusive, high-quality shows and movies, along with targeted promotional offers. We have shed enough light on Apple TV Statistics.
FAQ
Silo is currently the #1 most popular TV show on Apple TV.
Apple does not publicly disclose exact viewership or paid subscriber numbers, but analysts and company executives estimate the platform has significantly more than 47 million global subscribers.
The most watched Apple TV+ shows of all time are led by the World War II epic Masters of the Air, the hit sci-fi thriller Severance, and the courtroom drama Presumed Innocent.

Sources