









Introduction
Employee Theft Statistics: Employee theft is a growing problem that affects businesses of every size. It includes stealing cash, products, office supplies, company data, or even time during work hours. While one incident may seem small, repeated theft can lead to major financial losses, lower employee morale, and reduced trust in the workplace. As businesses adopt digital tools and remote work, the risk of internal theft continues to grow. Companies are now using better security systems, regular audits, and employee training to prevent losses.
In this article, you’ll discover the latest employee theft statistics, key trends, common causes, and practical ways businesses can reduce workplace theft and protect their assets.
Top Pick
- Organizations lose an average of 5% of annual revenue to occupational fraud.
- Financial statement fraud accounts for only 5% of cases but causes the highest median loss at USD 766,000.
- 43% of fraud cases are uncovered through tips, with 52% of those tips coming from employees.
- 84% of fraudsters exhibit at least one behavioral red flag before detection.
- 25% of employees admit stealing from their employer, while 60% of small businesses have experienced employee theft.
- Time theft costs U.S. employers USD 450–550 billion annually.
- Around 43% of hourly employees admit exaggerating their working hours.
- 37% of remote employees admit overstating hours on timesheets, while only 28% of organizations use automated time tracking.
- Insider-related data breaches cost organizations an average of USD 10.5 million, with employees linked to 60% of data breaches.
- Employee training can reduce theft by 50%, while segregation of duties prevents 70% of fraud.
Key Employee Theft Statistics in 2026
- According to a report published by Chanty, organizations lose around 5% of their annual revenue to occupational fraud on average.
- The median loss per employee theft case is about USD 145,000, while most schemes remain hidden for 12 months before detection.
- Asset misappropriation, including cash, inventory, and property theft, accounts for 89% of fraud cases, with a median loss of USD 120,000.
- Although only 5% of cases involve financial statement fraud, the median loss reaches USD 766,000.
- The median loss is approximately USD 500,000 when owners or executives commit fraud, USD 184,000 for managers, and USD 60,000 for rank-and-file employees.
- About 84% of fraudsters display at least one behavioral warning sign before being caught.
- Tips uncover 43% of fraud cases, making them 3x more effective than any other detection method, while 52% of tips come from employees.
- Fewer than 30% of cases result in criminal charges, and 86% of offenders historically receive no punishment. Employee theft contributes 29%-43% of retail inventory shrinkage.
Types of Employee Theft
(Source: market.biz)
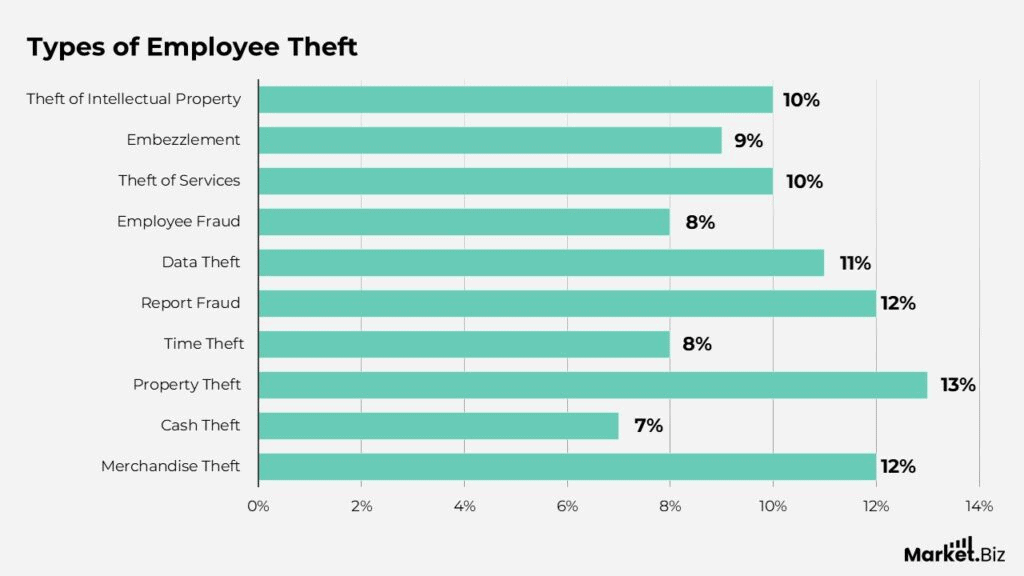
- Theft of intellectual property and theft of services each account for 10% of reported employee theft incidents.
- Embezzlement represents 9% and employee fraud 8%.
- Data theft stands at 11%, while report fraud and merchandise theft are both at 12%.
- Time theft and property theft are recorded at 8% and 13%, respectively.
- Cash theft, at 7%, is comparatively lower, suggesting organizations may be gradually tightening controls over direct monetary handling.
Internal Theft Statistics
- According to market.biz, Employee theft remains a major challenge, with 43% of retail inventory losses linked to internal theft, according to the National Association for Shoplifting Prevention.
- Around 25% of employees admit they have stolen from their employers, although many cases are never reported.
- Managers account for 35% of internal theft cases despite holding positions of trust.
- The average loss from one employee theft incident is about USD 1,500.
- Nearly 60% of small businesses have experienced employee theft at least once.
- Financial pressure motivates 40% of employee theft cases, while 70% occur during busy periods such as holidays.
- Retail businesses account for 50% of employee theft incidents, mainly through merchandise theft.
External Theft Statistics
- Shoplifting causes 52% of retail inventory losses and contributes more than USD 13 billion in annual losses, with U.S. businesses alone losing about USD 15 billion each year.
- About 30% of employees indirectly or directly assist external theft, while 45% of retailers report a 10%-20% increase in such incidents.
- Organized retail crime is involved in 70% of external theft cases, and 50% target high-value products,
- Over 70% of retailers have strengthened security measures.
Employee Theft Incidence Statistics
- Employee theft contributes to about 30% of retail inventory shrinkage, while 42% of theft losses are linked to employees, as per Gitnux.
- Around 75% of employees admit stealing at least once, and 1 in 5 admit workplace theft.
- Employee theft affects 90% of businesses annually, while 56% of companies report theft incidents each year.
- Retail employee theft equals 1.6% of sales, and employee fraud is detected in 5% of firms annually.
- About 1 in 3 employees engage in time theft.
- Employee theft contributes to losses across industries: Hospitality (35%), Manufacturing (28%), Technology (22%), Healthcare (18%), Construction (40%), Finance (15%), Restaurants (29%), Warehousing (33%), Automotive Retail (25%), Grocery (31%), Apparel (27%), Electronics (36%), Pharmacies (20%), Hotels (32%), Small Businesses (50%), Large Corporations (10%), Startups (45%), Non-profits (25%), Government (12%), Education (19%), and Transportation (26%).
Employee Theft Termination By Position
(Reference: zippia.com)
- Reasons for stealing from an employer can be difficult to ascertain, especially if the offender remains mum about it. Nonetheless, we know the consequences of such crimes and how organizations tend to react when theft or fraud is detected.
- About 80% of wrongdoers are punished to various degrees.
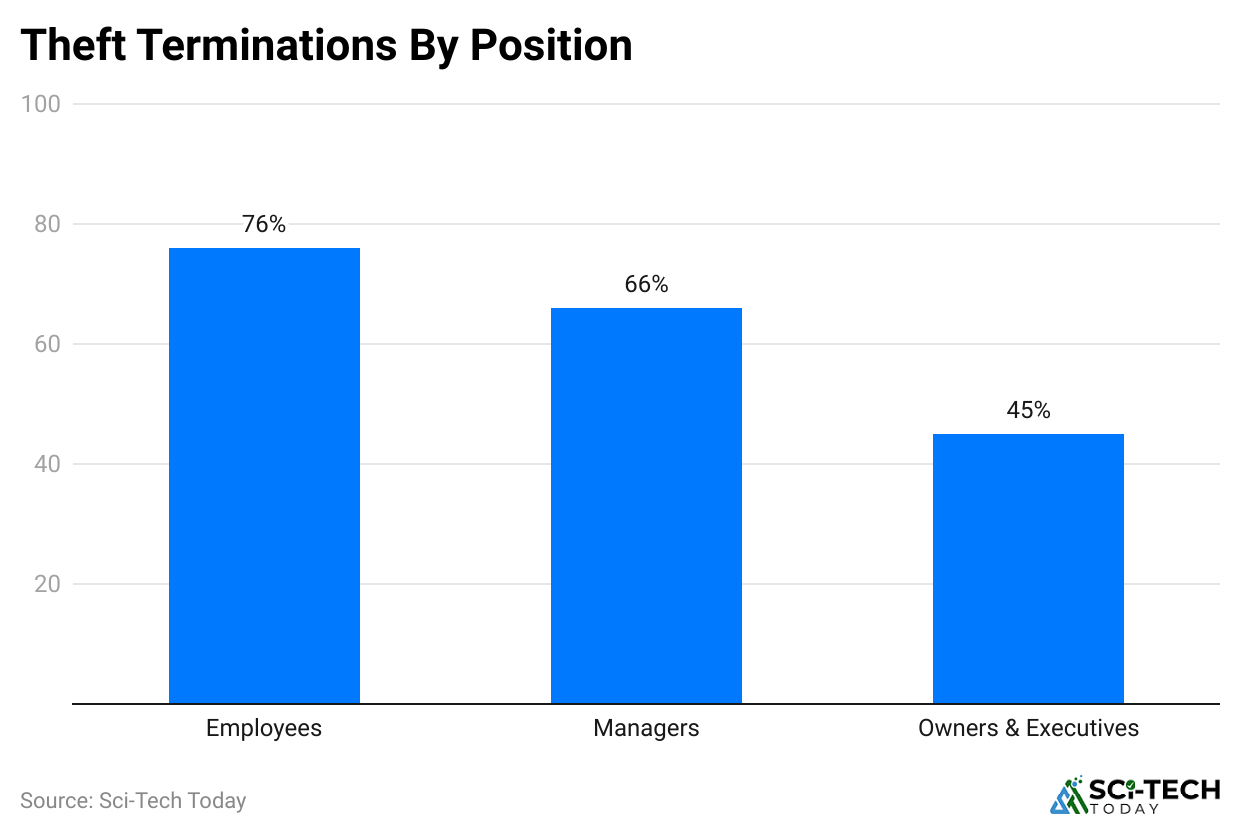
- Only 45% of proprietors and executives are sacked, as opposed to 66% of supervisors and 76% of the workforce.
Median Amount Lost by Theft
(Reference: zippia.com)
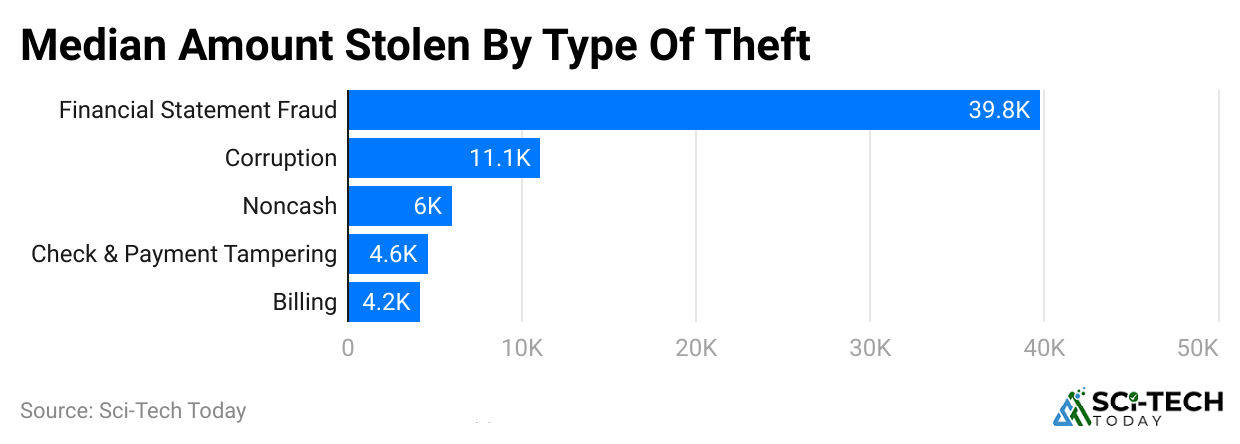
- About employee theft statistics, financial statement fraud was the greatest consequence of stealing, leading to monthly losses of USD 39,800.
- Corruption, on the other hand, incurred a loss of USD 11,100; non-cash embezzlement lost approximately USD 6,000; and check and payment tampering accounted for a USD 4,600 loss, while billing fraud caused about USD 4,200 every month.
Time Theft Cost Statistics, 2026
- According to employee-monitoring.net, time theft costs U.S. employers between USD 450 billion and USD 550 billion every year through inflated timesheets, buddy punching, unauthorized overtime, long breaks, and personal internet use during work hours.
- The average annual cost of time theft is about USD 11,000 per hourly employee, while organizations without automated time-tracking systems lose 2%-8% of their total payroll.
- Buddy punching alone costs U.S. businesses around USD 373 million each year.
- Personal internet use during work hours costs employers about USD 7,400 per employee annually, based on 56 minutes of non-work browsing each day.
- Employees lose an average of 20 minutes per workday through extended breaks and leaving early. A company with 200 employees paying USD 30 per hour can lose nearly USD 520,000 annually, enough to cover the salaries of 8-10 additional employees.
Time Theft Prevalence Statistics
- Around 43% of hourly employees admit to exaggerating their working hours in anonymous surveys.
- About 75% of U.S. businesses experience buddy punching, while 1 in 5 employees say a coworker has clocked in for them at least once.
- Nearly 69% of employees admit wasting time at work every day. Among them, 31% waste about 30 minutes daily, while 6% waste 2 or more hours each day.
- Payroll audits show that 22% of payroll can be inflated because of manual timesheet rounding, and 64% of workplaces report employees regularly returning late from breaks.
Estimated Time Theft by Industry
| Industry | Estimated Daily Loss per Worker |
| Construction | 20 minutes |
| Healthcare | 15-25 minutes |
| Hospitality | 12-18 minutes |
| BPO / Call Centers | 10-15 minutes |
| Retail | 10 minutes |
| Professional Services | 25-40 minutes |
Remote Work Time Theft Statistics, 2026
- Around 37% of remote employees admit they log more working hours than they actually work on their timesheets.
- An E-Monitor report further stated that remote employees work an average of 1.4 more hours per day than office-based staff, helping offset some time theft concerns.
- About 67% of remote managers say they cannot confirm employees are working during logged hours without monitoring software.
- Companies using employee monitoring tools report 22% fewer payroll discrepancies than businesses relying on self-reported timesheets.
- Personal device use during work hours is 45% higher among remote employees than in-office workers.
- Only 28% of remote organizations use automated time-tracking systems, while 72% still depend on manual timesheets, self-reported hours, or no formal tracking.
Time-Tracking Software: Cost, Savings and ROI by Company Size
| Company Size (Employees) | Annual Software Cost (USD) | Estimated Time Theft Before (USD) | 25% Recovery (USD) | Net Annual Savings (USD) | ROI (%) |
| 25 | 1,350 | 68,750 | 17,188 | 15,838 | 1,173 |
| 50 | 2,700 | 137,500 | 34,375 | 31,675 | 1,173 |
| 100 | 5,400 | 275,000 | 68,750 | 63,350 | 1,173 |
| 250 | 13,500 | 687,500 | 171,875 | 158,375 | 1,173 |
| 500 | 27,000 | 1,375,000 | 343,750 | 316,750 | 1,173 |
Global Occupational Fraud Losses by Region
- chanty.com report stated that Latin America and the Caribbean recorded the highest median occupational fraud loss, reaching USD 250,000 per case in 2026.
- Asia-Pacific reports a median loss of USD 200,000, tying for the second-highest among all regions.
- Eastern Europe and Western/Central Asia also report USD 200,000 per case, with a higher incidence of corruption-related fraud.
- Sub-Saharan Africa records a median loss of USD 154,000, which is similar to North America.
- The United States and Canada and Western Europe each report a median loss of USD 150,000 per fraud case.
By Industry
- The mining industry records the highest median occupational fraud loss at USD 550,000 per case.
- Wholesale trade follows with a median loss of USD 361,000, while manufacturing reports USD 267,000.
- Government and public administration experience a median loss of USD 150,000 per case.
- Education records USD 50,000, while retail has the lowest median loss at USD 48,000 per occupational fraud case.
Employee Data Theft Statistics
- According to an IDWatchdog report by Equifax, stated that Employee data theft is linked to 60% of all data breaches, making insiders the leading source of sensitive information leaks.
- More than 60% of organizations report that employees intentionally steal confidential data or intellectual property for personal gain or to join competitors.
- The average cost of an insider-related data breach reached USD 10.5 million, exceeding the cost of breaches caused only by external attackers.
- Around 33% of employees admit taking company data when leaving a job, often using personal devices or cloud storage.
- The financial services sector accounts for 42% of insider data theft incidents because of the high value of financial information.
- About 72% of cases occur within the first 30 days after an employee leaves.
- Employees aged 30-40 are 35% more likely to steal data than older workers.
- Nearly 78% of organizations lack strong controls to prevent or detect insider data theft.
Employee Theft Cost Statistics
- According to gitnux.org, employee theft costs U.S. businesses over USD 50 billion annually, while occupational fraud has a median loss of USD 120,000 per case.
- Retail shrinkage reaches USD 94 billion each year, with employees responsible for about 30%, while global inventory theft totals USD 100 billion.
- The average employee theft incident causes a loss of USD 1,500, cash theft averages USD 2,000 per case, and time theft costs U.S. employers USD 50 billion annually.
- Estimated annual employee theft losses include USD 5 billion in Australia, USD 4.5 billion in Canada, and GBP 1.5 billion in the UK.
- Small businesses lose about USD 200,000 per theft scheme, while large companies report a USD 1 million median fraud loss and retail stores lose USD 1.4 million annually.
- Industry losses include hospitality (USD 10 billion), manufacturing (USD 15 billion), healthcare (USD 20 billion), finance (USD 12 billion), construction (USD 8 billion), grocery (USD 5 billion), apparel (USD 3 billion), technology (USD 6 billion), warehousing (USD 4 billion), automotive (USD 2.5 billion), pharmacies (USD 1.8 billion), hotels (USD 2.2 billion), non-profits (USD 1 billion), government (USD 7 billion), and education (USD 3.5 billion).
Key Country-Level Employee Theft Statistics
- In the United States, employee theft accounts for about 33% of all retail losses in 2026, as per Marketbiz.
- Employee theft rates vary across countries, with Canada (16%), the UK (11%), Australia (25%), Japan (10%), South Africa (18%), and Germany (8%).
- Among emerging markets, India (24%), Mexico (20%), and Brazil (12%) report notable employee theft rates.
- In the United Kingdom, employee theft causes estimated annual losses of around GBP 1.5 billion, with the retail and hospitality sectors facing the highest risk.
- The ACFE Occupational Fraud 2026: Report to the Nations examined 2,402 occupational fraud cases across 143 countries, highlighting that employee theft is a global business challenge.
- Across many countries, employee theft represents roughly 25%-35% of total retail shrink, although the share varies by market.
Employee Theft Demographic Statistics
- According to ACFE Occupational Fraud 2026, men account for 72% of occupational fraud cases, while women represent 28%, although the difference in financial losses between genders has narrowed over time.
- By job level, 64% of employee offenders are men and 36% are women. Among managers, 76% are men and 24% are women, while owners and executives account for 79% men and 21% women.
- Employees aged 36-40 years represent the largest group of occupational fraud offenders, making up 19% of investigated cases.
- Around 67% of people involved in occupational fraud hold a college degree, showing that employee theft is not limited to less-educated workers.
- Employees with 1-5 years of service account for 45% of fraud cases, while long-serving employees often cause greater financial losses because they typically have broader access and higher authority within organizations.
Employee Motivation For Theft
- About employee theft statistics, 34% of workers who commit theft have been with their company for five years or longer.
- First-time offenders are responsible for 60% of all work-related thefts committed by employees.
- 23% of stealing employees feel they have a right to do so.
- The desire for excitement motivates 29% of workers who steal.
- Among those who engage in theft offenses, 35% fall within the age bracket of 25-34 years.
- Males have a higher propensity for stealing than females in the workplace.
- Previous criminal records do not exist for 70% of employee thieves.
- 86% believe they will escape detection when committing theft.
- Among thieves, 20% come from clerical jobs.
- 36% of the examining staff who stole were part of that company for over five years.
- 78% of hardworking thieves have never been in police hands before.
- 5Fifty-four guilty workers still owe some loyalty to their bosses while committing robbery.
- 27% of embezzlers do so as a way out to clear their debts.
- 31% of underpaid individuals rationalize robbery as legitimate conduct on their part.
- More than half (61%) of first-time criminals form a broad network of thieves within the ranks of workers.
- They have employed 23% of present-day robbers for over five years.
- 45% of theft-related employees have inadequate finances.
- 41% of workers may resort to theft due to economic problems.
Employee Theft Prevention and Detection Statistics
- 75% of employee theft cases are detected through tips, and 80% of those tips come from employees.
- CCTV systems reduce theft by 25%, while AI surveillance lowers losses by 35%.
- Background checks prevent 40% of dishonest hires, and pre-employment screening reduces incidents by 28%.
- Inventory audits detect 30% more theft, while internal audits help recover 45% of losses.
- Employee training cuts theft by 50%, and ethics training reduces it by 27%.
- POS data analytics identify 22% of suspicious transactions, and behavioral analytics flag 18% of potential risks.
- Segregation of duties prevents 70% of fraud, while access controls reduce data theft by 55%.
- RFID tags lower inventory theft by 40%, random cash counts improve detection by 32%, and automated alerts reduce response time by 50%.
- Around 50% of undetected fraud lasts more than 18 months, while 65% of companies still lack effective anti-fraud controls.
Summary
Employee theft can hurt a business by causing financial losses, lower productivity, and reduced trust. The good news is that companies can prevent many cases with clear rules, regular checks, secure systems, and honest workplace values. As more work moves online, businesses should also protect digital data and company information.
Creating a culture of trust, responsibility, and accountability helps reduce theft and supports long-term growth, stronger teams, and a safer workplace. Instill them, minimize financial losses, and keep the workplace environment harmonious.
FAQ
Digital wallets are the most popular online payment method, followed by credit and debit cards worldwide.
E-commerce, retail, travel, healthcare, entertainment, food delivery, and subscription services benefit the most from online payment solutions.
Online payments are growing due to smartphones, e-commerce, digital wallets, faster internet, secure transactions, and increasing demand for cashless payments.

Sources


