Introduction
Slack vs Microsoft Teams Statistics: As global workspaces are enhancing digitally in recent years, with effective team communication playing a vital role in maintaining numerous collaborations, both Slack and Microsoft Teams are considered the best-known platforms. Slack is a cloud-based team communication platform mainly focused on business administration and communication.
In contrast, Microsoft Teams is a team collaboration platform integrated with Microsoft 365, offering features such as video meetings, calling, messaging, and file sharing. As remote and hybrid working models have become today’s new normal, organisations are eventually facing numerous challenges in choosing the right tools for their teams.
This article will guide you effectively, as it provides a comprehensive comparison between the two platforms, including features, pricing, user experience, and performance, to help determine which platform best suits your business needs in 2025.
Editor’s Choice
- According to 6sense reports, in the instant messaging and chat category, Slack holds the highest market share of 9.81%, while Microsoft Teams accounts for 0.73% in 2025.
- Statista reports that in 2025, Slack is expected to generate revenues of around USD 4,217 million, while in 2024, Microsoft earned around USD 77 billion from its productivity and business tools, according to Notta’s report.
- Business of Apps states that in 2024, Microsoft Teams had the highest total number of users, at 320 million, while Slack secured 42 million.
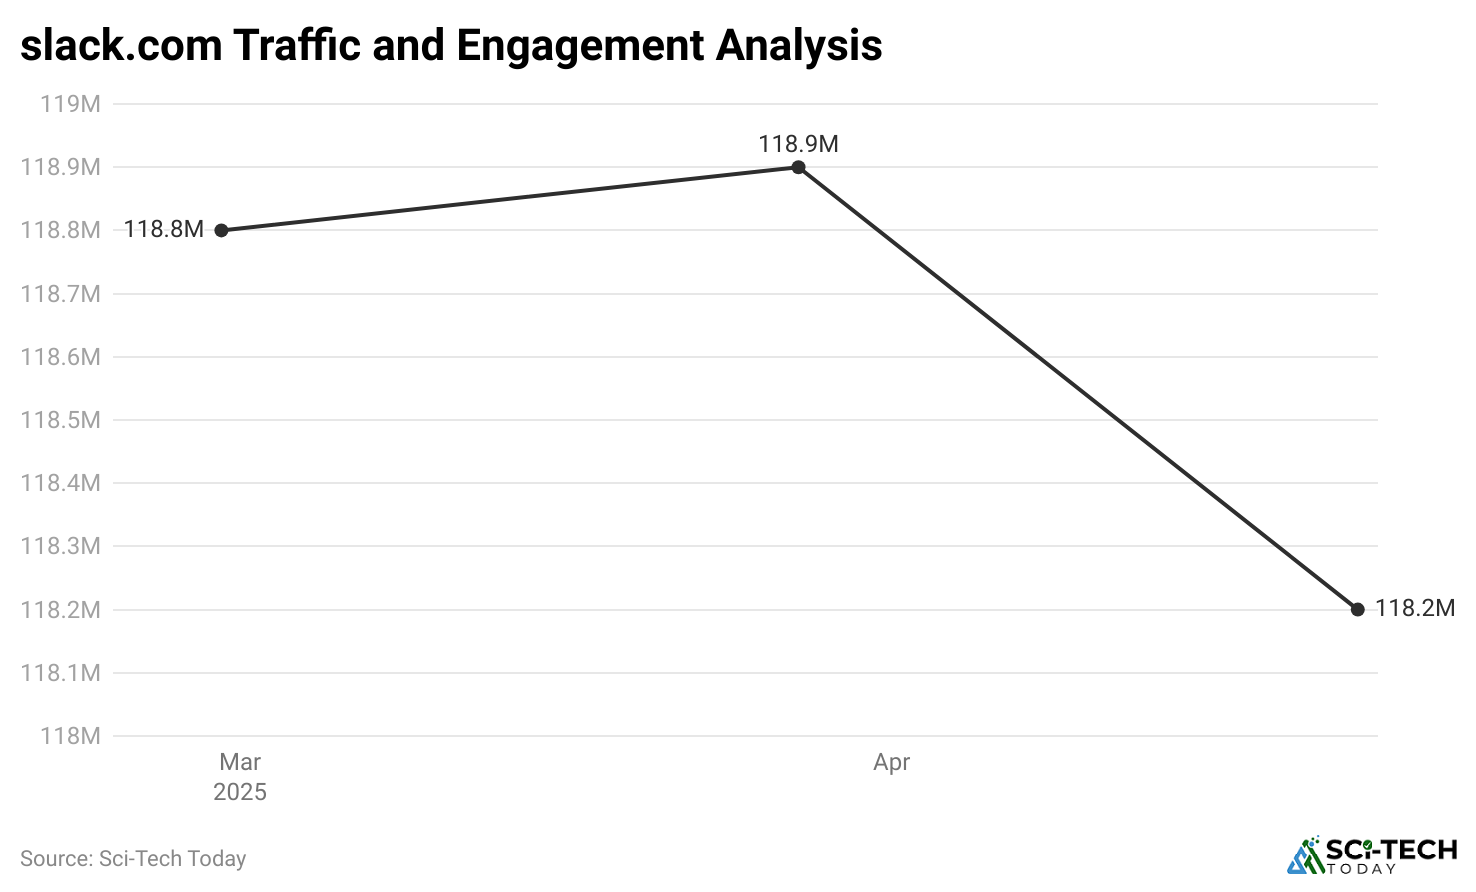
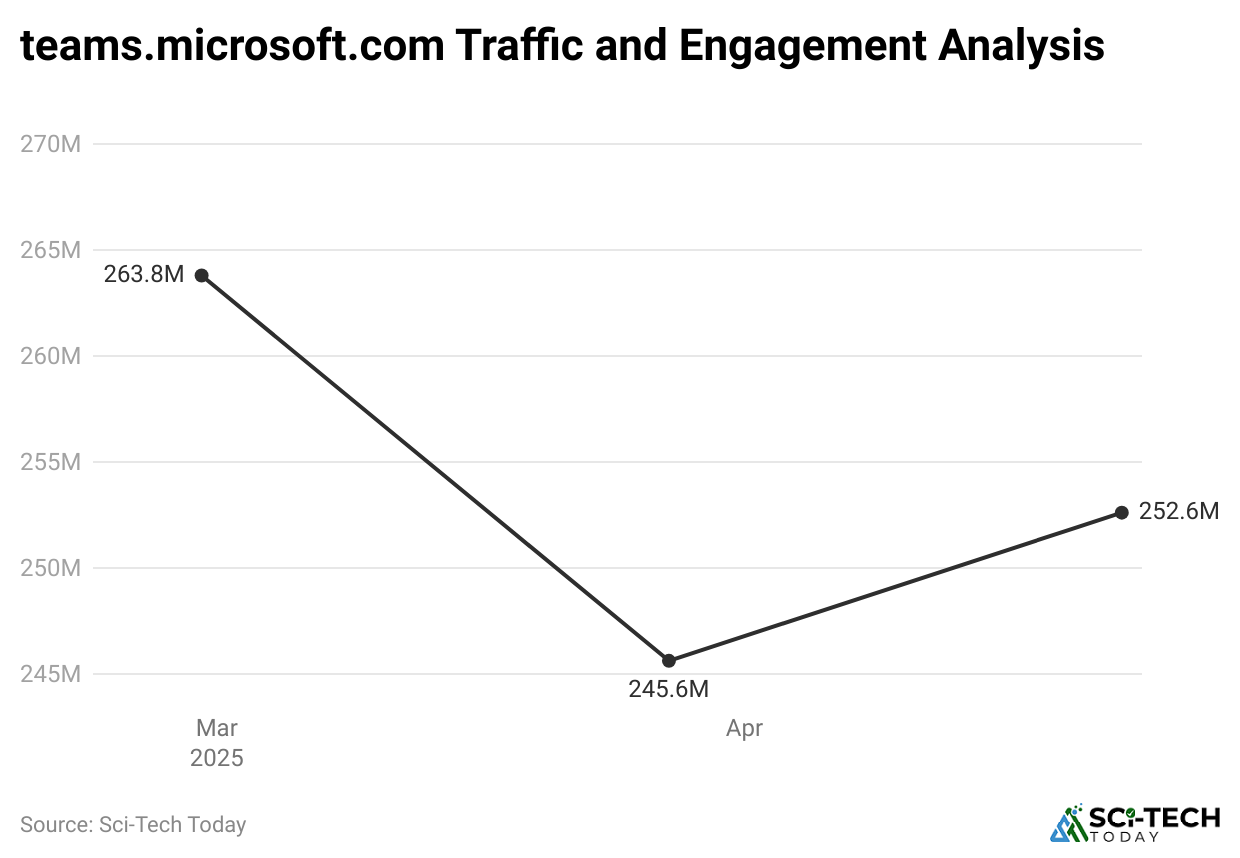
- Statista report of May 2025 states that slack.com accounted for 118.2 million visits, while teams.microsoft.com accounted for approximately 252.6 million visits.
- During the same period, the United States of America accounted for the highest share of the Google Meet website, at 33.33% (-3.48%), followed by Microsoft Teams at 15.58% (-10.04%).
- In 2025, more than 62,380 companies worldwide are expected to use Slack, and Microsoft Teams is expected to be used by 46,500 companies.
Basic Company Comparison
| Slack | Microsoft Teams | |
| Developer | Slack Technologies (Salesforce) | Microsoft |
| Release Date | August 14, 2013 | March 14, 2017 |
| Operating system | Microsoft Windows, macOS, Linux, iOS, Android | Windows, macOS, iOS, Android, Web |
| Language available in | 12 | 48 |
| Type | Collaborative software | |
| License | Proprietary | Proprietary commercial cloud software |
| Website | slack.com | teams.microsoft.com |
Top Features of Slack vs Microsoft Teams
| Features | Slack | Microsoft Teams |
| App integrations | 2,600+ and integrates with Zapier; free plan is capped at 10 active integrations | 2,500+ and integrates with Zapier |
| Participant capacity | Unlimited | 25,000 users |
| Audio/Video Calls | Unlimited 1:1 voice and video calls in the Free Conference calls for up to 50 participants in paid plans. | Voice or video calls with up to 250 people in a meeting. |
| Chat | All messages from the last 90 days are searchable on the free plan, with advanced search options.
No limit on paid plans |
No limit, but search options are much less advanced |
| Storage | 5GB file storage for a team in the free plan (only for 90 days).
10GB per person in the Pro plan, 20 GB per person in the Business+ plan. |
5GB across all teams in the free plan.
2 GB of cloud storage per person on the Microsoft Teams Essentials plan. 1 TB of cloud storage per person in the Business Basic and Business Standard plans. |
| Security | Through integrations | Built into the app |
| Setup | Quick and easy to set up, and anyone can join with just an email address | Need a Microsoft email address to set up a free account.
Guests can join chats only if they have a Teams account. |
| Use | Easy once you get used to the UI | Streamlined and clear, but requires extra clicks |
| Others | Chat summaries, daily channel recaps, and AI-powered Q&A search.
Available with Slack AI add-on at USD 10 per user per month. |
Everything Slack offers, plus video meeting recaps and summaries.
Available with a Microsoft 365 Copilot license at USD 30/user/month. |
| Customisation | More options available | Fewer options |
| Interface colour options | Custom sidebar themes | 3 themes (light, dark, high contrast) |
Slack vs Microsoft Teams Statistics By Market Share
- Q3Tech reports that, as of 2025, Microsoft Teams holds the largest market share at 37%, based on Statista data.
- Slack, with a market share of about 13%, is more popular among tech startups and medium-sized companies.

(Reference: 6sense.com)
- According to 6sense reports, in the instant messaging and chat category, Slack holds the highest market share of 9.81%, while Microsoft Teams accounts for 0.73% in 2025.
Furthermore, the market share comparison of both in different categories is mentioned in the table below:
| Categories | Slack | Microsoft Team |
| Education | 90.60% | 9.04% |
| Software Development | 93.32% | 6.68% |
| Consulting | 91.72% | 8.28% |
By Revenue
(Reference: 6sense.com)
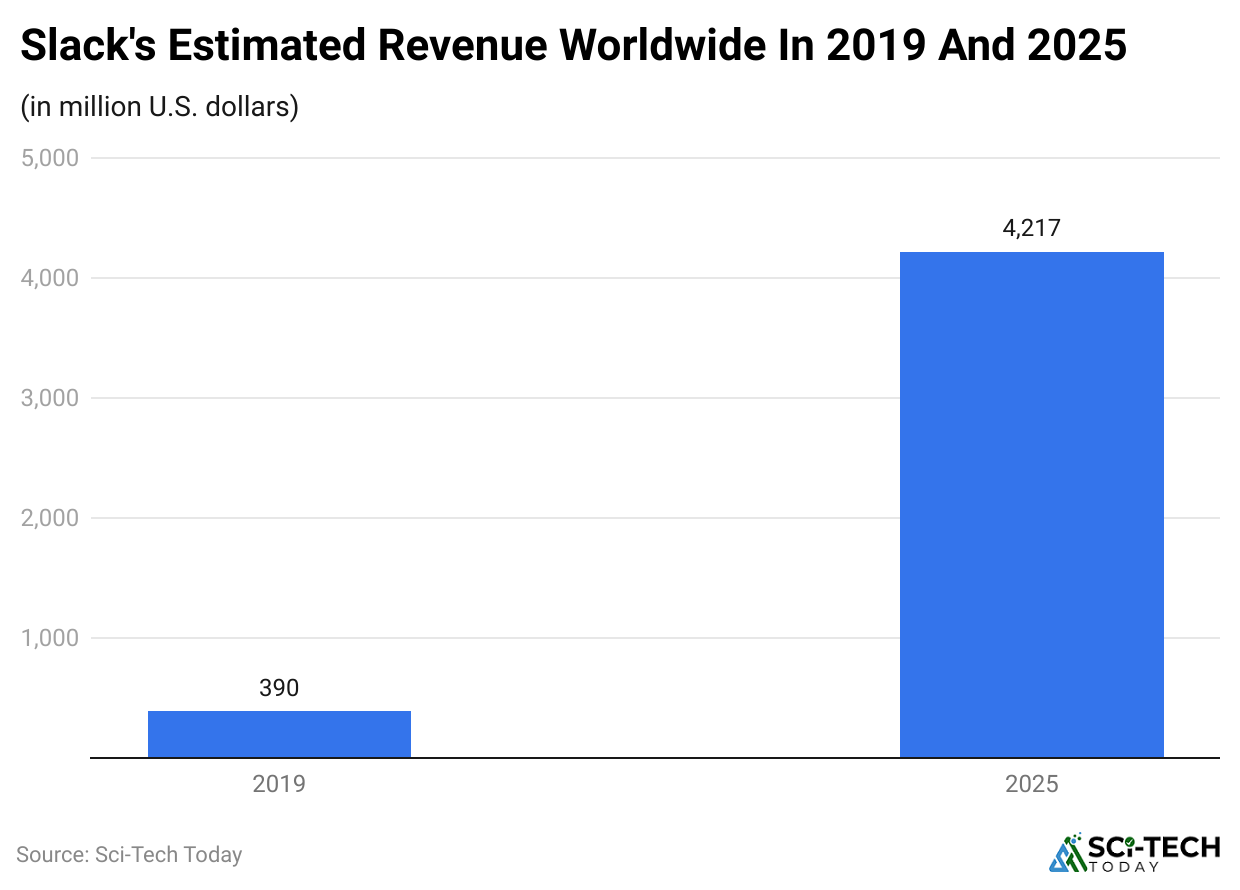
- As of 2025, globally, Slack is expected to generate revenues of around USD 4,217 million, increased from USD 390 million in 2019.
- According to Notta’s report analysis, in 2024, Microsoft earned approximately USD 77 billion from its productivity and business tools, including those in the Microsoft 365 suite.
- It also generated approximately USD 105 billion from its cloud services, contributing to the company’s record total revenue of USD 245 billion that year.
(Source: demandsage.com)
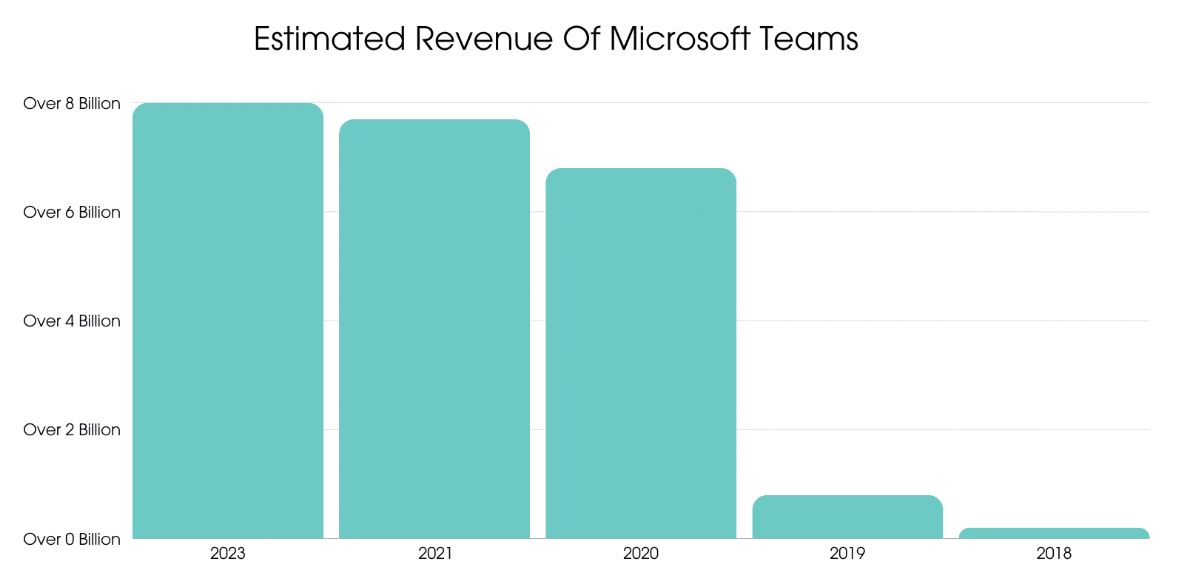
- As of 2023, Microsoft Teams made more than USD 8 billion in revenue.
Slack vs Microsoft Teams Users Statistics
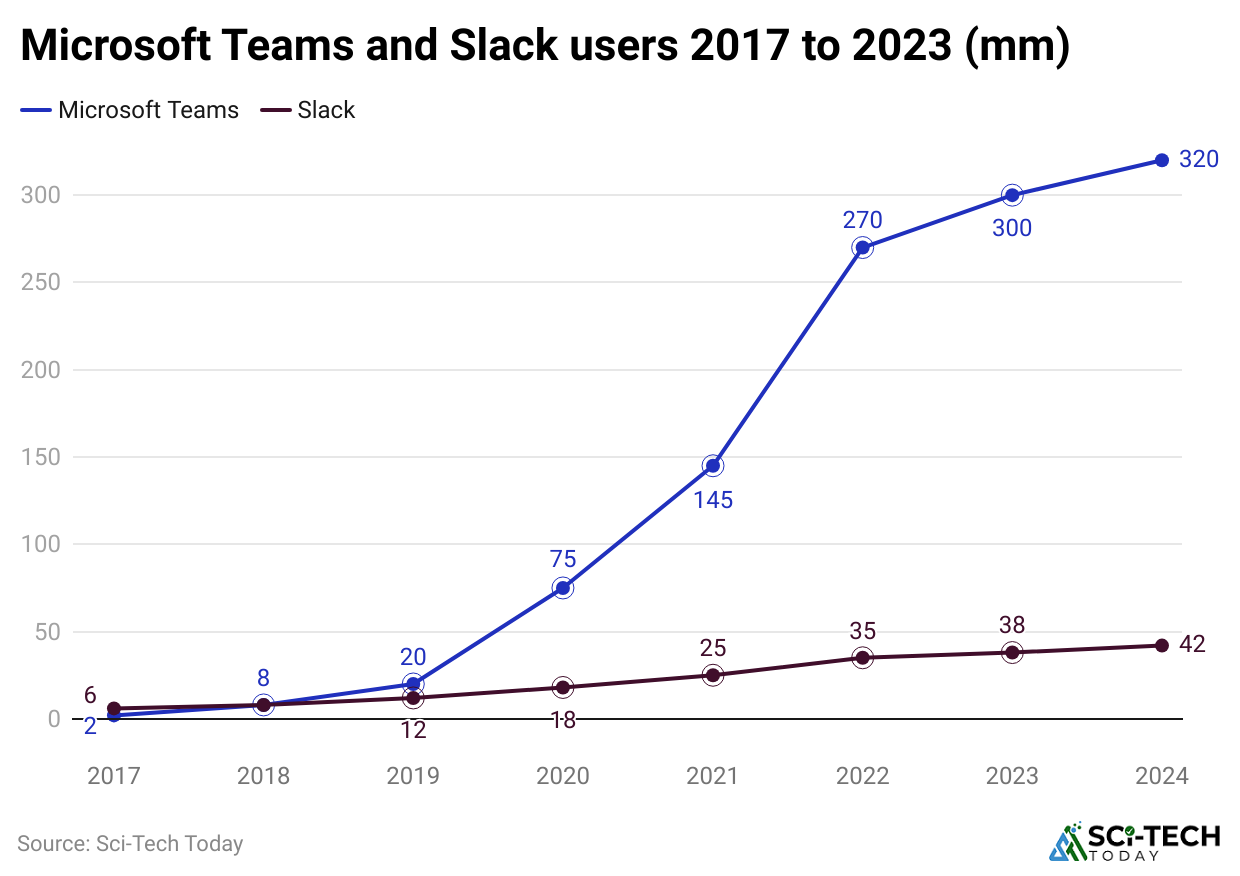
(Reference: businessofapps.com)
- The above graphical analysis shows that in 2024, the total number of Microsoft Teams users remained the highest, with 320 million.
Microsoft Teams users’ statistics by age groups are detailed below:
| Age Group (Age) |
Users Share |
| 35 to 44 | 31.23% |
| 45 to 54 | 29.98% |
| 55+ years | 20.82% |
| 25 to 34 | 13.90% |
| 18 to 24 | 4.08% |
- Meanwhile, Slack had only 42 million users in the same period.
- According to DemandSage reports, as of 2025, Slack’s daily user base is estimated to reach 47 million, with 65 million monthly active users.
Slack vs Microsoft Teams Customer Statistics
- In 2025, more than 62,380 companies worldwide are expected to use Slack as their primary communication tool, according to 6sense reports.
- Meanwhile, over 46,500 companies have chosen Microsoft Teams for instant messaging and chat.
By Products And Services
| Sectors | Slack Customers |
Sectors | Microsoft Team Customers |
| Digital Marketing | 8,369 | Research | 711 |
| Social Media | 7,711 | Project Management | 676 |
| Education | 7,398 | Higher Education | 596 |
| Web Development | 7,074 | Consulting | 583 |
| Software Development | 7,031 | Managed Services | 580 |
| Technology | 6,905 | Continuing Education | 571 |
By Employee Size
- During the same period, the majority of Slack users in the communication category were companies with 20 to 49 employees, totalling around 217,845 businesses.
- In comparison, Microsoft Teams was mostly used by companies with 100 to 249 employees, with about 9,590 such firms.
| Employee Size | Slack Customers |
Employee Size | Microsoft Teams Customers |
| 100 – 249 | 156,176 | 20 – 49 | 7,838 |
| 0 – 9 | 107,574 | 0 – 9 | 7,367 |
| 250 – 499 | 47,204 | 1,000 – 4,999 | 6,522 |
| 1,000 – 4,999 | 33,697 | 250 – 499 | 4,513 |
By Geography
- The 6sense report further states that the United States accounts for the highest number of customers in both Slack and Microsoft Teams, resulting in 331,400 (65.48%) and 19,985 (54.76%), respectively.
Besides, the total number of customers in different geographies is stated in the table below:
| Country | Sack | Microsoft Teams |
| United Kingdom | 44,576 | 4,768 |
| Canada | 28,029 | 2,585 |
| India | 25,691 | – |
| Germany | 17,124 | 2,574 |
| Australia | 16,257 | 1,584 |
| Netherlands | – | 1,330 |
| France | 14,784 | 1,283 |
Slack vs Microsoft Teams Pricing Statistics
| Slack | Microsoft Teams |
| The FreemiumPro plan offers USD 7.25 per person per month.
When billed yearly, the cost is USD 8.75 per person per month; when billed monthly, the cost is USD 0.73 per person per day. |
Freemium: Microsoft Teams Essentials offers USD 4.00 per person per month, paid annuallY. |
| The Business plan offers USD 12.50 per person per month.
When billed yearly, it is USD 15 per person/month when billed monthly |
Business Basic offers USD 6.00 per person/month, paid annually. |
| Enterprise Grid plan offers a customisable plan. | Business Standard offers a subscription of USD 12.50 per person per month, paid annually. |
| – | Business Premium offers USD 22.00 per user/month, paid annually. |
Slack vs Microsoft Teams Website Traffic Statistics
(Source: similarweb.com)
- The above graph indicates that in May 2025, Slack.com accounted for 118.2 million visits, a 0.63% decrease from April.
- Similarly, the website’s bounce rate was 25.93%.
- Meanwhile, the average number of pages per visit was 8.76, and the average visit duration was 00:17:36.
- The website’s global ranking is #289.
- In Japan, it ranked #115 overall, and within its category, it ranked #11.
(Source: similarweb.com)
- In the same duration, the total number of visits to teams.microsoft.com was approximately 252.6 million, a 2.83% increase from April 2024.
- The website’s bounce rate was 31.87% in the same period.
- Meanwhile, the average number of pages per visit was 3.83, and the average visit duration was 00:04:11.
By Country
(Source: similarweb.com)
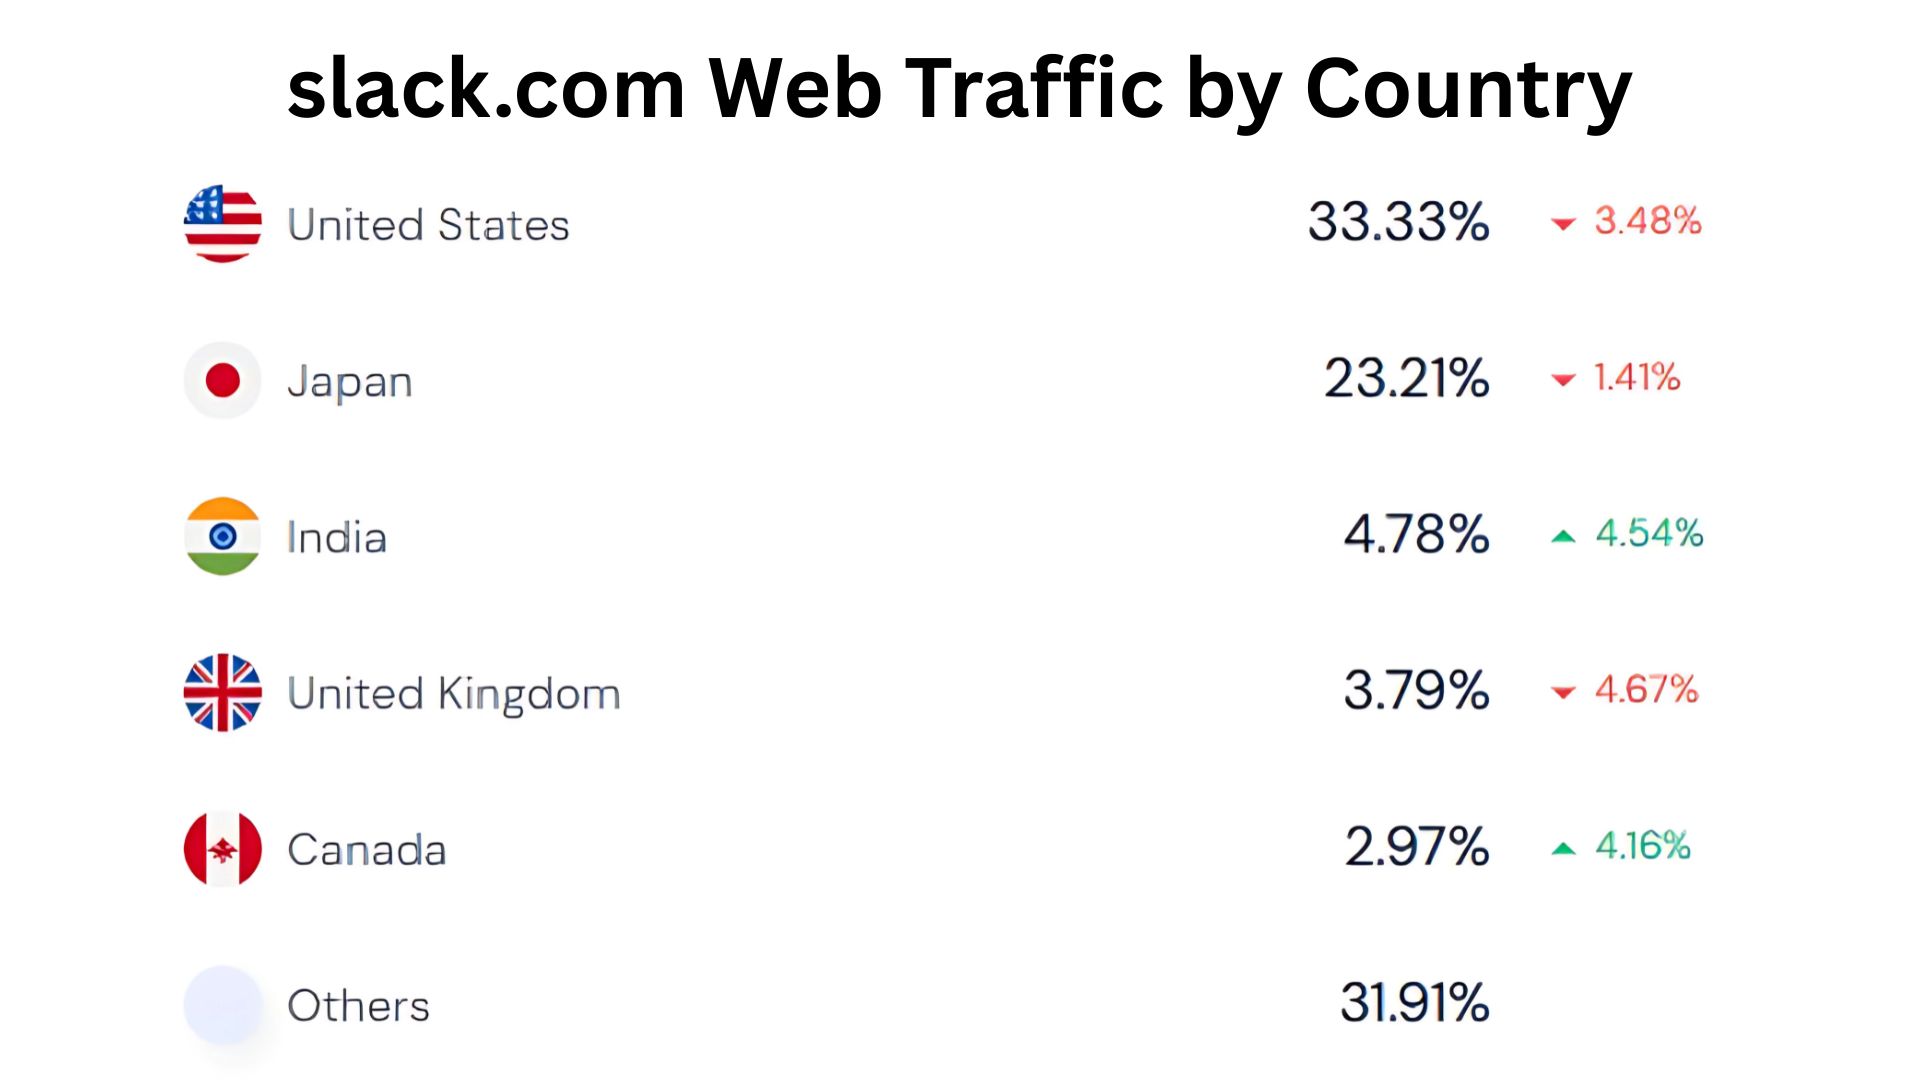
- The United States of America accounted for the highest Slack website share of 33.33% in May 2025, down by 3.48% from the previous month.
- The following are the top five countries by website traffic share: Japan: 23.21% (-1.41%), India: 4.78% (+4.54%), the United Kingdom: 3.79% (-4.67%), and Canada: 2.97% (+4.6%).
- The rest of the countries captured a share of 31.91% of Slack.com web traffic.
(Source: similarweb.com)
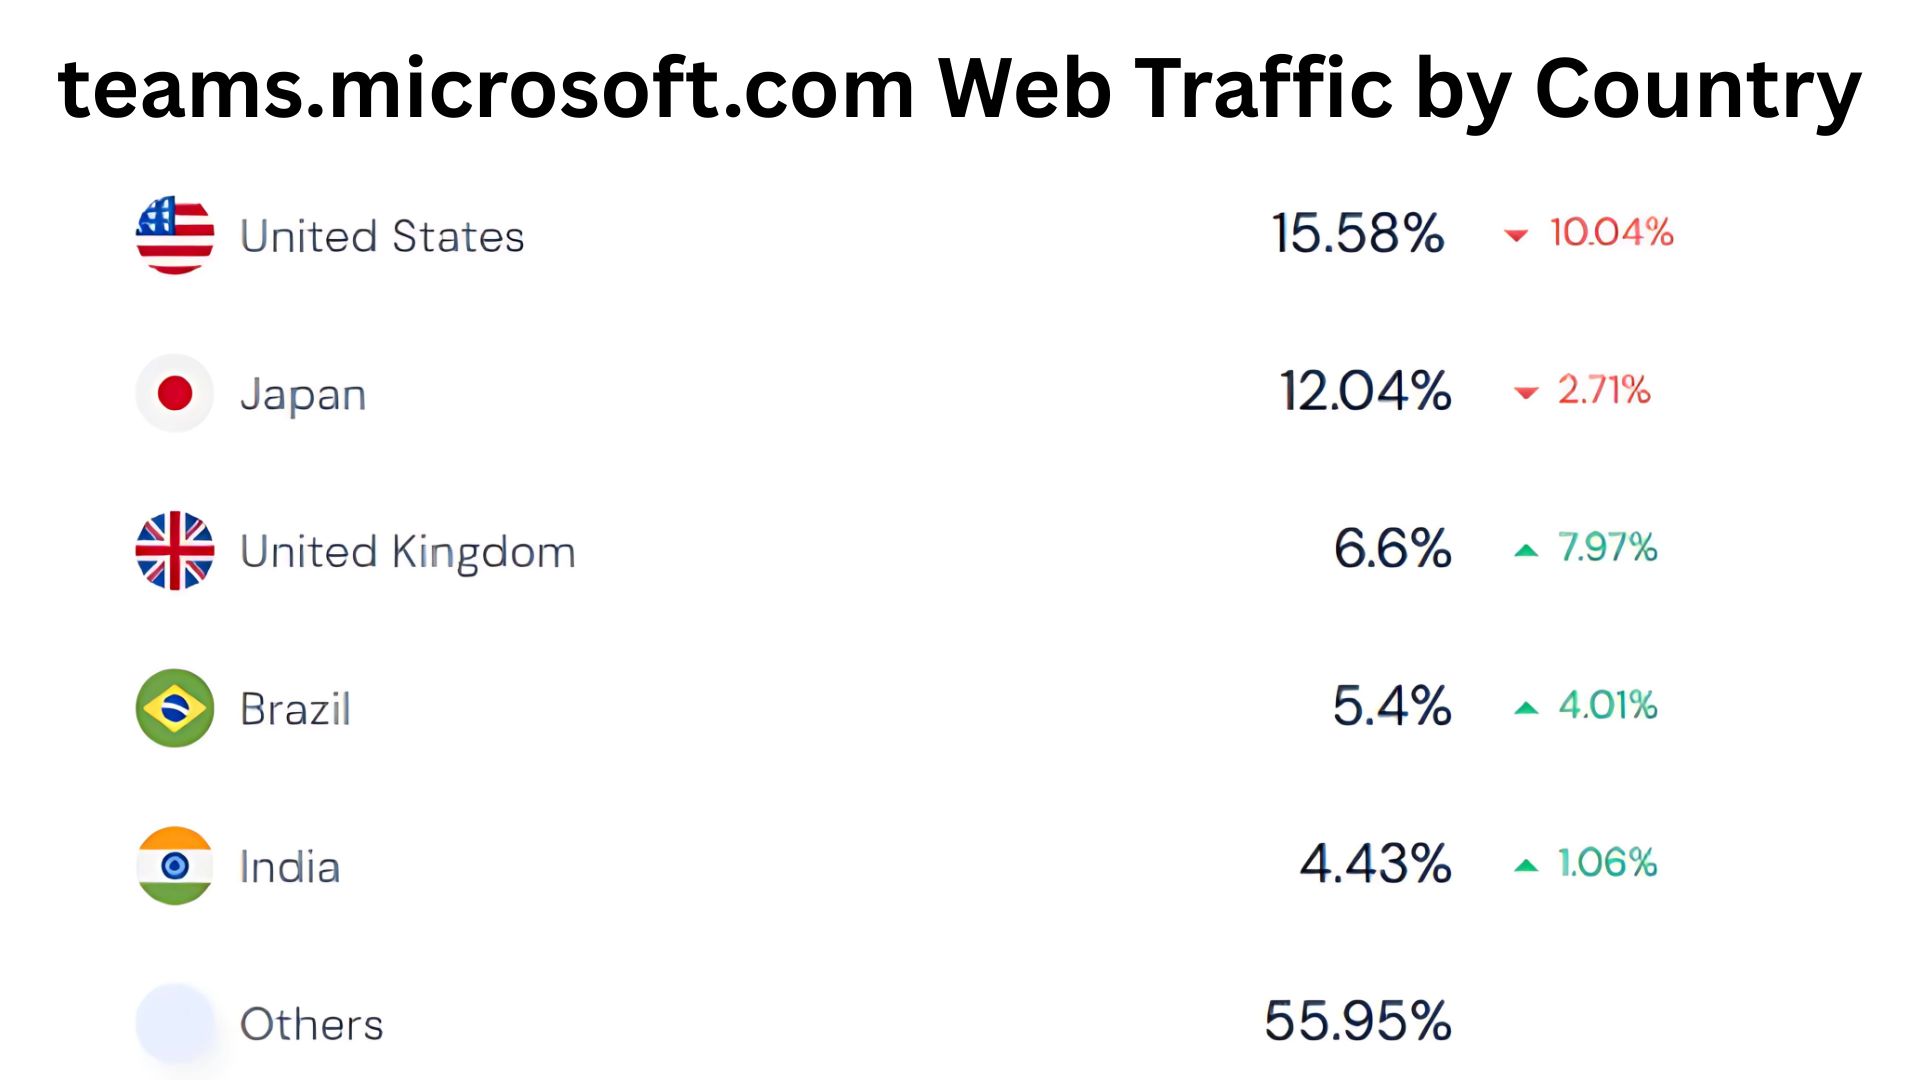
- The above graph shows that the United States captured the highest website traffic, as captured by Microsoft Teams, with 15.58% (-10.04%).
- Moreover, Japan accounted for 12.04% (-2.71%), and the United Kingdom accounted for 6.6% (+7.97%).
- The website traffic of the next two countries in the same period is as follows: Brazil: 5.4% (-0.64%) and India: 4.43% (+1.06%).
- Moreover, the traffic share of other countries on the Microsoft Teams website secured 55.95%.
By User Demographics
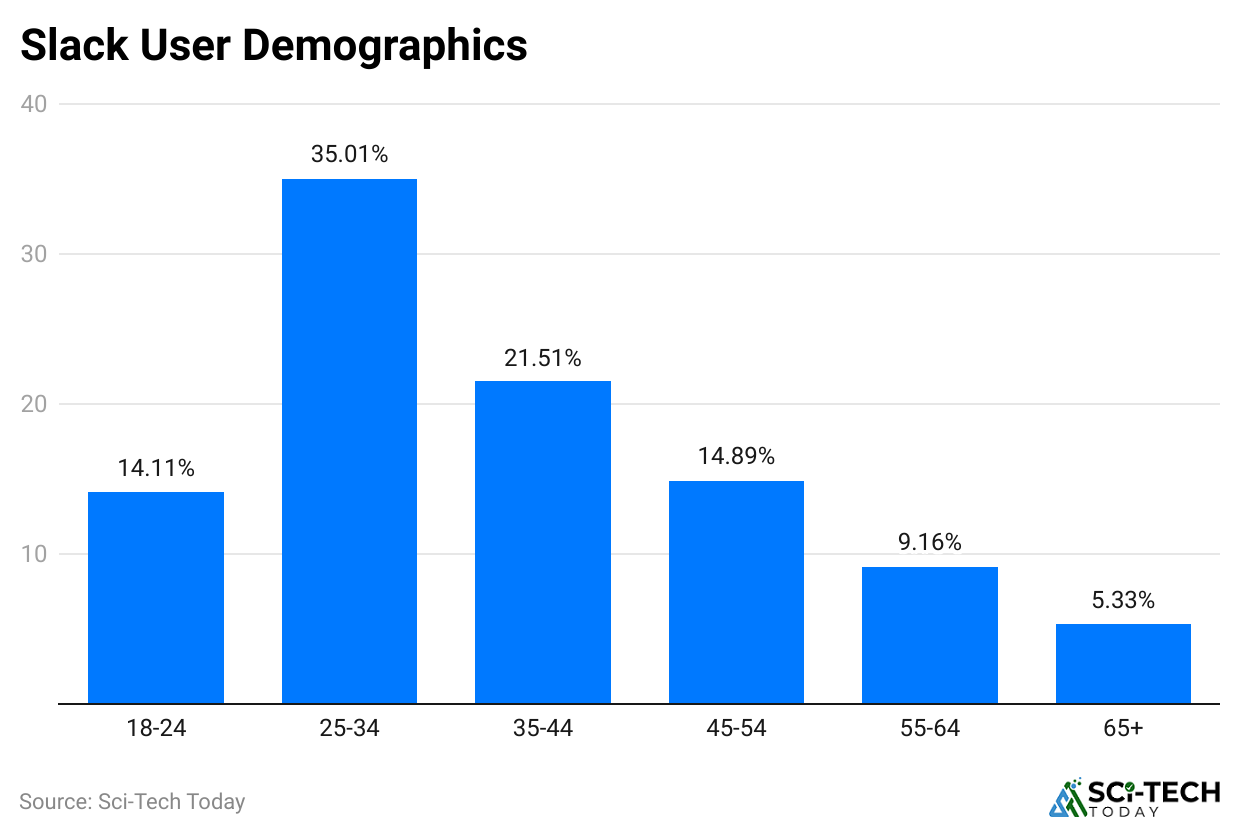
(Reference: similarweb.com)
- As of May 2025, the total number of Slack’s website users aged 25 to 34 years accounted for the highest share, at 35.02%, followed by those aged 35 to 44 years at 21.51%.
- Furthermore, the age distribution of other users is as follows: 45-54 years (14.89%), 18-24 years (14.11%), 55-64 years (9.16%), and 65 years and older (5.33%).
- Based on gender, approximately 51.96% of Slack users were male, and 48.04% were female.
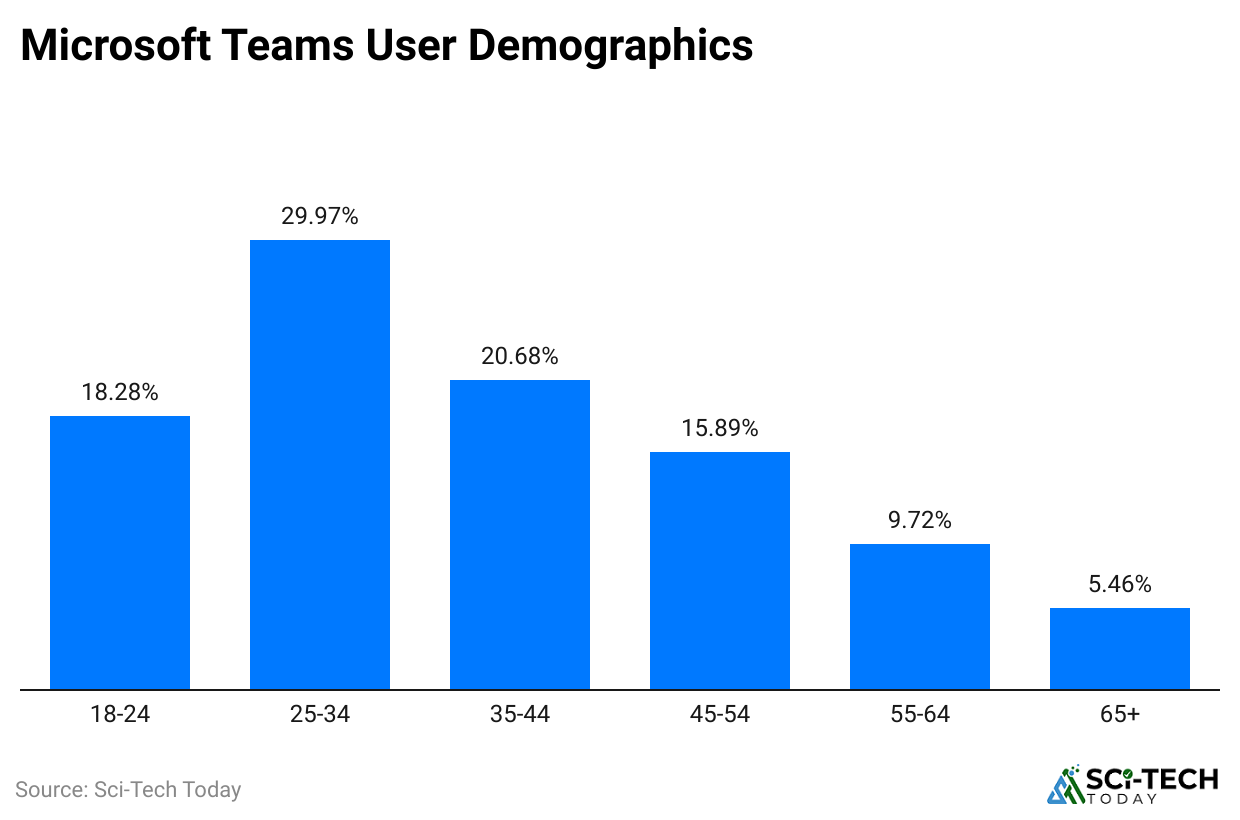
(Reference: similarweb.com)
- The above graph shows that the highest share of Microsoft Teams website users was captured by those aged 25 to 34 years, at 29.97%.
- The age distribution of other users is as follows: 35-44 years (20.68%), 18-24 years (18.28%), 45-54 years (15.89%), 55-64 years (9.72%), and 65 years and older (5.46%).
- Male and female users share secured at 47.43% and 52.57%, respectively.
By Marketing Channels Distribution
- According to Similarweb reports, in May 2025, the top traffic sources for Slack’s and Microsoft Teams’ websites accounted for direct search, with 81.21% and 75.06%, respectively.
Furthermore, other traffic sources of both platforms’ websites are mentioned in the table below:
| Marketing Channels | Slack | Microsoft Team |
| Referrals | 5.51% | 6.05% |
| Organic Search | 12.88% | 17.82% |
| Paid Search | 0.13% | <0.01% |
| Social | 0.12% | 0.32% |
| 0.03% | 0.26% | |
| Display | 0.11% | 0.49% |
By Social Media
- At the same time, the social network traffic accounted for by the Websites of Slack.com remained the highest on LinkedIn with a traffic share of 27.29%.
- Meanwhile, teams.microsoft.com holds the highest traffic share on YouTube with a share of 42.87%
Other platforms’ traffic is stated as:
| Platform Name | Slack | Platform Name | Microsoft Team |
| YouTube | 21.01% | 15.17% | |
| 14.24% | WhatsApp Webapp | 13.85% | |
| 11.90% | Facebook Messenger | 7.41% | |
| X-twitter | 6.52% | 5.90% | |
| Others | 19.03% | Others | 14.80% |
Conclusion
After completing the article on Slack vs Microsoft Teams Statistics, both Slack and Microsoft Teams offer powerful tools for team communication, but they cater to different needs. Microsoft Teams has become the leader in conversation and collaboration tools, offering deep integration, strong security, and broad functionality.
In contrast, Slack provides a more flexible and user-friendly experience, especially favoured by startups and mid-sized businesses that rely on various third-party tools. Go through the overall analysis and choose wisely which team communication tool is better for you.
