






Introduction
Cost Per Lead Statistics: CPL still matters in 2026 for marketing and sales teams, but it should not be treated as the only yardstick. Paying less for leads does not always mean more profit. A budget campaign can pull in lots of people who are not ready to buy. At the same time, a pricier approach like account-based work or referrals may bring fewer leads, but the leads can be far more ready to convert and bring in more revenue.
This article will present the cost per lead statistics, including the cost benchmarks by industry, strategies, and marketing channels in 2026.
Featured Selection
- Enterprise firms show the top average CPQL at $628, while Startups and solo operators sit at $58.
- Organic CPL comes in 47% lower than paid CPL in B2B SaaS.
- Leads contacted within one hour are almost 7 times more likely to qualify, while the typical B2B response time is about 42 hours.
- For Meta Ads in B2B SaaS, CPL averages $63.40, while Qualified leads from this channel can run $150 to $250, and Enterprise leads are often $350 to $550.
- SEO and organic search average $54 CPQL as compared to LinkedIn Ads are much higher at $387, and Google Ads land around $312.
- Customer referrals list the lowest CPQL at $31, followed by organic social at $73, and Partner and referral programs show $87.
- B2B sites usually convert only 1% to 3% of visitors into leads, making conversion work a key task, not just pushing more traffic.
- Three-field forms reach 23.1% completion from people who start the form, compared with seven-field forms hitting 11.4%, and Forms with 10-plus fields fall to 6.9%.
- About 53% of mobile visits end after three seconds, while a 1- to 3-second delay increases bounce risk by 32%.
- Recycled or generic lists can add 30% to 50% more outreach waste, making checks and good data quality matter for keeping CPL efficiency from slipping.
What is the average cost per lead?
- Cost per lead (CPL) means how much money you spend to get one lead during a set time. You take your total marketing and sales costs for that period and divide by the total number of leads you got.
- It helps revenue and finance teams check how cost-effective different channels, campaigns, or regions are.
- Plain math looks like this: total spend ÷ total leads = CPL. For example, if you spend $50,000 in a quarter and you earn 200 leads, then CPL is $250.
- One thing to keep separate is the channel-level CPL version, which looks at leads from just one source, like paid search, organic posts, or events.
- Blended CPL mixes every channel usually the best number for planning and comparisons, since it shows the overall cost of the whole demand program, not only one part.
Lead Generation Monthly Cost Range
(Reference: webfx.com)
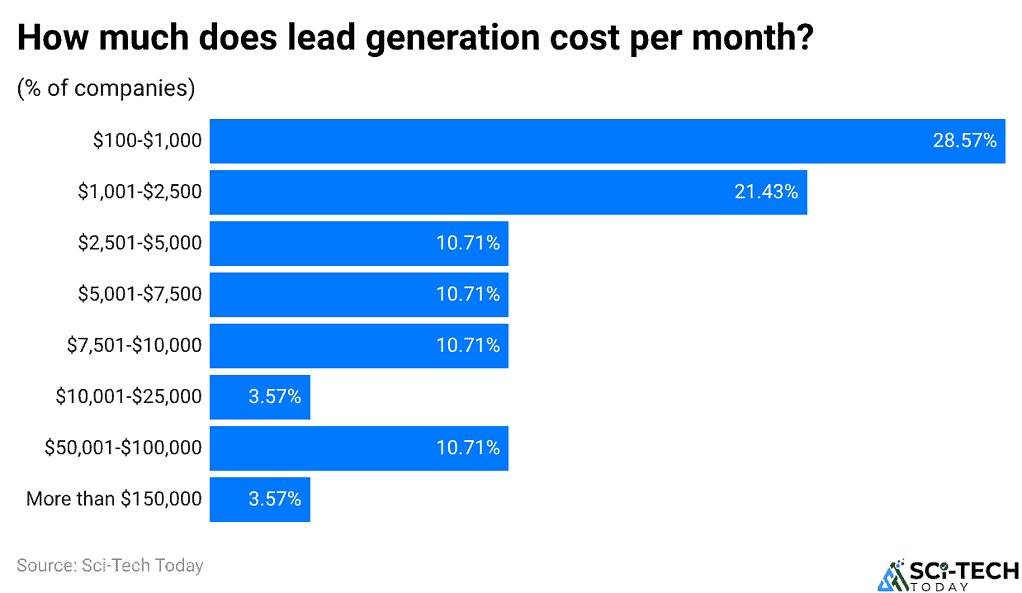
- WebFX reports that companies do not all spend the same amount on monthly lead generation.
- The most common results show up in the cheaper ranges; the bigger share of firms stays clustered.
- In detail, 28.57% of companies spend between $100 and $1,000 each month, and another 21.43% put money into the $1,001 to $2,500 band, suggesting that half of the companies spend $2,500 or less per month.
- Moving into higher budgets,10.71% of companies spend $2,501 to $5,000, while 10.71% also fall in the $7,501 to $10,000 range. When those three mid-range groups are added, the total is 32.13%.
- 3.57% spend $10,001 to $25,000, while another 10.71% spend $50,001 to $100,000. At the very high end, 3.57% spend more than $150,000 per month.
- Overall, the WebFX numbers point to a widespread monthly lead-generation spend, ranging from $100 up to more than $150,000, with firms spread across both modest budgets and much larger ones.
Average Lead Generation Cost by Company Size
| Company Size | Employee Count | Average CPQL | Target Audience |
| Enterprise | 5,000+ | $628 | C-suite, VPs, multiple stakeholders |
| Large Business | 1,000-4,999 | $437 | Directors, Senior Managers, VPs |
| Mid-Market | 250-999 | $284 | Managers, Directors |
| Small Business | 50-249 | $173 | Business Owners, Department Heads |
| Micro Business | 10-49 | $96 | Owners, Solo Decision-Makers |
| Startups/Solopreneurs | 1-9 | $58 | Founders, Individual Practitioners |
(Source: focus-digital.co)
- The size of the company has quite an impact on the average CPQL; as organizations grow, the process of making purchasing decisions becomes more complicated, and their buying processes also become more complicated.
- The smallest group of companies covers the Startups and Solopreneurs, which includes firms with 1 to 9 employees, and the average CPQL of this group is equal to $58 since these companies focus on solo practitioners and Founders.
- The next group is formed by micro businesses with 10 to 49 employees, and their average CPQL is equal to $96.
- The small businesses have 50 to 249 employees, and their average CPQL is $173. These target mainly business owners and heads of departments.
- The companies with 250 to 999 employees have an average CPQL of $284, while their targets are managers and directors.
- The large businesses with 1000 to 4999 employees spend $437 for one qualified lead, as their main audience includes directors, senior managers, and vice presidents.
- As for enterprises, the CPQL value is the highest, as these companies with 5000+ employees have a CPQL of $628, and their target group is C-suite leaders, vice presidents, and other members of their buying team.
- In general, the increase in prices from $58 to $628 indicates the rise in lead costs since higher authorities were involved in making decisions; this is in line with bigger deals and the increasing number of players in the process.
- In this respect, enterprise ventures require more investment in content-related activities, as well as in performing follow-up and outreach actions.
Strategies to Reduce Cost per Lead and Improve Lead Quality
- Cutting cost per lead (CPL) is about spending wisely, not just chasing higher lead counts. Start by tightening the ideal customer profile (ICP).
- Use firmographic details like industry, firm size, revenue, and the tech stack, and then layer in behavior clues that point to real purchase intent.
- Sales and marketing should lock these rules in before any campaigns get bigger.
- CPL alone is not enough to judge a channel. Compare what you pay to acquire leads with how many turn into results at each step of the funnel.
- First Page Sage says organic CPL is 47% lower than paid CPL in B2B SaaS and 34% lower in legal services. That points to the benefit of leaning less on paid acquisition.
- The shift is to balance with content and SEO, with the aim of answering the questions and issues people search for before they contact anyone.
- Organic traffic often takes longer to build; established content can generate leads, and strong pages can bring leads without paying for every click.
- Technical SEO, helpful content, good internal links, and steady publishing keep that engine running over time.
- Harvard Business Review reported that when companies contacted leads within an hour, they were close to 7 times more likely to qualify them than those that waited longer.
- Still, the typical B2B response time was about 42 hours to protect lead value, route leads faster, send alerts automatically, set clear ownership, and review routing often.
- Finally, CPL optimization requires a shared definition of a qualified lead. Sales and marketing should document the required firmographic characteristics, intent signals, and engagement threshold.
- Without this alignment, marketing may optimize for lead quantity while sales evaluates leads based on actual buying potential. The result is a lower reported CPL but weaker downstream performance.
Meta Ads Cost Per Lead by Industry
(Source: adamigo.ai)
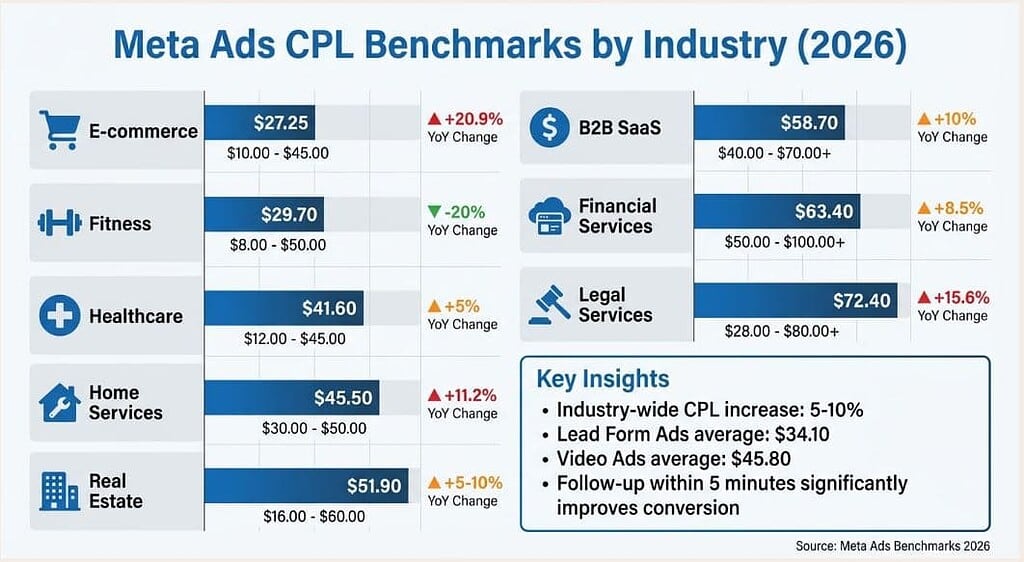
- Meta Ads CPL in 2026 will differ significantly based on the industry type, audience quality, length of sales cycle, and campaign objectives.
- Benchmarking data shows e-commerce remains one of the more affordable options, with a $29 to $31 CPL, $43.80 CPA average, 1.82% conversion rate, and $11.54 CPM.
- In 2025, e-commerce CPL went up 20% and is expected to go up an additional 5-10% in 2026.
- The food and drink industries will have CPA at $20.47, electronics at $22.17, fashion and clothing at $28.08, and health and beauty at $34.29, respectively.
- Based on Advantage+ campaign solutions, costs can be reduced by 15-25%, while over 40% of Meta ad impressions are generated by Reels ads.
- Real estate is more costly, with its CPL expected at approximately $54.50 to $57 as opposed to $51.90 in mid-2025.
- The costs in Tier 1 markets will range from $35 to $65, with Tier 2 indicating CPL from $20 to $45 and Tier 3 CPL ranging from $8 to $20.
- The average CPL of Lead Form Ads is $34.10 and $45.80 for Video Ads.
- The CPCs are expected to increase by 5 to 10%, and the CPL is expected to increase by 7% every year.
- In 2026, home services are expected to land at $34 CPL is higher than $30.57, and it implies an 11.2% jump.
- CPC is forecast to climb 10.6% to $2.30, while Conversions are expected to reach 7.0%.
- Some categories go higher, such as Roofing, gutters, and air conditioning, which can top $116.75 CPL, and Plumbing and heating sit at $72.97. Pest control is listed at $70.11.
- Healthcare comes in at $41.60 CPL on average, and the period from March 2025 through February 2026 shows $52.
- Monthly CPL moves between $23.26 and $81.34, and Ads that focus on appointments average $33.15.
- In January 2026, CPL dropped 44% compared with the prior year, while healthcare CPM rose 70%. It went from $22.76 to $38.70. Meta conversion averages 2.84%, compared with Search ads conversion is higher at 8.09%.
- Fitness is estimated at $29.70 CPL. This is about 29% under the $41.50 cross-industry benchmark. Costs swing from $13.50 in April to $48.33 in July.
- Even with overall Meta lead costs rising about 20%, CPL fell 20%, CTR is 1.63%, CPC is $1.92 as compared to Google Ads show a CPC of $5.26.
- For B2B services and SaaS, lead quality matters a lot. B2B SaaS averages $63.40 CPL, while Qualified leads are stated to cost $150 to $250, and enterprise leads are listed at $350 to $550.
- SaaS CPL reached $78.56 in January 2026 is up 109% year over year, with Q1 averages $36.23, while Q4 averages $78.15.
- Retargeting is expected to cut CPQL by about 40% to 60% versus cold traffic.
- Ultimately, the finance sector reached a CPL average of $24.82, while the financial consulting business achieved a CPL of $58.70.
- In terms of the range of benchmarks in the legal industry, the CPL ranged from $67 to $254, while the median was $164.
- The financial industry experienced a 24% year-over-year increase in CPL, and the legal industry registered a 20% decrease in CPL.
- According to TryCrush.ai, the CPQL and CAC metrics allow a more insightful assessment of efficiency than the CPL alone does.
Average Cost Per Lead by Marketing Channel
| Marketing Channel | Average CPQL | Best For | Time to ROI |
| LinkedIn Ads | $387 | B2B, Enterprise targeting | 3-6 months |
| Paid Search (Google Ads) | $312 | High-intent searches | 1-3 months |
| Display Advertising | $289 | Brand awareness, retargeting | 6-12 months |
| Facebook/Instagram Ads | $247 | B2C, SMB targeting | 2-4 months |
| Industry Events/Trade Shows | $231 | Networking, relationship building | 3-9 months |
| Direct Mail | $218 | Account-based marketing | 2-5 months |
| Webinars | $186 | Thought leadership, education | 2-4 months |
| Content Syndication | $173 | Lead volume, awareness | 3-6 months |
| YouTube Ads | $154 | Video-first audiences | 4-8 months |
| Podcast Advertising | $142 | Niche audiences | 4-8 months |
| Email Marketing (Purchased Lists) | $128 | Quick lead generation | 1-2 months |
| Partner/Referral Programs | $87 | Warm introductions | 1-3 months |
| Organic Social Media | $73 | Community building | 6-12 months |
| SEO/Organic Search | $54 | Long-term sustainable growth | 6-18 months |
| Customer Referrals | $31 | Existing customer leverage | Immediate-3 months |
(Source: focus-digital.co)
How to Lower Your Cost Per Lead
1. Abandon buying, start producing
- When you stop buying shared databases, your spending can reduce.
- Make use of AI or simple tools to find leads and fill in valid information.
- Thus, you not only acquire fresh leads but also do not have to pay for inactive emails and duplicate entries.
2. Validate before paying
- If you continue purchasing databases, make sure to check the emails beforehand and get decision-maker contacts as well.
- Using generic addresses like info@ or old lists can increase ineffective outreach by as much as 30% to 50%.
3. Opt for cheap flat-fee products
- By using lead generation services with a fixed subscription fee of a few hundred dollars a month (for example, $300-$800 for 300 leads), you will be able to set the maximum cost per lead and be sure about your monthly budget.
- This differs from cost-per-lead services where you pay depending on your actual leads.
Conclusion
CPL changes a lot based on the firm size, the industry, the channel used, lead quality, and a blended view that includes both CPL and later conversion is often more helpful than looking at the first cost only. Enterprise CPQL runs about $628, compared with startups at closer to $58, while Customer referrals and SEO also tend to show some of the smallest CPQL numbers on the list.
For B2B SaaS, qualified leads can land around $150 to $250, which shows how cheap contacts can differ from leads that actually fit. Effective CPL management therefore combines tighter targeting, quick routing, work on conversion, lead checks, organic growth, and solid tracking for qualified-lead results.
FAQ
CPL is found by taking total marketing plus sales spend and dividing it by the number of leads produced.
Customer referrals, with an average CPQL of $31.
Enterprise firms average about $628 per qualified lead.
Aim for within one hour. Faster outreach makes it nearly 7× more likely to qualify than waiting longer.
Forms with three fields get about 23.1% completion. Seven-field forms come in at 11.4%. Forms with 10+ fields are about 6.9%.