








First Glance
Air Quality Apps Statistics: Most of us check the weather before we leave the house. Fewer people check the air, even though it can matter just as much. Air quality apps are starting to close that gap, pulling together satellite imagery, ground sensors, and weather data to show pollution levels, health risk, and forecasts for the hours ahead, often down to a specific street rather than just a citywide average. AI is behind much of this shift, turning sparse, patchy sensor networks into detailed, block-by-block pollution maps and spotting patterns humans would miss, like a wildfire’s smoke plume or a traffic-driven spike in exhaust.
Companies like Google, IQAir, and Clarity Movement are folding these predictions into navigation, weather, and health tools, so a forecast isn’t just a number anymore; it’s a nudge to open a window, grab a mask, or just breathe a little easier. Here’s a closer look at where air quality apps stand today.
Best in the Editor’s Eye
- The global air-quality apps market is valued at USD 209.1 million in 2024, projected to reach USD 598.7 million by 2033.
- AirVisual surpassed 5 million Google Play downloads, covering over 500,000 locations by September 2026.
- 69% of 2,740 surveyed AirForU users adopted protective actions after using the app.
- Google’s air-quality platform processes over 50 million daily updates across 500-by-500-meter grids.
- Corrected PurpleAir sensor readings identified the correct AQI category 94% of the time.
- IQAir AirVisual leads Google Play with 5 million+ downloads and a 4.7 rating.
- On the App Store, IQAir AirVisual leads with 45,000 ratings and a 4.8 score.
- Canada’s WeatherCAN leads national apps with over 1 million downloads and 10,000+ locations.
Recent Developments in Air Quality Apps
- In September 2025, on CPCB’s 51st anniversary, India launched SAMEER 2.0 for Android and iOS with personalized alerts and location services.
- In April 2025, Air Aware Labs launched AirTrack with 500-by-500-meter data, personalized exposure tracking, and planned lower-pollution route recommendations.
- In February 2025, IQAir launched Schools4Earth through its app, targeting 1 million schools, over 7 billion people, and a 15% monitor discount.
- In January 2025, Airly launched AI-powered Fact Sheets, automatically generating customizable air-quality reports and updating shareable PDFs weekly.
- In June 2026, WHO updated its interactive Ambient Air Quality Database to Version 8.0, providing refreshed global monitoring data.
- In August 2026, the UK launched localized SMS and email air-quality alerts covering 5 pollutants: PM2.5, PM10, NO2, O3, and SO2.
- In July 2026, Delhi launched Dust Portal 2.0 for sites of at least 500 square meters, integrating 360-degree cameras, PM2.5, PM10, and 3 alerts.
- In October 2026, EPA rolled out an updated AirData app for downloading, mapping, and visualizing readings across 7 federally regulated outdoor pollutants.
Global Air Quality Apps Market Stats
(Source: market.us)
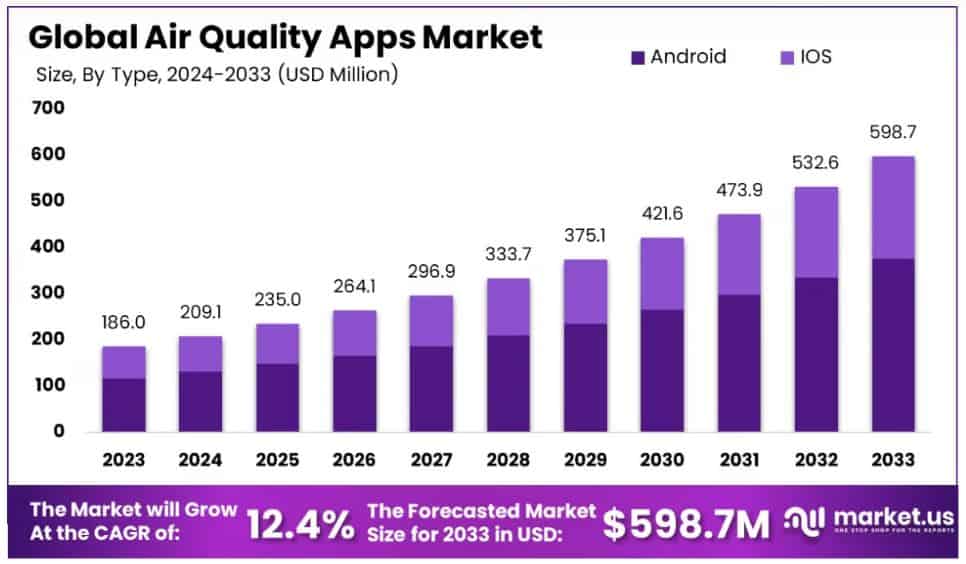
- The global air-quality apps market was valued at USD 186.0 million in 2023 and USD 209.1 million in 2024.
- The market could reach USD 473.9 million in 2031, USD 532.6 million in 2032, and USD 598.7 million by 2033.
- Overall, the market is forecast to grow at a 12.4% CAGR, supported by demand for Android and iOS air-quality applications.
Air Quality Apps Users Insights
- AirVisual crossed 5 million Google Play downloads and covered more than 500,000 locations by September 2026.
- The app combines data from over 80,000 sensors, providing users with real-time, historical, and forecast pollution readings.
- AirNow users can save up to 10 locations and receive next-day AQI forecast notifications.
- AirNow publishes next-day air-quality forecasts for over 400 U.S. cities daily by 4:30 p.m.
- In 2025, reported findings show that 69% of 2,740 AirForU users adopted protective actions after using the app.
- 58% learned new health information, while AQI knowledge increased from 10% at entry to 70% at exit.
- Notifications generated 2–3 additional weekly visits, although engagement fell 90% approximately 3 months after registration.
- During high pollution, 21.7% avoided outdoor exercise, while 20.2% closed their windows.
| Finding | Figure(s) |
| AirVisual downloads and locations covered, by September 2026 | 5+ million downloads; 500,000+ locations |
| Sensors feeding AirVisual’s real-time and forecast readings | 80,000+ sensors |
| Locations AirNow users can save for alerts | up to 10 |
| U.S. cities AirNow forecasts daily by 4:30 p.m. | 400+ cities |
| AirForU users who took protective action | 69% of 2,740 users |
| AirForU users who learned new health info | 58% |
How Air Quality Apps Improve Accuracy
- Google combines reference stations, sensors, satellites, traffic, weather, and models across 500-by-500-meter grids in 100+ countries.
- Its platform processes 50 million+ daily updates, provides 4-day forecasts, and retains 30 days of hourly history.
- AirNow receives hourly measurements from 2,500+ monitors managed by over 150 government agencies.
- EPA tested PurpleAir sensors at 70+ locations with 30+ agencies before developing accuracy corrections.
- Corrected PurpleAir readings identified the correct NowCast AQI category 94% of the time.
- 12 of 13 ambient sensors met EPA targets, while only 5 of 15 smoke-affected sensors met 1-hour targets.
- Corrected readings maintained bias within 10% across AQI thresholds through PM2.5 concentrations of 500 micrograms per cubic meter.
- Above 600 micrograms per cubic meter, corrected PurpleAir readings underestimated PM2.5 by approximately 20%.
- AirNow’s NowCast analyzes the previous 12 hours and requires valid data from 2 of the latest 3 hours.
- AirVisual requires sensors to operate consistently for at least 3 days and publish readings at least hourly.
- AirNow updates files twice hourly, at 25 and 55 minutes, while revising the preceding 48 hours for completeness.
Leading Air Quality Apps on Google Play
- IQAir AirVisual leads with 5 million+ downloads, a 4.7 rating, and 342,000 reviews.
- Air Matters records 500,000+ downloads, a 4.0 rating, and 4,630 reviews.
- Airly has 500,000+ downloads, a 3.6 rating, and 6,940 reviews.
- EPA’s AirNow reports 500,000+ downloads, a 3.5 rating, and 982 reviews.
- AQI by Purelogic Labs has 500,000+ downloads, a 3.0 rating, and 1,320 reviews.
- Plume Labs has 500,000+ downloads, a 2.8 rating, and 12,800 reviews.
- Air4Thai records 500,000+ downloads, a 1.3 rating, and 2,350 reviews.
- AirCare has 100,000+ downloads, a 4.0 rating, and 9,270 reviews.
- Sameer records 100,000+ downloads and a 3.8 rating on Google Play.
- Air Quality Widget has 50,000+ downloads, a 4.2 rating, and 1,740 reviews.
| App | Downloads | Rating | Reviews |
| IQAir AirVisual | 5 million+ | 4.7 | 342,000 |
| Air Matters | 500,000+ | 4.0 | 4,630 |
| Airly | 500,000+ | 3.6 | 6,940 |
| EPA’s AirNow | 500,000+ | 3.5 | 982 |
| AQI by Purelogic Labs | 500,000+ | 3.0 | 1,320 |
| Plume Labs | 500,000+ | 2.8 | 12,800 |
| Air4Thai | 500,000+ | 1.3 | 2,350 |
| AirCare | 100,000+ | 4.0 | 9,270 |
| Sameer | 100,000+ | 3.8 | — |
| Air Quality Widget | 50,000+ | 4.2 | 1,740 |
Leading Air Quality Apps on Apple App Store
- IQAir AirVisual leads with 45,000 ratings and a 4.8 score.
- Plume Labs ranks second with 9,700 ratings and a 4.7 score.
- AirCare ranks third with 3,200 ratings and a 4.8 score.
- My AQI ranks fourth with 2,600 ratings and a 4.7 score.
- Air Matters ranks fifth with 2,500 ratings and a 4.6 score.
- EPA AirNow ranks sixth with 578 ratings and a 3.2 score.
- Airly ranks seventh with 415 ratings and a 4.7 score.
- Klarify ranks eighth with 171 ratings and a 4.5 score.
- Pure Air by Rowenta ranks ninth with 69 ratings and a 4.5 score.
- Flow ranks tenth with 27 ratings and a 2.5 score.
| App | Ratings | Score |
| IQAir AirVisual | 45,000 | 4.8 |
| Plume Labs | 9,700 | 4.7 |
| AirCare | 3,200 | 4.8 |
| My AQI | 2,600 | 4.7 |
| Air Matters | 2,500 | 4.6 |
| EPA AirNow | 578 | 3.2 |
| Airly | 415 | 4.7 |
| Klarify | 171 | 4.5 |
| Pure Air by Rowenta | 69 | 4.5 |
| Flow | 27 | 2.5 |
Leading Countries Using Air Quality Apps
- Canada’s WeatherCAN has 1 million+ downloads, covering 10,000+ locations with 24-hour and 7-day forecasts.
- Thailand’s Air4Thai has 500,000+ downloads and provides hourly and daily government-monitored readings.
- Singapore’s myENV has 500,000+ downloads and delivers PSI and hourly PM2.5 updates.
- The United States’ EPA AirNow has 500,000+ downloads and provides ozone and PM2.5 forecasts.
- India’s Sameer has 100,000+ downloads, 1,700 reviews, and a 3.8 rating.
- Germany’s Luftqualität has 100,000+ downloads and provides hourly readings from 400+ monitoring stations.
- Hong Kong’s AQHI has 10,000+ downloads, using 15 general and 3 roadside stations with 24-hour trends.
- Australia’s AirRater has 10,000+ downloads; its 2020 report documented 55,000 users nationwide.
| Country / Region | App | Downloads |
| Canada | WeatherCAN | 1 million+ |
| Thailand | Air4Thai | 500,000+ |
| Singapore | myENV | 500,000+ |
| United States | EPA AirNow | 500,000+ |
| India | Sameer | 100,000+ |
| Germany | Luftqualität | 100,000+ |
| Hong Kong | AQHI | 10,000+ |
| Australia | AirRater | 10,000+ |
How Indonesian Wildfires Affect Singapore Air Quality
- On October 9, 2026, Indonesia recorded 387 hotspots, down 67% from 1,176 the day earlier.
- Six priority provinces reported 268 hotspots, falling from 543 the previous day.
- South Sumatra had 130 hotspots, Central Kalimantan 86, South Kalimantan 37, West Kalimantan 12, Jambi 3, and Riau 0.
- On October 11, satellites detected 212 hotspots in Kalimantan and 16 in Sumatra.
- Indonesia recorded over 170,000 respiratory infections, including 40,000 children, between August and mid-September 2026.
- At 6 a.m. on October 12, Singapore’s regional 24-hour PSI readings ranged from 105 to 148.
- Singapore recorded PSI levels of 105 north, 118 south, 137 east, 147 west, and 148 central.
- Singapore’s 5 regions remained unhealthy, as the official unhealthy PSI range is 101–200.
- One-hour PM2.5 measured 57 north, 77 south, 75 east, 94 west, and 84 central micrograms per cubic meter.
Conclusion
Air quality apps used to just show a basic AQI number, but now they use AI to give detailed, local forecasts by combining sensors, satellites, and weather data to warn people before pollution gets bad. The data shows that this actually changes how people act, with more people taking steps to protect themselves and understanding AQI better, while ongoing fixes keep making low-cost sensors more reliable. IQAir AirVisual is the top app on both Google Play and the App Store, and countries from Canada to Hong Kong now have their own official air quality apps.
FAQ
Most apps combine data from government monitoring stations, private sensor networks, satellite imagery, and weather models to estimate pollution levels in a given area.
The Air Quality Index, or AQI, is a standardized scale that converts pollutant concentrations into a single number and category, showing how clean or polluted the air is.
Yes, many apps use AI and historical data to forecast air quality hours or days ahead, helping users plan outdoor activities around cleaner air.
Accuracy varies, but AI-powered apps increasingly offer hyperlocal forecasts that account for traffic, weather, and nearby sensors rather than relying on one citywide average.
Yes, most apps track pollutants like PM2.5, PM10, ozone, nitrogen dioxide, and carbon monoxide, since each affects health differently and comes from different sources.
Yes, many apps include pollen counts and personalized health alerts, helping people with asthma, allergies, or other respiratory conditions avoid high-risk days.
Yes, air quality apps are especially useful during wildfires, since they track smoke plumes and PM2.5 spikes and can send alerts before conditions become unhealthy.
Many popular air quality apps offer free access to basic AQI data and forecasts, though some include premium features like extended forecasts or detailed health insights.


