






Opening
Mobile App Industry Statistics: In the past ten years, the mobile app industry statistics have transformed the way businesses operate and how consumers interact with technology. Due to the prevalence of smartphones and mobile devices in our society, the demand for mobile applications has become so high that it can be said to have created a booming business ecosystem, from developers to users. As of 2025, the global mobile app industry market is valued at about USD 613 billion, which indicates its centrality in the digital economy.
It is an industry that serves as a pillar for a modern economy, innovating across the entertainment, finance, health, and education sectors. Various factors, including enhanced technology, internet ubiquity, and dynamic consumer behavior, have propelled changes in mobile applications over time.
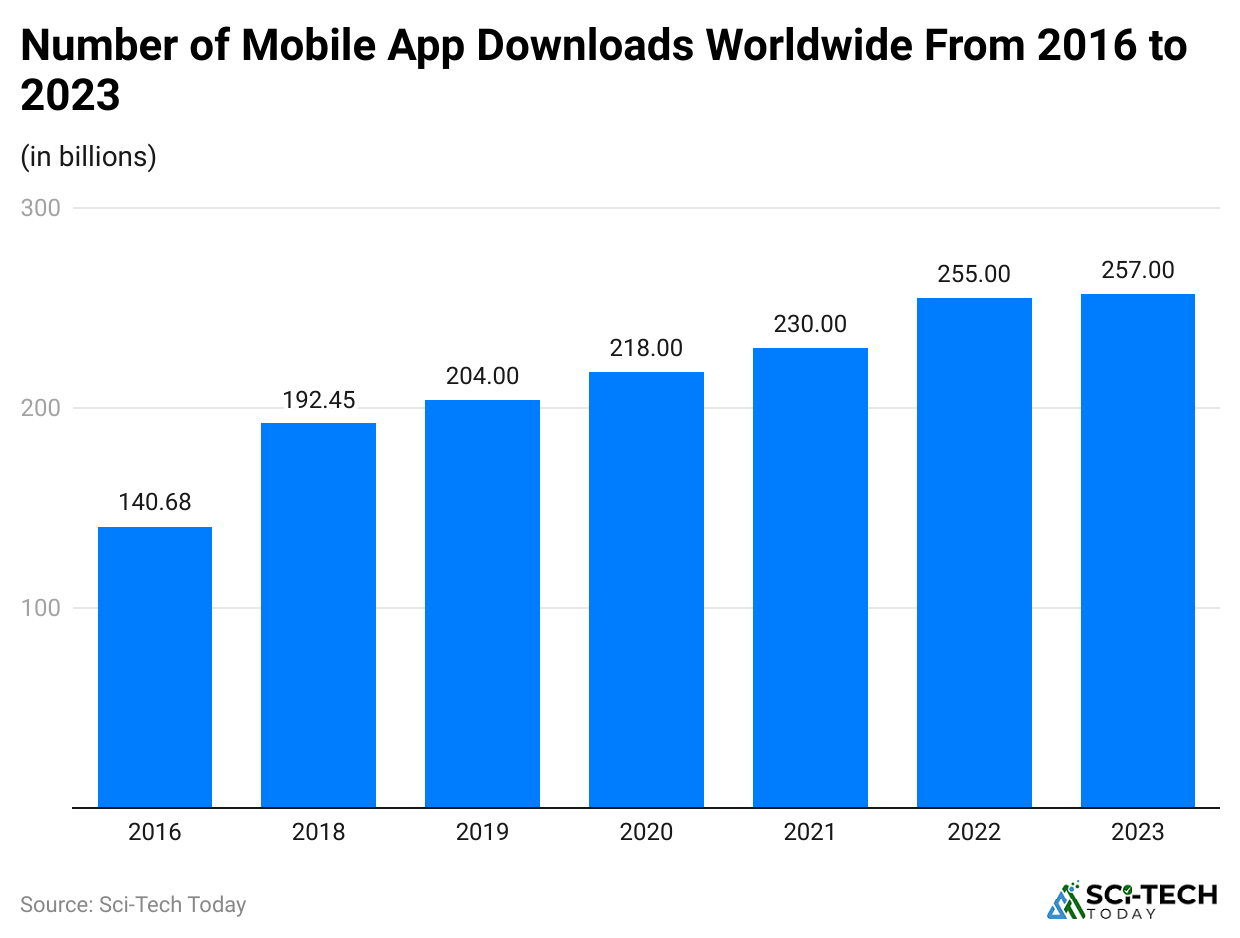
In 2025, approximately 7 billion mobile phone users worldwide downloaded over 218 billion apps (more than). By the end of 2026, this figure will reach around two hundred thirty billion, according to emerging economies and increasing adoption of 5G technology.
Chosen by the Editor
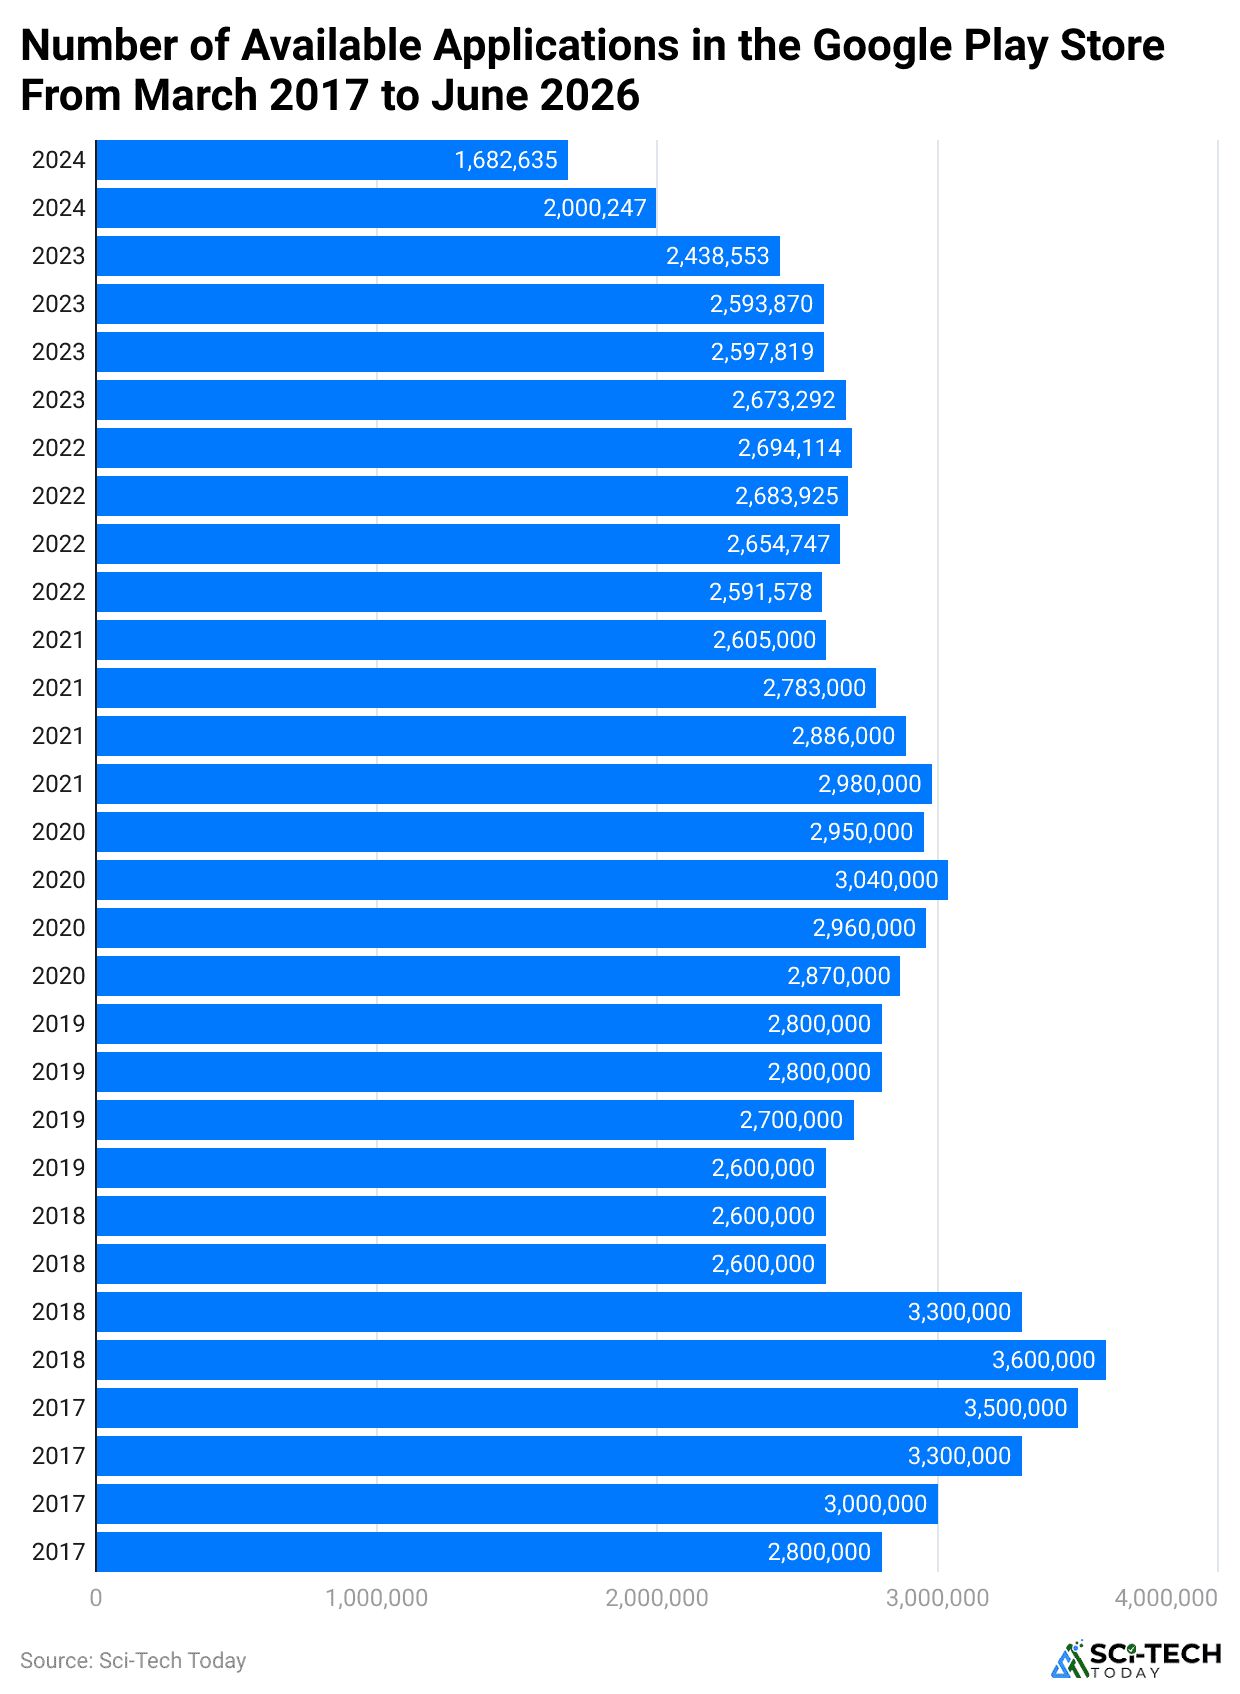
- In the third quarter of 2022, apps were available to Android users via Google Play, making it the largest app store with 3.55 million apps.
- On average, smartphone users launch around ten applications in one day and nearly thirty applications in thirty days.
- Moreover, they use these non-game applications up to 20%, often making 120 sessions per app in a month on average. iOS, on the other hand, had approximately 1.6 million, making it the second-largest Apple store
- Among millennials, 15.21% open the apps more than 50 times within a day, while 16.73% shop through mobile 1-4 times a week.
- For example, Gen Z users spend an average of 4.1 hours per month on non-gaming mobile apps; this is more than that of other generations, with about 10%.
- About 87% of smartphone owners spend most of their time on applications. By 2027, gaming applications are expected to exceed 176.1 billion downloads.
- It has been estimated that by 2025, the total revenue from the mobile app industry statistics market will exceed USD 537 billion.
Mobile App Consumer Worldwide
(Reference: statista.com)
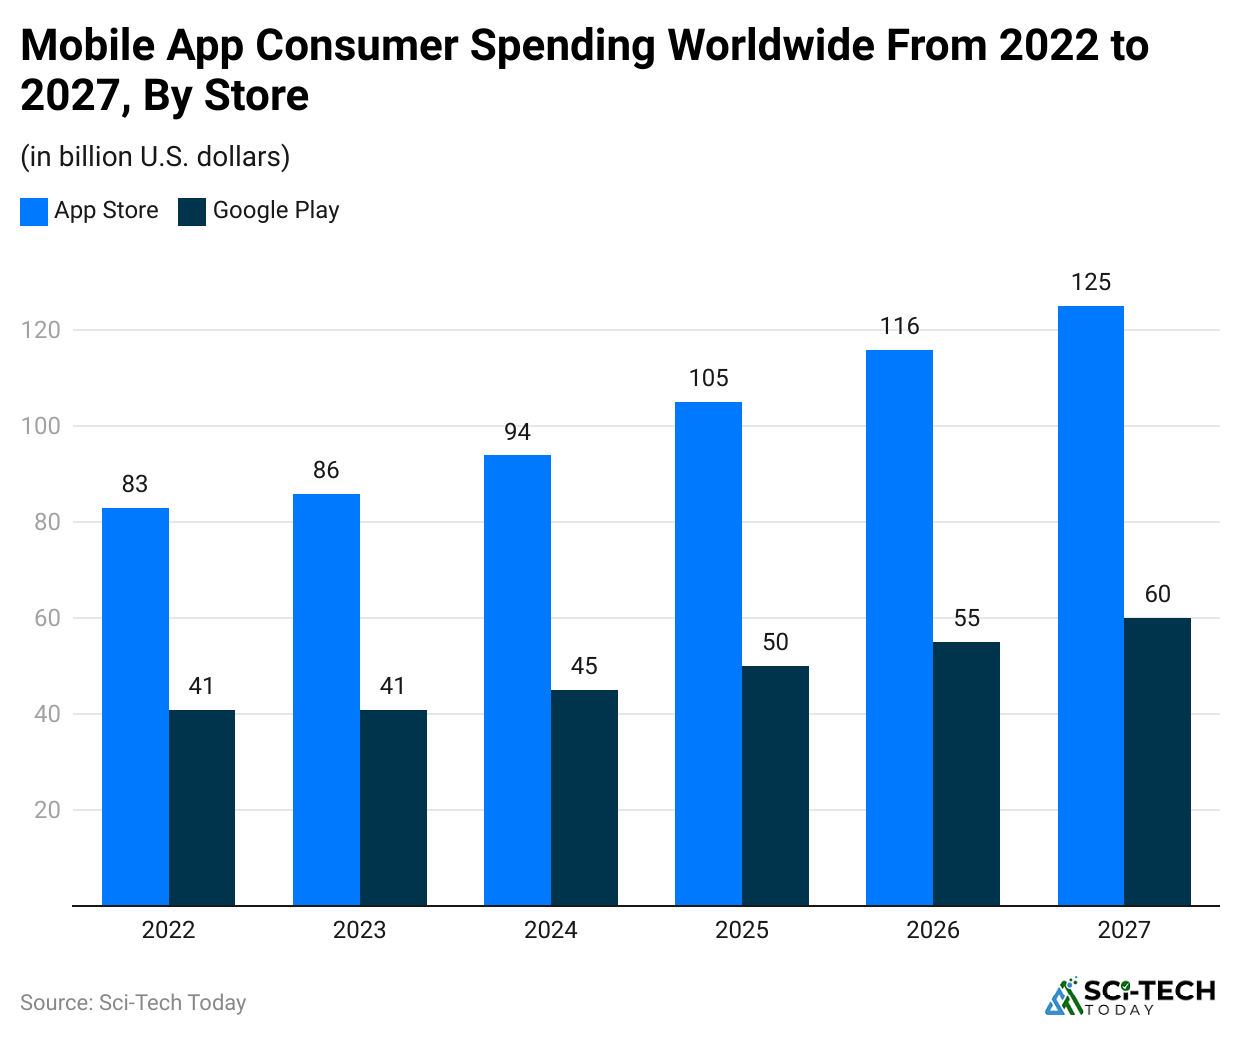
- According to mobile app industry statistics, by the year 2027, people will spend 125 billion United States dollars on mobile apps from the Apple App Store.
- In 2027, total consumer spending on both platforms is projected to be almost 186 billion U.S. dollars, which is an increase of more than 50% compared with the overall customer expenditure in 2022 for both main app stores.
- However, it should be pointed out that app purchasing forecasts for 2023 and 2024 are now much lower than they used to be due to a slowdown in the digital trade’s growth rate.
Worldwide Mobile App Industry
- According to mobile app industry statistics, the global app market is now estimated to generate around USD 537.6 billion in total revenue by 2025.
- An annual growth rate of 7.84% is anticipated here, which will result in USD 781.70 billion market volume estimates by 2029.
- In‑app purchase (IAP) revenues are estimated to reach roughly USD 238 billion in 2025.
- Advertising revenues in the app marketplace are expected to reach about USD 390 billion in 2025.
- The number of downloads for all applications is estimated at 235.30 billion, with an average of USD 1.86 per download for revenue collection purposes alone for the same period.
- It’s worth noting that China still reigns supreme in mobile app revenue, with combined IAP + ad + premium app income estimated well above USD 200 billion in 2025.
Mobile App Downloads Worldwide
(Reference: statista.com)
- By 2025, total global app downloads (all stores, all categories) had climbed back to roughly 218 billion, a mid‑single‑digit increase versus the prior year, even though App Store + Google Play alone saw a slight decline to about 106.9 billion installs.
- As per mobile app industry statistics, by 2025, mobile apps are expected to account for over USD 613 billion through various monetization methods.
- The biggest revenue stream among all app categories still belongs to mobile games.
- By 2025, games still dominated downloads (34.5 billion, about 31% of global installs), but non‑game apps overtook games in consumer spending for the first time, with users spending roughly USD 85.6 billion on non‑gaming apps vs. USD 81.8 billion on games.
- Most applications available in main app stores can be downloaded free of charge, but worldwide expenditure on them is rising; this shows that premium services or quality pay are increasingly popular.
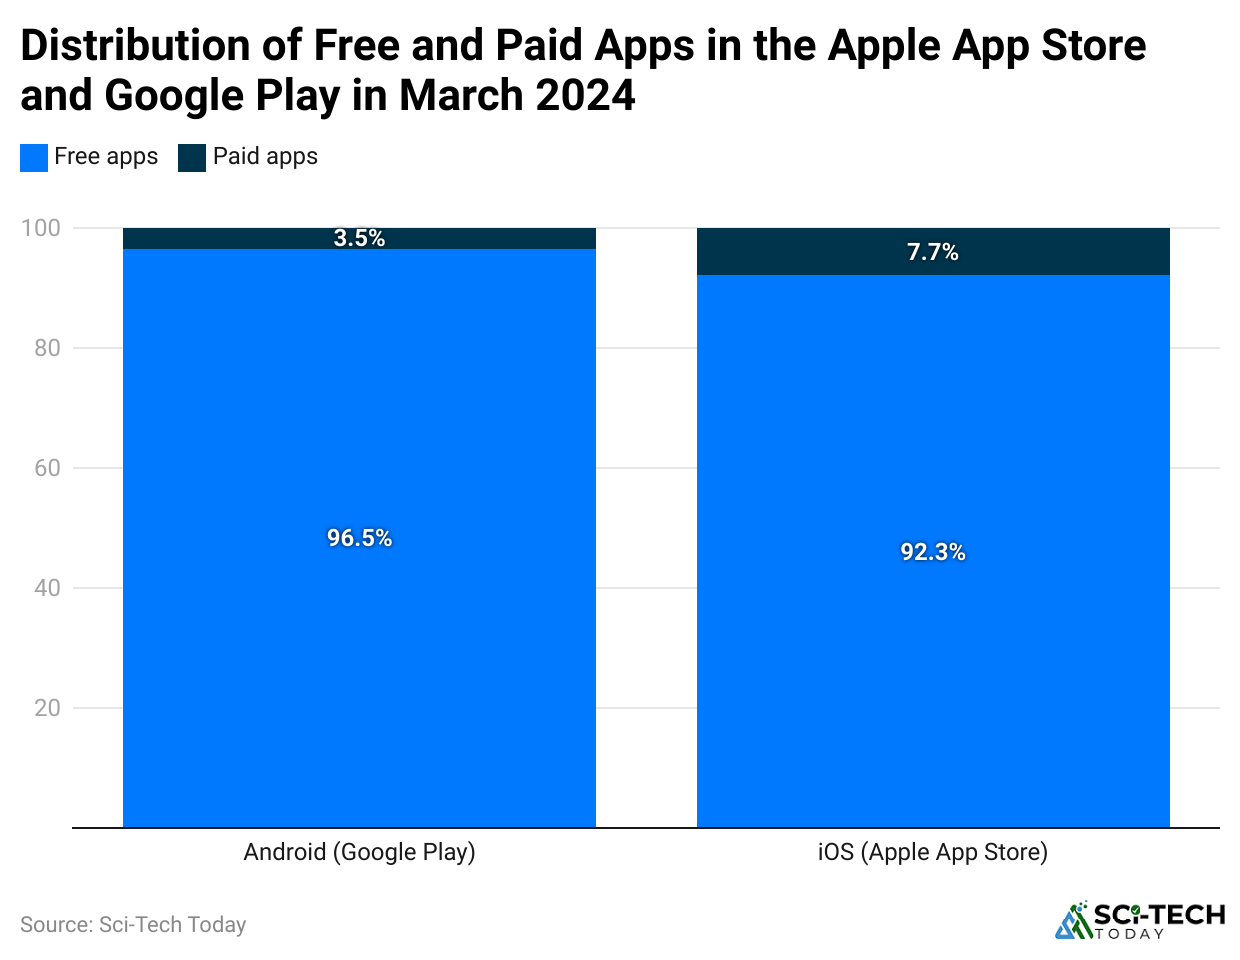
- In 2025, consumer spending on apps and games reached about USD 167 billion (up 11% YoY), while nearly 97% of Google Play apps and over 95% of App Store apps remained free to download, reinforcing the dominance of freemium and subscription monetization.
- By 2025, average annual spend per mobile device had risen again, contributing to global app consumer outlays of roughly USD 167 billion, with mobile users spending a combined 4.2 trillion hours in apps that year.
- By 2025, top‑tier subscription apps had scaled far beyond that: the top 10% of subscription apps captured about 94.5% of all subscription revenue, with leading individual apps generating well into the hundreds of millions even billions of dollars in annual recurring revenue.
Smartphone Users Worldwide
(Reference: statista.com)
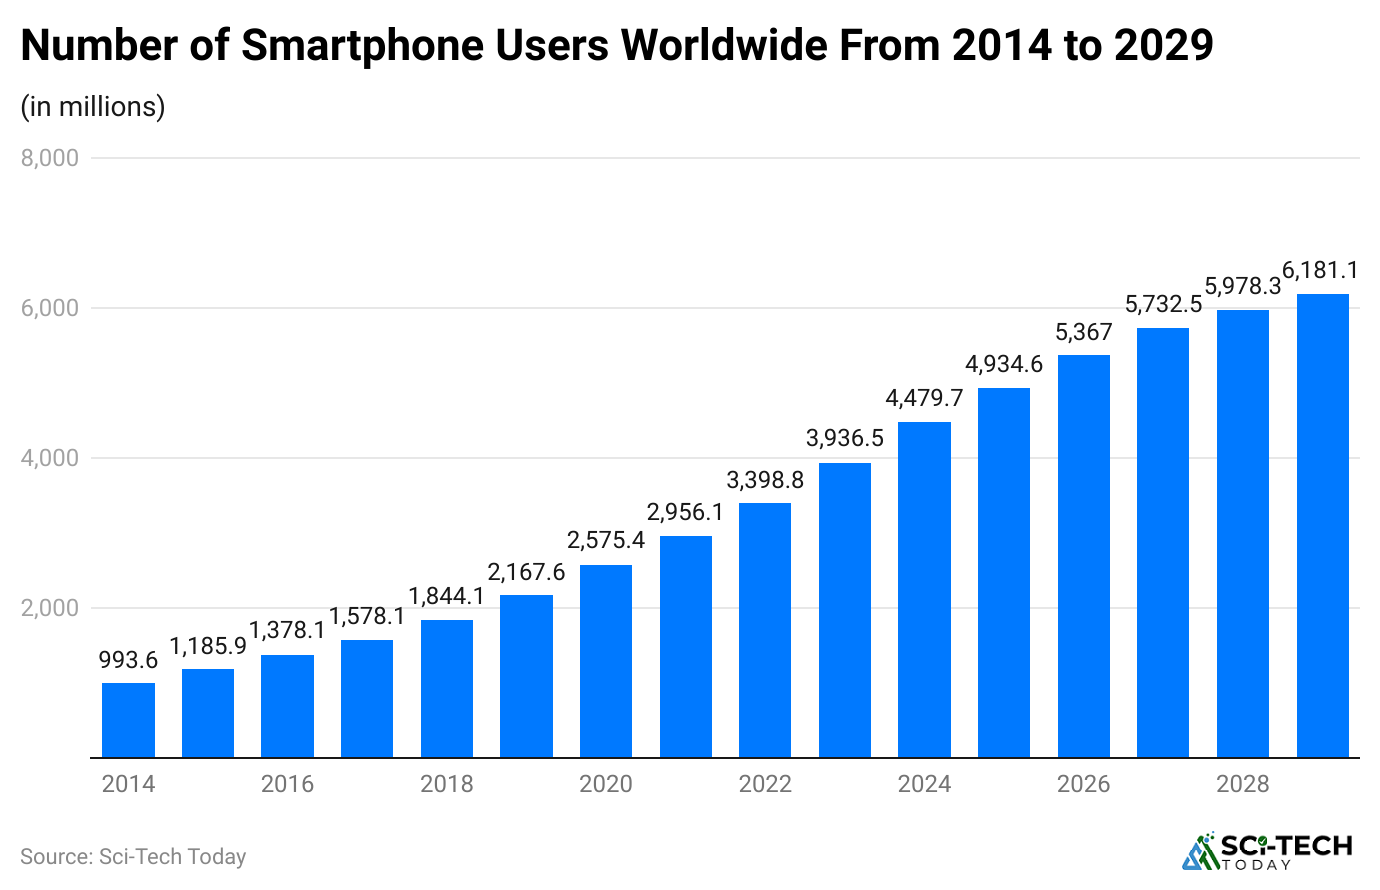
- There were roughly 5 million smartphones worldwide last year, demonstrating that smartphone ownership will likely continue growing gradually.
- Between 2024 and 2029, the expected increment would stand at 1.7 billion users (+37.98% ).
- At the end of fifteen years, in the year 2029, it is expected that there will be 6.2 billion people using these devices. In some places in the world, it has already become common for there to be more than one phone per individual.
- This set of mobile app statistics relates to anyone who uses the Internet via their handheld device or, in more precise terms, their cell phone.
- A cell phone is a portable phone that is also capable of doing other functions like sending messages and carrying out Internet banking.
Smartphone Mobile Network Subscriptions Worldwide
(Reference: statista.com)
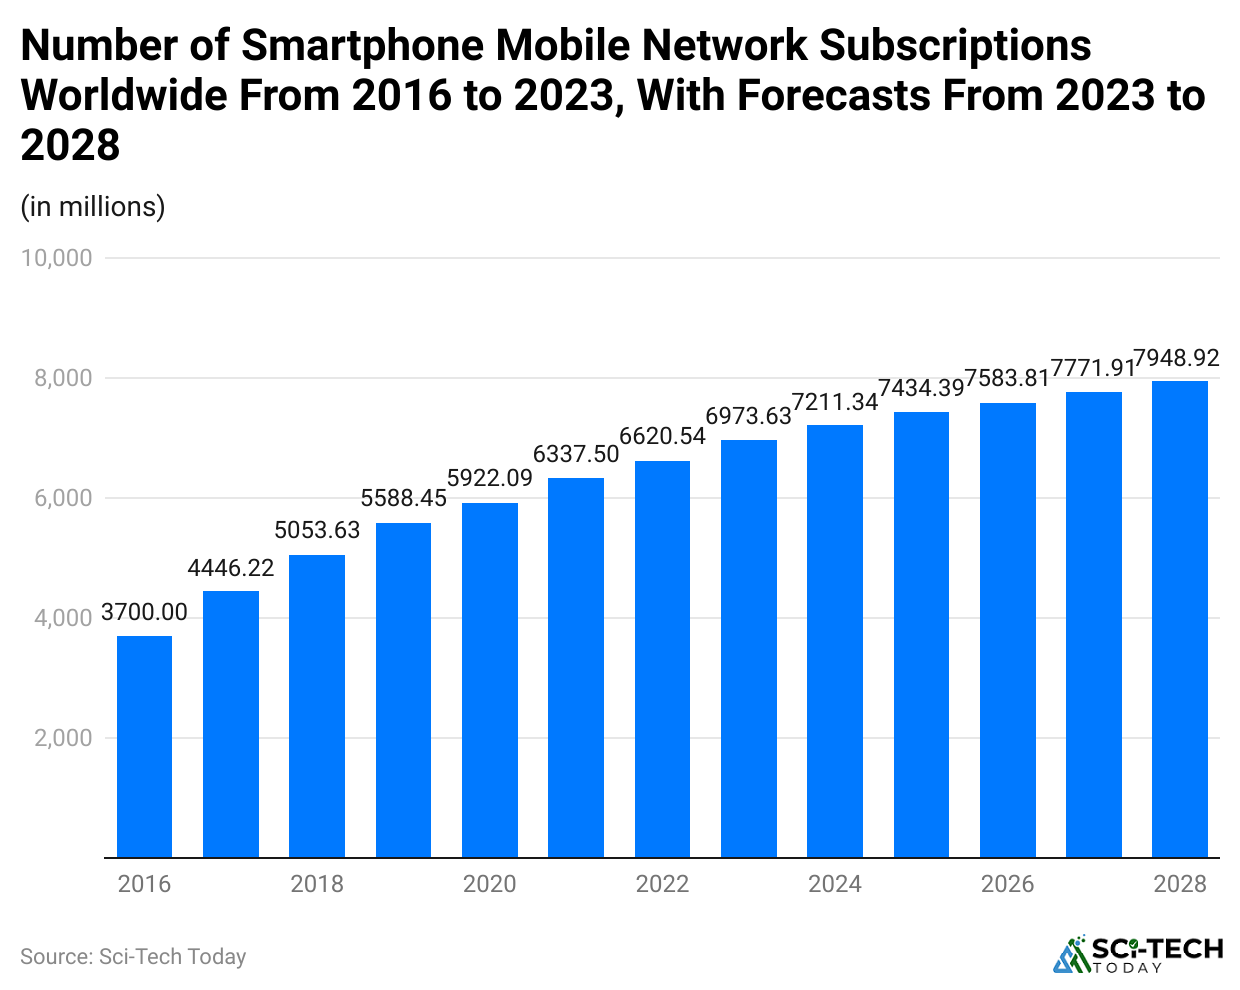
- In 2025, the number of smartphone mobile network subscriptions worldwide had already grown to almost 7.3 billion, on track with the earlier forecast to exceed 7.7 billion by 2028.
- The highest numbers of smartphone mobile subscription networks belong to China, India, and the United States.
- The smartphone market still has significant room for growth, with penetration rates below 70% in many populous markets, especially in China and India.
- According to mobile app industry and market statistics, global revenue from smartphones recovered and grew to about 537.6 billion U.S. dollars in 2025.
- However, stagnant sales are anticipated to be counterbalanced by an increase in the average selling price of smartphones that will eventually support market growth in future years.
- Leading smartphone suppliers, such as Samsung and Apple, account for an estimated 50% of all shipments worldwide.
Leading Mobile Apps
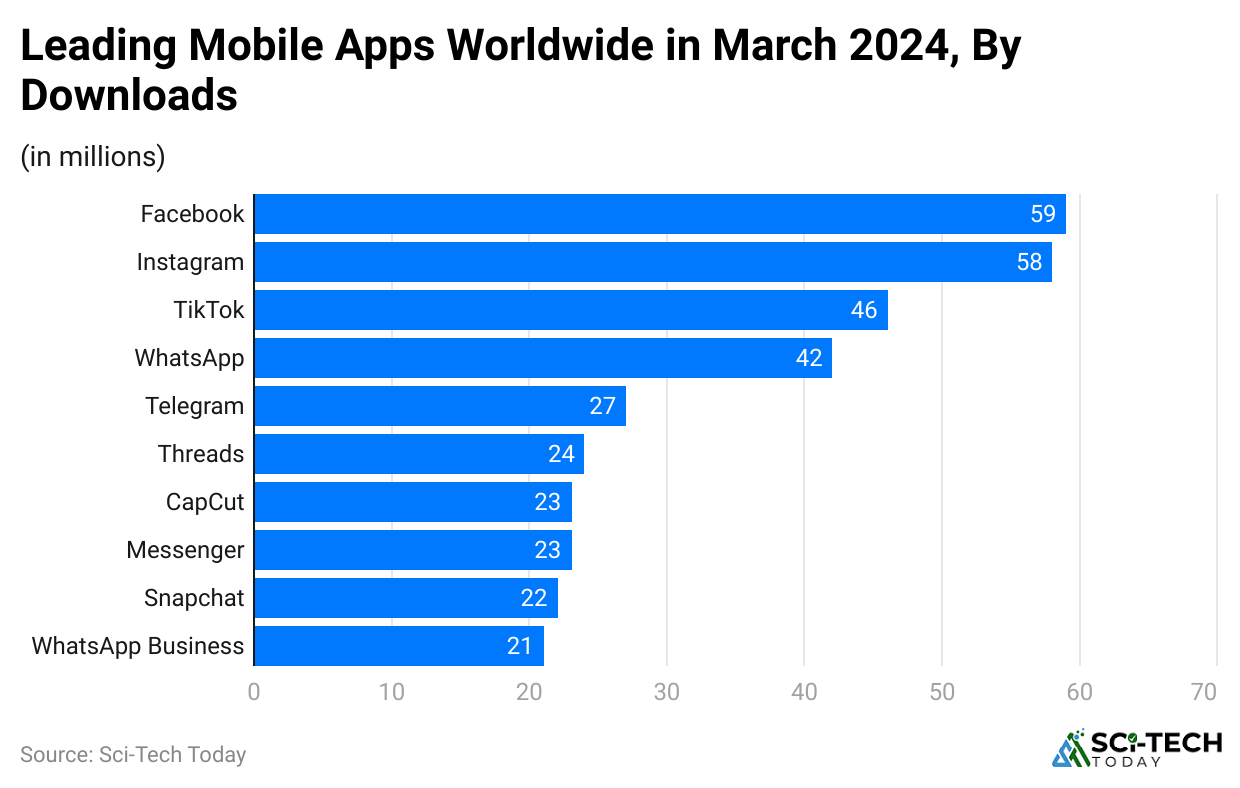
(Reference: statista.com)
- As per mobile app industry statistics, by 2025, ChatGPT became the most downloaded mobile app worldwide with about 835 million downloads across iOS and Android, while Instagram and TikTok followed over 700 million and 610 million downloads, respectively, over the full year.
- Meanwhile, the social video application TikTok was ranked third with 550 million downloads.
- In the last month of the year, 24 million people downloaded Threads, a microblogging platform owned by Meta.
Mobile Application Market Top Players Company Profiles
- Intellect Soft employs 100 people, each earning the company USD 90,800 annually. The company’s highest revenue was still around USD 9.1 million as of 2025.
- Microsoft’s yearly income in 2025 was USD 281,724 billion, a 14.93% increase over 2024, and its annual revenue for 2025 stood at the same amount.
- Alphabet (Google)’s total revenues in 2025 reached USD 402.836 billion, with Google Services and Google Ads (search, network, YouTube) making up the majority of that figure; search ads alone now represent well over USD 150 billion+ annually.
- Based on its twelve‑month summary ending July 31st, 2025, Hewlett Packard Enterprise’s revenues amounted to USD 34,296 billion, resulting in a year‑on‑year growth rate of about 13.9%. Total annual revenue recorded at the end of 2024 was USD 30,127 billion, up 3.4% versus 2023, and the 2025 figure was again “way above” 2024.
- By 2025, HPE’s full‑year revenue had risen to about USD 34.3 billion, up roughly 14% year‑on‑year, with 12‑month revenue over USD 33.1 billion on a July‑end basis.
- Cognizant Technology Solutions’ revenue was USD 21.108 billion for the full year 2025, an increase of 7.0% compared to 2024, following on from USD 19.736 billion in 2024.
- International Business Machines Corporation (IBM) generated revenue of USD 67.5 billion in 2025, with year‑over‑year growth of 8% (6% at constant currency) and free cash flow continuing to improve versus the prior year; this compares to roughly USD 62.7 billion in 2024.
- Broadcom’s revenue during the twelve months up until fiscal year‑end November 2, 2025, stood at USD 63.887 billion, demonstrating year‑on‑year growth of 23.87% from USD 51.574 billion in 2024.
- Verbat’s revenue is at USD 19.8 million as of 2024-2025.
- Netflix’s revenue for the twelve months ending 2025 was about USD 45.2 billion, a 16% increase over 2024’s USD 39.0 billion.
- Apple’s total net sales during its financial year 2025 stood at approximately USD 416.2 billion, a new record high, up about 6.4% from 2024’s USD 391.0 billion.
Mobile App Users by Age
(Source: simform.com)
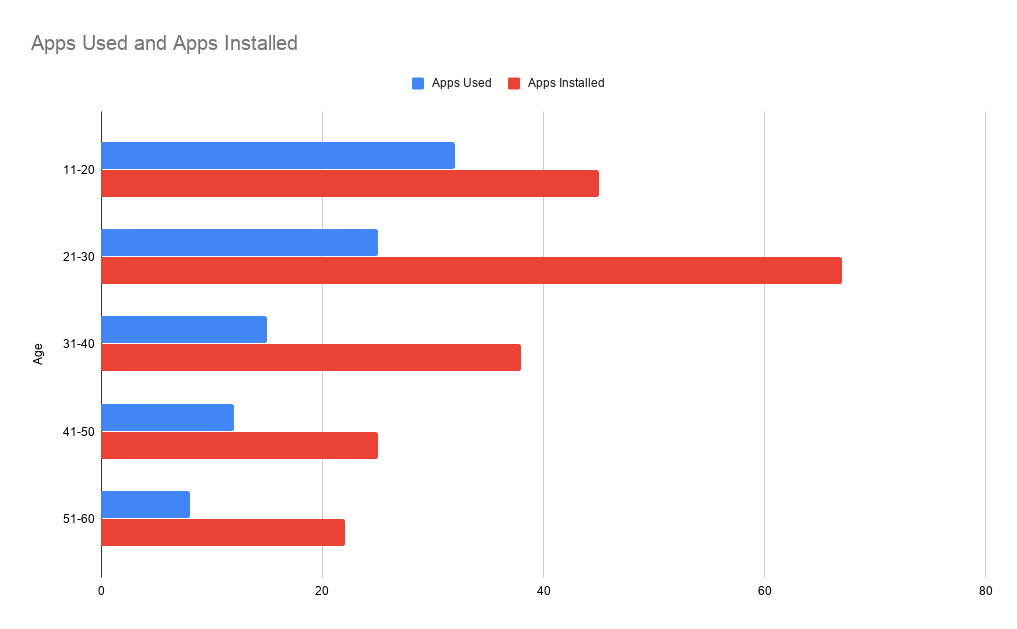
- According to recent mobile app industry statistics, in a month, an average of 112.6 hours is spent by those aged between 18 and 24, while an average of 102.4 hours is spent by people aged 25 to 34.
- Those over 35 spend less than 100 hours using apps a month, while those over 65 use a mere 51.4 hours.
- Compared to other generations, members of Generation Z who were born in the post-nineties spend most of their time online engaging with apps; thus, when they use their favorite applications, they do so 30% more than the average population.
- This group seems to be the most active on social networking applications, with teens (13‐19-year-olds) spending almost equal time as those aged 20-29 years accessing digital apps.
- Sometimes, social networking sites could decrease for people over forty.
- Younger audiences tend to dominate overall activity across all application categories. Comic book-related applications recorded heightened user interactions from individuals aged 18-24 during Q2 2022.
- Android users aged 18-24 accounted for more than half of all downloads in the audio and music category. Approximately 30% of those downloading magazine and news applications are 50-64 years old.
- Users in the 25 to 34-year-old age range made around 22% of downloads for parenting applications.
- An estimated 74% of millennials have confessed to accessing an app when they are bored, which presents a chance for developing captivating materials like video clips or articles that can maintain the interest of people using your application.
Free Vs Paid App Downloads
(Reference: statista.com)
- According to mobile app industry statistics, the Google Play Store has more global downloads than the Apple App Store.
- There was an increase in the percentage of downloads for both stores between 2019 and 2020.
- By 2025, Google Play Store downloads had reached roughly 142.2 billion annual downloads, while the Apple App Store was at about 36.6 to 38 billion, with Google Play still growing faster in volume.
- So, it’s clear that the Google Play Store has more downloads and is also growing faster.
- Google Play’s downloads in 2025 were up around 29%, whereas Apple’s App Store downloads grew closer to 8% over a similar period
- As of January-May 2025, almost 97% of apps on Google Play are free of charge, with about 2.32 million free apps vs. only 60-70 thousand paid apps.
- Google Play Store has always had more free applications as compared to paid ones alongside Apple App Store.
- Paid apps constitute about 18% of all applications, while free ones constitute about 82% of all apps on the Amazon App Store’s Android platform.
Number of Mobile Apps in the Google Play Store
(Reference: statista.com)
- The Google Play Store currently has more than 2.45 million apps as of June 2026, rising to about 2.1 million active apps by mid‑2027.
- By the end of 2026, gaming apps are estimated to contribute roughly 75% of all consumer spending within the Google Play Store’s mobile application ecosystem.
- Nevertheless, as most of these applications are free and hence no money is paid for them, this company has to use a good business model for its revenues to remain stable.
Recent Mobile App Industry Developments
- In January 2025, data from Sensor Tower revealed that global mobile app downloads surpassed 257 billion in 2024, with AI-powered apps, including chatbots and productivity tools, driving a significant portion of new user acquisition.
- In February 2025, Meta announced the integration of its Llama AI models across Instagram and WhatsApp.
- In March 2025, Google rolled out significant updates to Google Play, introducing stricter AI-generated app content policies and enhanced security measures aimed at reducing fraudulent and low-quality apps flooding the marketplace.
- In April 2025, TikTok launched new in-app shopping and AI-driven content recommendation features globally.
- In May 2025, Apple announced major updates to its App Store policies following continued regulatory pressure from the European Union’s Digital Markets Act (DMA), allowing developers in the EU to use third-party payment systems and external app marketplaces with reduced restrictions.
Future Trends and Predictions
- Forthcoming are the mobile app industry statistics, continuous growth, fostered by technological advancements and changing consumers’ tastes.
- The year 2026-27 will definitely see more complicated AI and machine intelligence enhancing the functionalities of applications, apart from providing a personalized experience that is much more advanced than usual.
- The expansion of 5G networks would also facilitate faster download speeds and optimized app performance, thereby facilitating application adoption.
- Another trend you need to watch is the emergence of super apps, which merge several services into one platform. Initially embraced by Asian companies like Tencent and Alibaba, these kinds of applications are likely to gain popularity in other parts of the world. They provide social networking, e-commerce, and financial services in a single, mild-mannered way.
- With increasing concern over privacy and data security, this is also likely to shape how applications are developed by developers and users’ choices when buying them.
- Consequently, applications that strongly emphasize user safety coupled with open data policies will have an advantage over similar products in the marketplace, where there are increasingly recurrent issues surrounding information hacking and the lack of confidentiality principle regulations.
Summary
The field of mobile applications is very innovative and experiences rapid advancements, which allows for growth opportunities and innovation. As per mobile app industry statistics and projections till 2026, it was healthy according to 2025 analysts due to the changes in consumer behaviour and advancement in technology.
Mobile applications would be increasing, providing new ways of engaging with companies and consumers. The future seems bright for the mobile application industry statistics because it will continue growing everywhere in the world.
FAQ
On-demand service and quick commerce apps are currently in high demand globally, led specifically by platforms like DoorDash, Uber, and WhatsApp. These applications dominate daily active usage by offering instant convenience for food, transport, and communication.
The cost to develop a mobile app typically ranges from USD 15,000 for a basic application to over USD 300,000 for a complex, enterprise-grade platform. Most standard business applications with multi-platform support fall somewhere between USD 25,000 and USD 150,000.
A mobile app website is a webpage that acts like an app or promotes a downloadable application. People often use this phrase to mean either a mobile website (a site built for phones) or a mobile web app (a site that runs like an app in a browser).

Sources