





Introduction
Marketing ROI Statistics: Marketing ROI has become a prominent measure for every business in 2026. Companies are following the techniques of marketing ROI to judge business wins. Companies face challenges with tighter budgets, a high cost of each new customer, and ads no longer sitting in one place since the message is spread across many channels, making real marketing gains.
According to WARC, global ad spending around the world is forecast to reach $1.30 trillion in 2026, with a 9.1% increase. The split is not even. For Marketing funding, about 80% of ad dollars go to retail media, paid search, and social platforms. Gartner reports the typical marketing budget equals 7.8% of company revenue, while 15.3% of those budgets go to AI. The goal of marketing is not just to spend more; it is to take the actions that raise extra revenue and extra profit, and the same actions should lift customer lifetime value, which should also support steady growth year to year.
This article will present the core marketing ROI via marketing channels in 2026.
Editor’s Top Picks
- In 2026, global advertising spending is expected to reach $1.30 trillion, up 9.1%.
- Nearly 80% of global ad spend goes to retail media, paid search, and social platforms.
- Marketing budgets average 7.8% of company revenue, with 15.3% allocated to AI.
- AI analytics use rose from 8% in 2021 to 34% in 2026.
- AI analytics users report 27% better campaign ROI and 44% less manual reporting.
- Email marketing posts a benchmark ROI of 36:1 to 42:1. AI-assisted email work reaches 52:1.
- SEO ROI is reported at 748% for B2B and 721% for B2C over three years.
- Influencer marketing shows 206% B2B ROI and 689% B2C ROI, with stronger results in consumer markets.
- Email marketing ranks top in the channel list with a score of 88 out of 100.
- A 60/40 brand-to-performance mix is linked to 34% higher long-term ROI.
- Marketing automation generates an average $5.44 return per $1 invested, which is equivalent to 544% ROI.
- 76% of businesses achieved measurable marketing automation ROI within one year.
- A healthy LTV: CAC benchmark is generally 3:1, while the median for B2B SaaS sits at 3.2:1.
- Only 36% of marketers can measure marketing ROI accurately, while 47% struggle with multi-channel measurement.
- Marketers who measure ROI are 1.6 times more likely to receive higher budgets.
Emerging Marketing Channels Growth Trends
(Source: amraandelma.com)
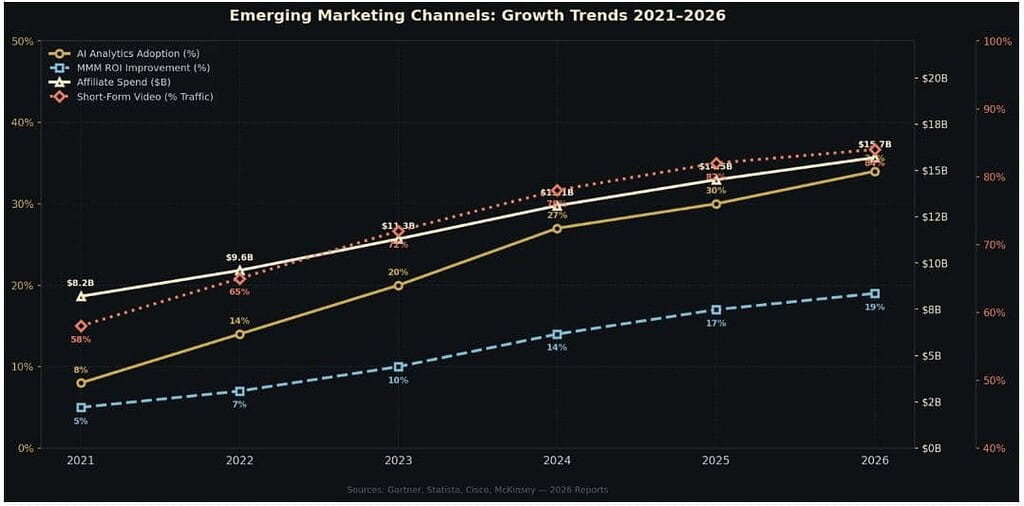
- The chart shows the growth of marketing shifting towards tracked and measured, and AI analytics use grows from 8% to 34% from 2021 to 2026.
- Moreover, gains from marketing-mix-modeling rise from 5% to 19%, while short-form video traffic also keeps rising, going from 58% to 83%.
- Affiliate budgets increase from $8.2 billion to $15.7 billion, which indicates more growth in pay-for-results deals.
- Organizations using AI analytics report an average 27% lift in campaign ROI, and they also say manual reporting time declined by 44%.
- Adoption is highest in retail at 51%, while Financial services reached 47%, and telecommunications follows at 43%.
- A 60/40 brand-to-performance mix delivers 34% higher long-term ROI, while A 70/30 mix in upper-funnel channels cuts customer acquisition costs by 26% over 12 months.
- Spending too much on performance ads can lower long-term ROI by 20% to 50%, while a more even approach can lift returns by 25% to 100%.
- Retail and e-commerce start at a 45:1 ROI, and for 2025 to 2026 the Litmus benchmarks place core email ROI between 36:1 and 42:1.
- AI-assisted email programs reach 52:1, versus 15.5% above 2024, while abandoned-cart messages account for 18% of email revenue, and SMS has 34% more revenue per recipient.
- The above figures imply that the marketing channels are playing a bigger role in measured marketing results generated through AI use, well-balanced media spending, affiliate partnerships, short-form video, and automation in email.
Marketing ROI By Channel Statistics
| Channel | B2B ROI | B2C ROI | Notes |
| SEO (3-year timeline for SEO) | 748% | 721% | SEO has the highest overall ROI of any standard marketing channel, but until after 4-6 months, most of the SEO campaigns do not have substantial returns. |
| SEM/PPC | 36% | 24% | To test new audiences or roll out new products, SEM/PPC is a great tool for short-term campaigns.It is relatively expensive, and results only last as long as you pay for them. |
| Email Marketing | 261% | 298% | Email marketing is low-cost, but it takes time to assemble a quality list of leads. It is extremely effective to nurture leads rather than directly generate them |
| LinkedIn – Paid | 229% | 57% | Social media campaigns see their greatest effect in B2C campaigns across the board, but B2B audiences can utilize business-oriented platforms like LinkedIn to target and foster their audience |
| LinkedIn – Organic | 192% | 88% | |
| Facebook Ads | 87% | 443% | |
| Webinars | 430% | 113% | Webinars require significant investment in quality equipment and expert presenters, but they can generate highly qualified and engaged leads. |
| Influencer Marketing | 206% | 689% | Influencer marketing can be useful in a B2B setting, and it is generally considered a B2C option. |
| Online PR | 62% | 156% | PR work focuses more on repairing or improving public perception of an individual or company, but is usually less focused on ROI. |
(Source: firstpagesage.com)
Composite Marketing Performance By Channels Across ROI
(Source: amraandelma.com)
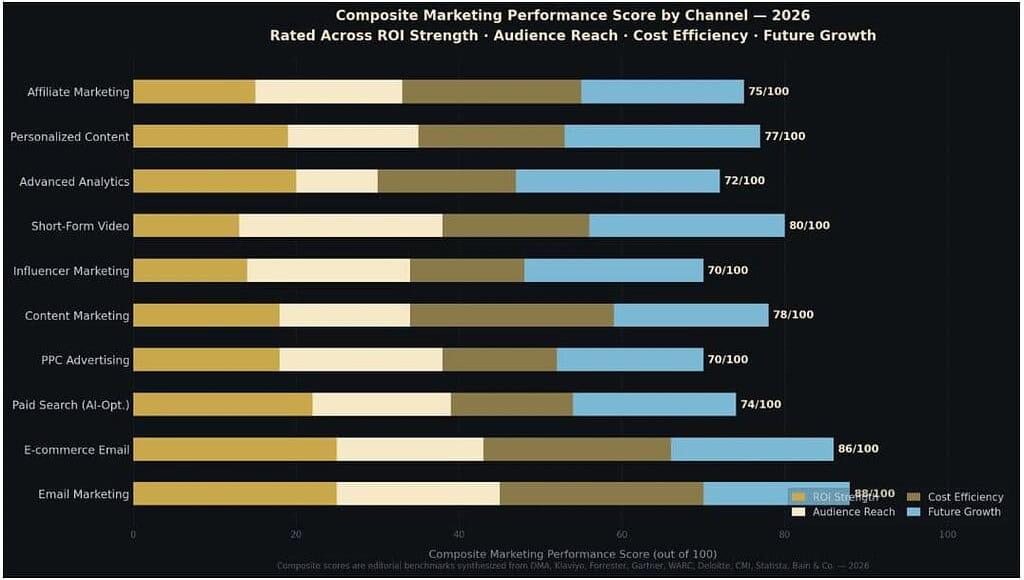
- The chart shows that in 2026, 10 marketing channels are compared on four items: ROI, reach, cost-per-use, and growth ahead. The results indicate that a few channels clearly look stronger overall, but it does not identify a winner in every category.
- Email Marketing takes the top spot with 88 out of 100, while E-commerce Email stays close to the leader, coming in at 86.
- In third place, Short-Form Video comes in at 80, and it appears fairly steady across the same four areas.
- After that, Content Marketing gets 78, Personalized Content is just behind at 77, Affiliate Marketing stands at 75, while Paid Search, labelled AI-Optimized, scores 74.
- The bottom group starts with Advanced Analytics at 72. Influencer Marketing and PPC Advertising tie at 70 each. The spread from 88 down to 70 is 18 points. That range feels limited, so there are multiple workable choices, not just one.
- On the whole, Short-Form Video and content-focused work also hold strong ground, which shows the order supports email-led plans. To match the top channels, Analytics, influencer efforts, and PPC will likely need tighter setup.
Marketing ROI Benchmarks Statistics
- ROI measurement and growth really depend a lot on brand strength, like how each channel performs, and how long it influences customers in their decision-making.
- When brand awareness rises by 1%, sales move up by about 0.6% over time, and by 0.4% in the near term. This growth suggests brand work not only pays later, but it can also help right away.
- Retail media delivers results that are about 1.8 times better than digital ads, and it shows close to 3 times stronger purchase behavior.
- In B2B, most of the work happens before a lead ever reaches the sales team, which shows the path to a deal is shifting earlier.
- Moreover, 81% of the B2B journey takes place before the lead enters the pipeline, not 70% as in the past.
- Looking at money spent, longer-term effects are counted, which climb to £4.11 per £1, and the short-term profit averages £1.87 for every £1 invested.
- Paid B2B channels such as LinkedIn posts deliver 121% ROAS, Google Search sits at 67%, and Meta comes in at 51%, while top-performing LinkedIn campaigns are generating 279% ROAS.
- The B2B average journey lasts 272 days and includes 88 touchpoints across four channels, which shows the cycle is also getting more drawn out and involves 10 stakeholders per deal, compared with 211 days and 76 touchpoints a year earlier.
- All these numbers point toward the fact that these figures favor a long-term approach more than using a multi-channel plan that lasts, instead of focusing only on quick returns.
Customer Behavior and Loyalty Statistics
- Customer Behavior and Loyalty are becoming a core segment for creating customer goodwill, brand competition, and brand pricing to shape what buyers choose each time.
- In Salesforce’s State of Sales, marketplace competition is 57%, which is higher than last year, and it adds stress on brands that want to keep customers.
- Forrester Consumer Research lists price sensitivity as one of the top five reasons adults in the US, UK, and Australia try a new brand online.
- Salesforce’s State of the Connected Customer report says 65% of customers stopped buying from a brand due to high prices.
- The Connected Shoppers Report, 6th Edition report shows that 74% of shoppers will walk away after three or fewer bad experiences, and it also notes that 74% changed brands during the last year.
- Loyalty programs are common, as 77% of shoppers say they are part of at least one loyalty program and 35% say they belong to a program they never use.
- Forrester’s 2025 B2C CX Predictions also forecast that by 2025, brand loyalty will drop by 25%, even though loyalty-program participation grows.
- The above numbers show that brands need fair and competitive prices, dependable customer experiences, and loyalty perks that feel useful, or relationships will fade.
Marketing Technology and Data Management Statistics
- Marketing technology data shows that many companies are using marketing tools for clean and integrated data.
- In Salesforce’s State of Sales report, 98% of sales leaders express that reliable data matters more when things change, which indicates why accurate information is becoming a key input for marketing and sales calls.
- Salesforce’s State of Marketing report states that about 88% of marketers say they use analytics and measurement tools.
- Another 86% say they use CRM systems to handle customer data, and 84% of teams also lean on first-party data.
- Even with all that adoption shows that only 31% of marketers are fully satisfied with how well they can combine their data.
- In Forrester’s Q3 2024 B2C Marketing CMO Pulse Survey, 78% of marketing leaders said their marketing and loyalty systems are split up.
- In Forrester’s 2025 B2C CX Predictions, the firm says spending to bring loyalty and marketing stacks together will triple.
- Moreover, Statista data shows marketing budgets as a share of company revenue moved from 2014 through 2024.
- Taken together, the numbers suggest that connecting existing tools and improving data quality may be as important as adopting new technology.
Google Ads Benchmarks By Industry (2026)
| Industry | Average Click-Through Rate (%) | Average Cost Per Click ($) | Average Cost Per Lead ($) |
| Air Conditioning Services | 3.11% | $8.94 | $55.15 |
| Air Conditioning Sales | 3.28% | $6.62 | $50.91 |
| Heating & Furnaces | 3.05% | $7.92 | $62.18 |
| Plumbing | 2.87% | $8.67 | $48.91 |
| Roofing & Gutters | 3.02% | $9.03 | $101.49 |
| Pest & Rodent Control | 4.31% | $6.55 | $39.25 |
| Landscaping | 4.52% | $4.10 | $38.47 |
| Pools & Spas | 5.71% | $2.94 | $29.08 |
(Source: ivanvislavskiy.com)
Content Marketing Formats With Highest ROI
(Source: ivanvislavskiy.com)
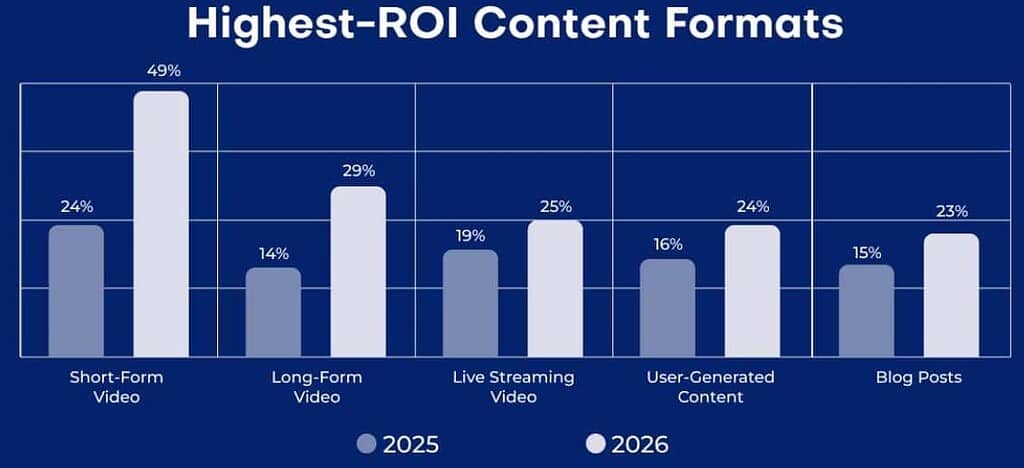
- In Content marketing leans on video has become the strongest content format for contractor marketing.
- HubSpot’s 2026 figures say 49% of marketers put short-form video near the top for return on investment, long-form video comes next at 29%, and livestreaming stands at 25%.
- Contractors can take advantage of what is actually happening on the job, share real progress, highlight finished work, share basic maintenance tips, and provide a visual format of the job site.
- Short clips tend to capture attention fast, while longer pieces give room for more steps and added context.
- The above numbers suggest that using video in a mix instead of leaning on text alone, and that mix can help contractors show their know-how and keep viewers more involved.
AI Marketing ROI and 2026 Budget Priorities
- The 2025 figures suggest that AI is shifting from experimentation towards making up a meaningful larger part of marketing spending.
- AI tools make up 28% of the average martech budget, and 64% of CMOs say they raised AI spend in 2024.
- Global spending for sales and marketing tied to AI hit $57.99 billion, and in the survey results, 75% of companies put at least $1 million into AI.
- The broader martech space is expected to go past $215 billion by 2027, with a growth rate of 13.3% each year, while during 2024, U.S. companies invested $109.1 billion in AI.
- Marketing automation gives a clear picture of where money goes, and businesses saw an average $5.44 return for each $1 spent over three years, equal to a 544% return, while recovering initial costs in less than six months.
- Salesforce reported a 25% lift in marketing ROI, and the automation also pushed revenue to increase by about 34% for the average company.
- On top of that, 76% of businesses reported ROI attained within one year.
- For 2026, spending may keep rising, and people need better results and more confidence in using marketing tools.
- In Europe, 72% of CMOs say they will lift budgets, while teams that already use AI in sales and marketing report about 10% to 20% more ROI.
- In that group, 57% of marketing teams at companies with 1,000+ employees use AI a lot, and in smaller companies, it sits at 40%.
- Looking at 2025 overall, 60% of businesses raised their AI budgets while 72% of consumers say AI can put out wrong facts.
- Gartner report says that 20% of brands may stand out by not using AI by 2027.
LTV and CAC, and Why The Ratio Matters
- LTV is often a better lens for long-term growth than just tracking spend on getting new customers.
- A common yardstick is 3:1, while Stripe frames it like this: 1:1 means break-even, 2:1 means early sustainability, 3:1 means stable, and 4:1 and above points to very strong efficiency.
- Optifai looked at 939 B2B SaaS firms and found a median of 3.2:1, while SaaSHero reports the same median at 3.2:1. It also reports that 3:1 to 5:1 is healthy, and that 5:1+ shows usage of capital looks strong.
- First Page Sage lists 4:1 for B2B SaaS, which shows 2.5:1 for B2C SaaS.
- Chargebee reports that for ecommerce, it is 3:1, which comes from $252 LTV and B2B SaaS 4:1 based on $84 CAC.
- According to Bessemer Venture Partners, an indicator that ratios past 6:1 can hint at underinvestment in customer acquisition.
- Benchmarkit’s 2025 figures show the SaaS median at 18 months, and this is a jump from 14 months. Payback varies a lot by deal size, and for deals under $5,000 ACV, it is often around 8 months, and for deals above $50,000 ACV, it is about 22 to 24 months.
- SaaS reports show that a wider median view is 6.8 months, including B2C apps, which land at 4.2 months, and B2B SaaS lands at 8.6 months.
- In general, teams often call anything under 12 months healthy, and many believe that it also treats 6 months or less as top-tier performance.
- Growth in customer acquisition should only happen when retention can hold up, as we look the LTV, CAC, payback, churn, gross margin, and NRR should be looked at as a group.
- To support sustainable ROI, Money spent on onboarding, customer success, product work, and loyalty helps the unit economics.
Marketing ROI Measurement Challenge
- The main problem with Marketing ROI is hard to measure in practice, but it is not the lack of benchmarks.
- Only 36% of marketers say they can measure ROI accurately, and 47% struggle with multi-channel measurement. Many ROI benchmarks should not be followed strictly for performance but must be treated as signals.
- Now, 83% of marketing leaders list ROI proof as their top goal versus 68% five years ago.
- Also, 64% of companies use past ROI results when planning future budgets, which makes solid measurement key for deciding where the spend should go.
- Just 28% of marketers say they have a solid system for tracking ROI, and nearly half report trouble with multi-touch attribution. This is important for SEO, where customers going from the first visit to a sale can take a long time, and it may also involve several touchpoints before someone buys.
- By comparison, email can be easier to evaluate because clicks and conversions are more directly connected.
- HubSpot reports that marketers who track ROI are 1.6 times more likely to get larger budgets. This suggests that better measurement is not only about more reports, which can affect what money comes next.
- The above figures suggest that marketers should use ROI benchmarks as a first step, but do not treat them as fixed outcomes.
Conclusion
In 2026, Marketing ROI is defined by budget constraints and measurable business outcomes rather than spending volume alone. Global ad spend is projected to reach $1.30 trillion, while AI, email, SEO, automation, and mixed channel plans show strong impact. However, only 36% of marketers say they can measure ROI correctly, which makes attribution hard to get right. The data also show that long-term growth needs good customer economics, with a 3:1 LTV ratio as a quick check used by many teams.
Marketers should estimate the revenue, profit, retention, CAC, LTV, and payback together at the same time. Improved measurement and investment can help organizations use money more wisely, which supports stronger returns over time.
FAQ
There is no single average. ROI differs a lot by channel, industry, and business model.
SEO results of 748% for B2B and 721% for B2C over three years.
A 3:1 LTV ratio is often used as a benchmark for steady growth.
The reported average is $5.44 back for each $1 spent. That equals 544% ROI.
Only 36% of marketers claim they measure ROI accurately, and 47% say multi-channel measurement is difficult.