





Brief Overview
Hydrogen Energy Statistics: Hydrogen always comes up in conversation when my friends and I discuss the future of energy. But instead of just throwing around these as rumors, I want to actually walk you through the numbers and explain how things stand today. That’s why I’m putting together this detailed piece on hydrogen energy statistics.
Hydrogen has been around for decades, but only in the last few years has it started being called the “fuel of the future.” Still, when you look at the data, you see that most hydrogen today comes from fossil fuels. Clean hydrogen, the one we all hope for, is still less than one percent of the total production worldwide. That may sound discouraging at first, but the market size, investment figures, and government targets show a very different picture for the years ahead.
But what makes these hydrogen energy statistics exciting is how many million tons are produced each year, how much carbon it releases, and how much money countries are pouring into green projects. By the end of this, you’ll understand not only where the hydrogen industry stands today, but also the direction it’s heading. Let’s get into the content.
The Editor’s Best Picks
- Global hydrogen demand reached 100 million tonnes in 2024, a 2% increase from 2023.
- More than 66% of hydrogen comes from natural gas, about 20% from coal, and less than 1% from low-carbon sources.
- Global hydrogen production caused around 920 million tons of C02 emissions in 2023, about 5% of global energy-related C02.
- Installed electrolyser capacity hit 1.4 GW in 2023, projected to reach 5 GW in 2025.
- The active project pipeline shows 175 mtpa capacity, but only 9 mtpa has been completed so far.
- The hydrogen market value was about USD 155 billion in 2022, and is expected to hit USD 230 billion in 2024 and USD 1.6 trillion by 2050.
- Green hydrogen is still small, USD 7.7 billion in 2024, but projected to soar to USD 328 billion by 2035.
- China controls nearly 60% of electrolyser manufacturing, aiming for 200,000 tons of clean hydrogen annually by 2025.
- India targets 5 million tons of green hydrogen by 2030, backed by 125 GW of renewable energy.
- Saudi Arabia’s NEOM project will produce 600 tons/day of hydrogen starting in 2026.
- US hydrogen is 95% fossil-based, but incentives like the 45V tax credit are shaping the future.
- The fuel cell market is projected at USD 26.6 billion by 2026, with companies like Hyundai aiming for 700,000 fuel cell systems per year by 2030.
| Category | Key Statistics |
| Global Demand | 100 Mt in 2025 (2% from 2024) |
|
Production Mix | 66% natural gas, 20% coal, 1% low-carbon (2023) |
| C02 Emissions | 920 Mt C02 in 2023 (5% of global energy emissions) |
|
Electrolyser Capacity | 1.4 GW in 2023, 4 GW in 2024, 520 GW pipeline for 2030 (only 4% secured) |
| Pipeline Projects |
175 mtpa total; 1.9 mtpa completed; 3.4 mtpa with final decisions |
|
Market Value | USD 155B (2022), USD 230B (2024), USD 1.6T (2050 projection) |
| Green Hydrogen Value | USD 7.7B (2024), projected USD 328B by 2035 (40.7% CAGR) |
|
China | 60% electrolyser capacity; 200k t clean hydrogen by 2025 |
| India |
5 Mt green hydrogen by 2030; 125 GW renewable backing |
|
Saudi Arabia | NEOM project, 600 t/day hydrogen, 3.9 GW renewables, by 2026 |
| United States |
95% fossil hydrogen; Texas major hub; tax credit expiry risk in 2025 |
|
Fuel Cells | USD 26.6B market by 2026; Hyundai: 700,000 systems annually by 2030 |
Where It All Began?
(Source: mdpi.com)
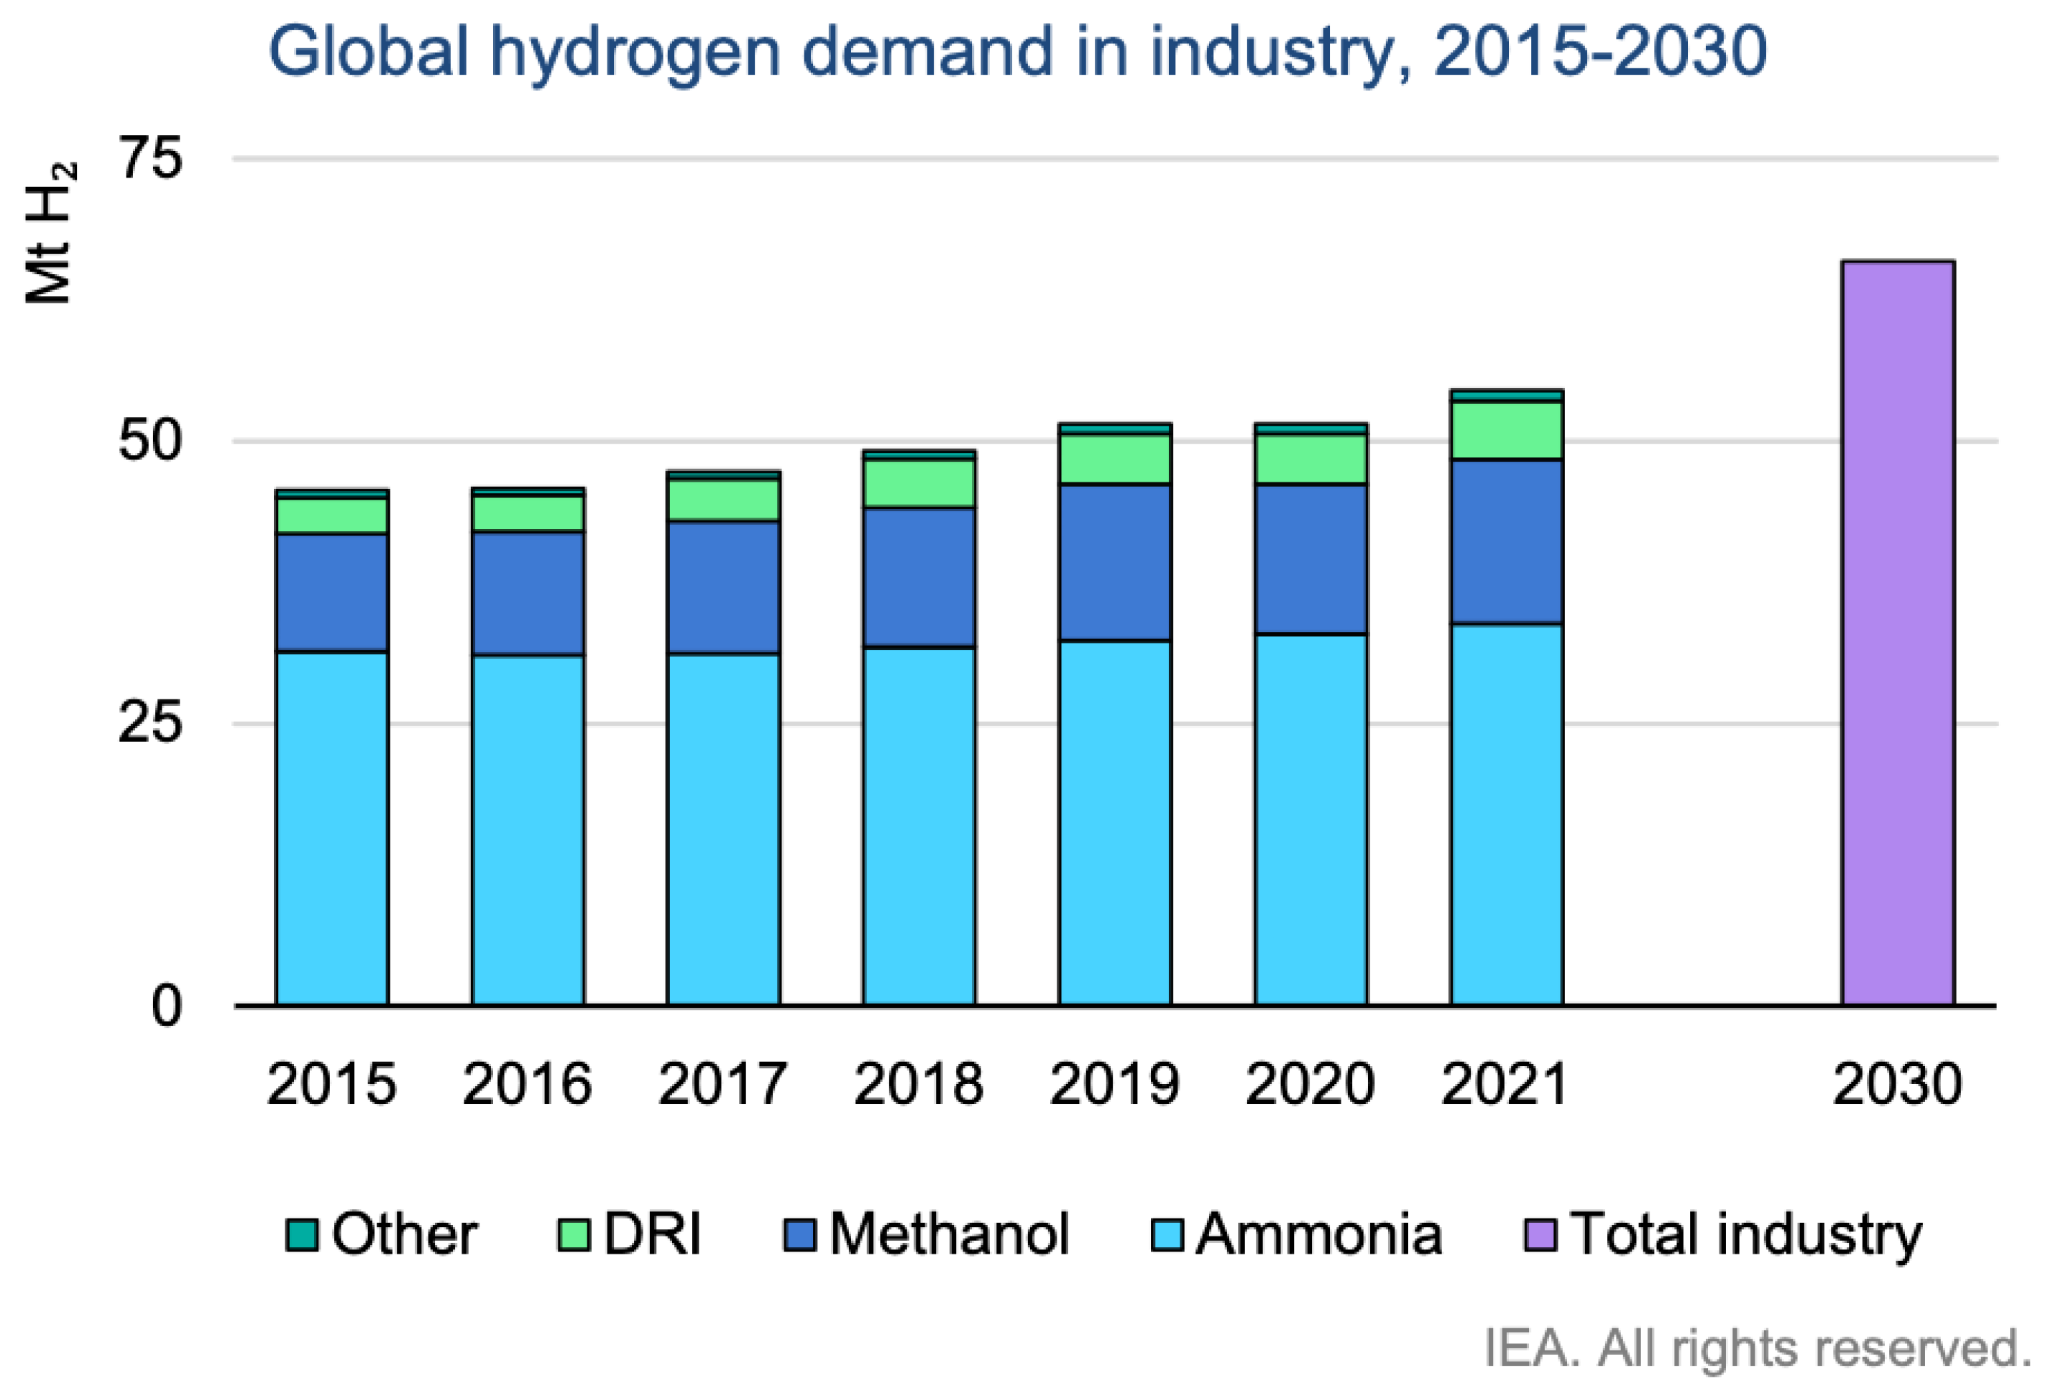
- More than 99% came from fossil fuels, mainly natural gas and coal.
- In 2024, hydrogen led to about 920 million tonnes of C02, equal to 5% of global C02 emissions.
- By 2024, hydrogen demand rose to 100 million tonnes, up 2% from 2023.
- But low-carbon hydrogen was still less than 1%, under 1 Mt.
| Year | Global Hydrogen Production | Low-carbon Share | C02 Emissions from Hydrogen | Notes |
| 2023 | 97 Mt | 1% | 915 Mt C02 | Slight growth |
| 2024 | 100 Mt | 2% | 920 Mt C02 | Demand 5% YoY |
The Production Breakdown – How Much Comes from Where?
(Source: researchgate.net)
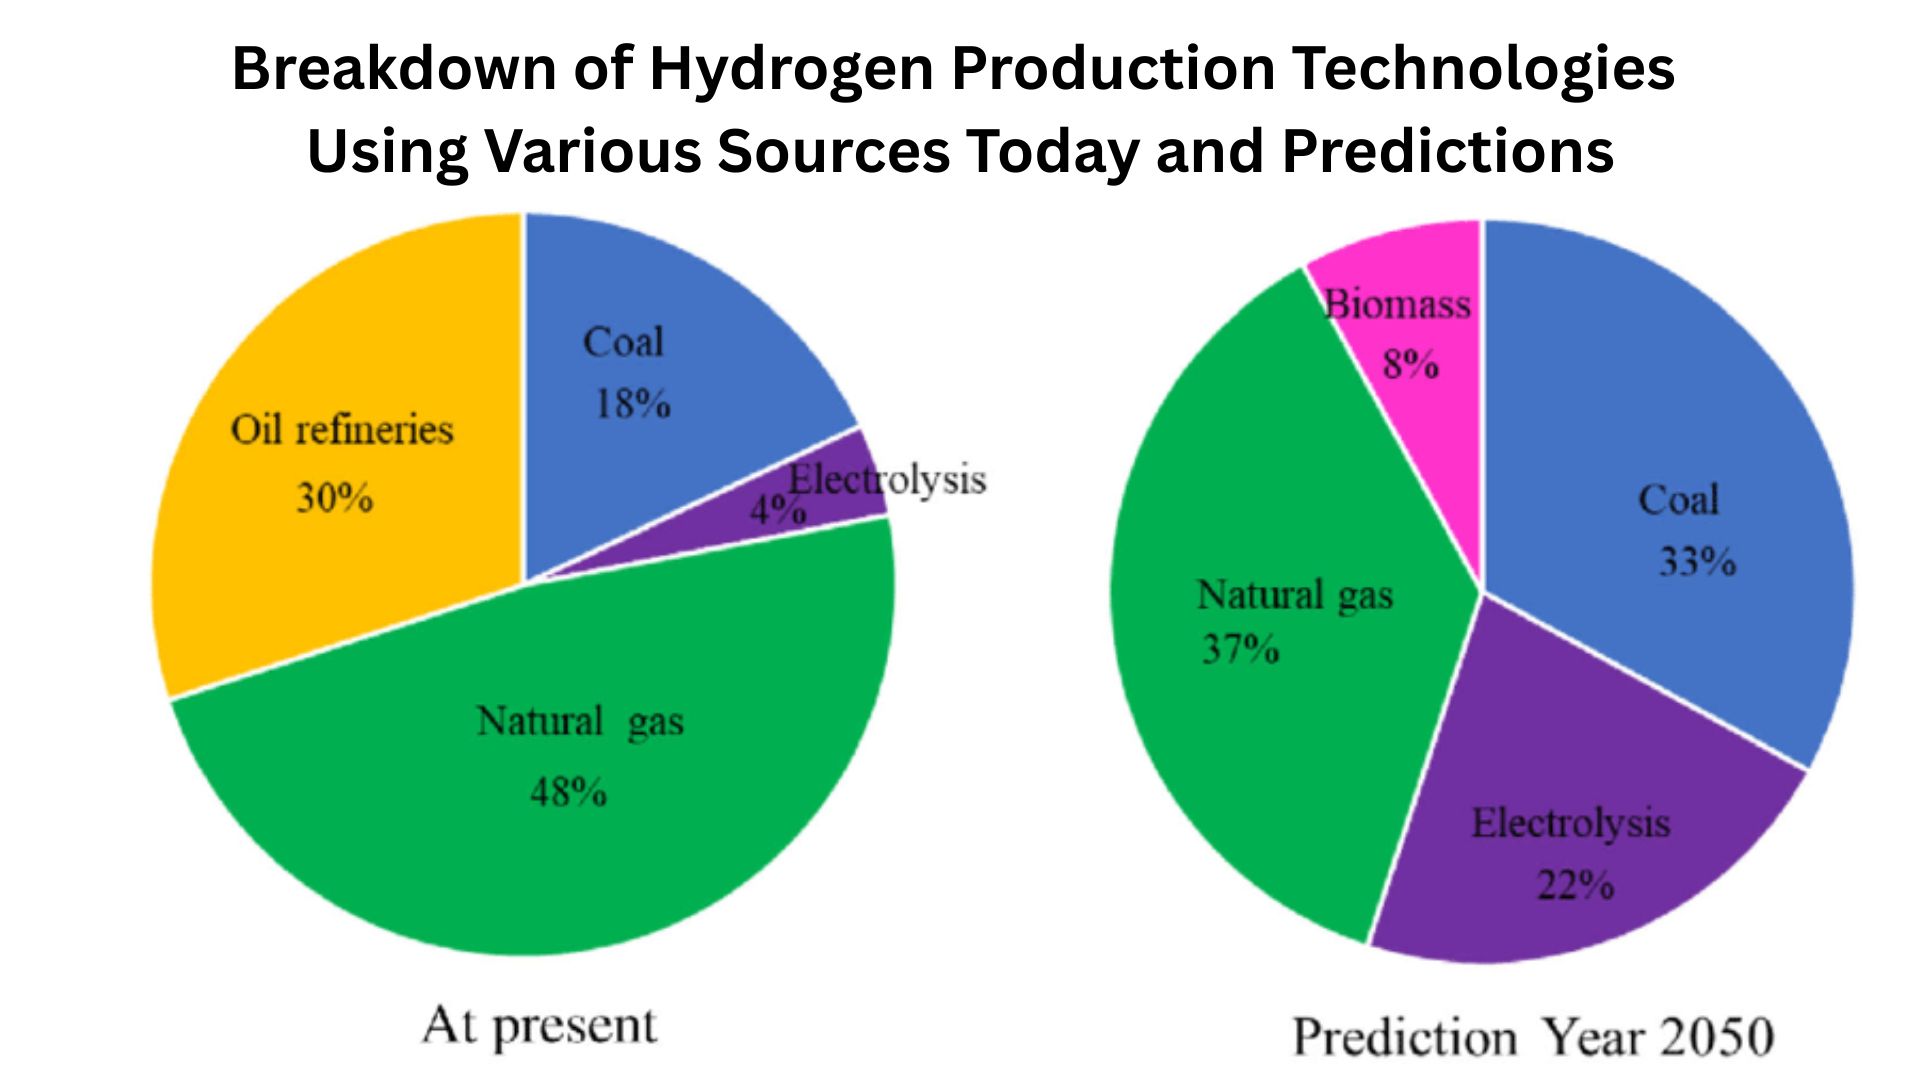
- In 2024, nearly 80% of global hydrogen demand was met with hydrogen produced from unabated natural gas
- About 20% came from coal, heavily concentrated in China.
- Less than 1% came from low-carbon methods like electrolysis.
- Electrolyser capacity stood at 1.4 GW in 2023, expected to hit 5 GW in 2024.
- Long-term, the pipeline suggests 520 GW by 2030, though just 4% is secured.
| Year | From Natural Gas | From Coal | Low-carbon Hydrogen | Electrolyser Capacity |
| 2023 | 66% | 20% | 1% | 1.4 GW |
| 2024 | 80% | 19% | Slightly (2%) | 5 GW (projected) |
| 2030 projected | Lower share | Lower share | Larger share | 520 GW pipeline (only 4% confirmed) |
What’s in the Pipeline, Announced vs Real Progress
(Source: mdpi.com)
- In late 2024, 21 projects were announced, adding 0.9 mtpa capacity.
- Q2 2024 was even bigger: 14 projects with 2.2 mtpa.
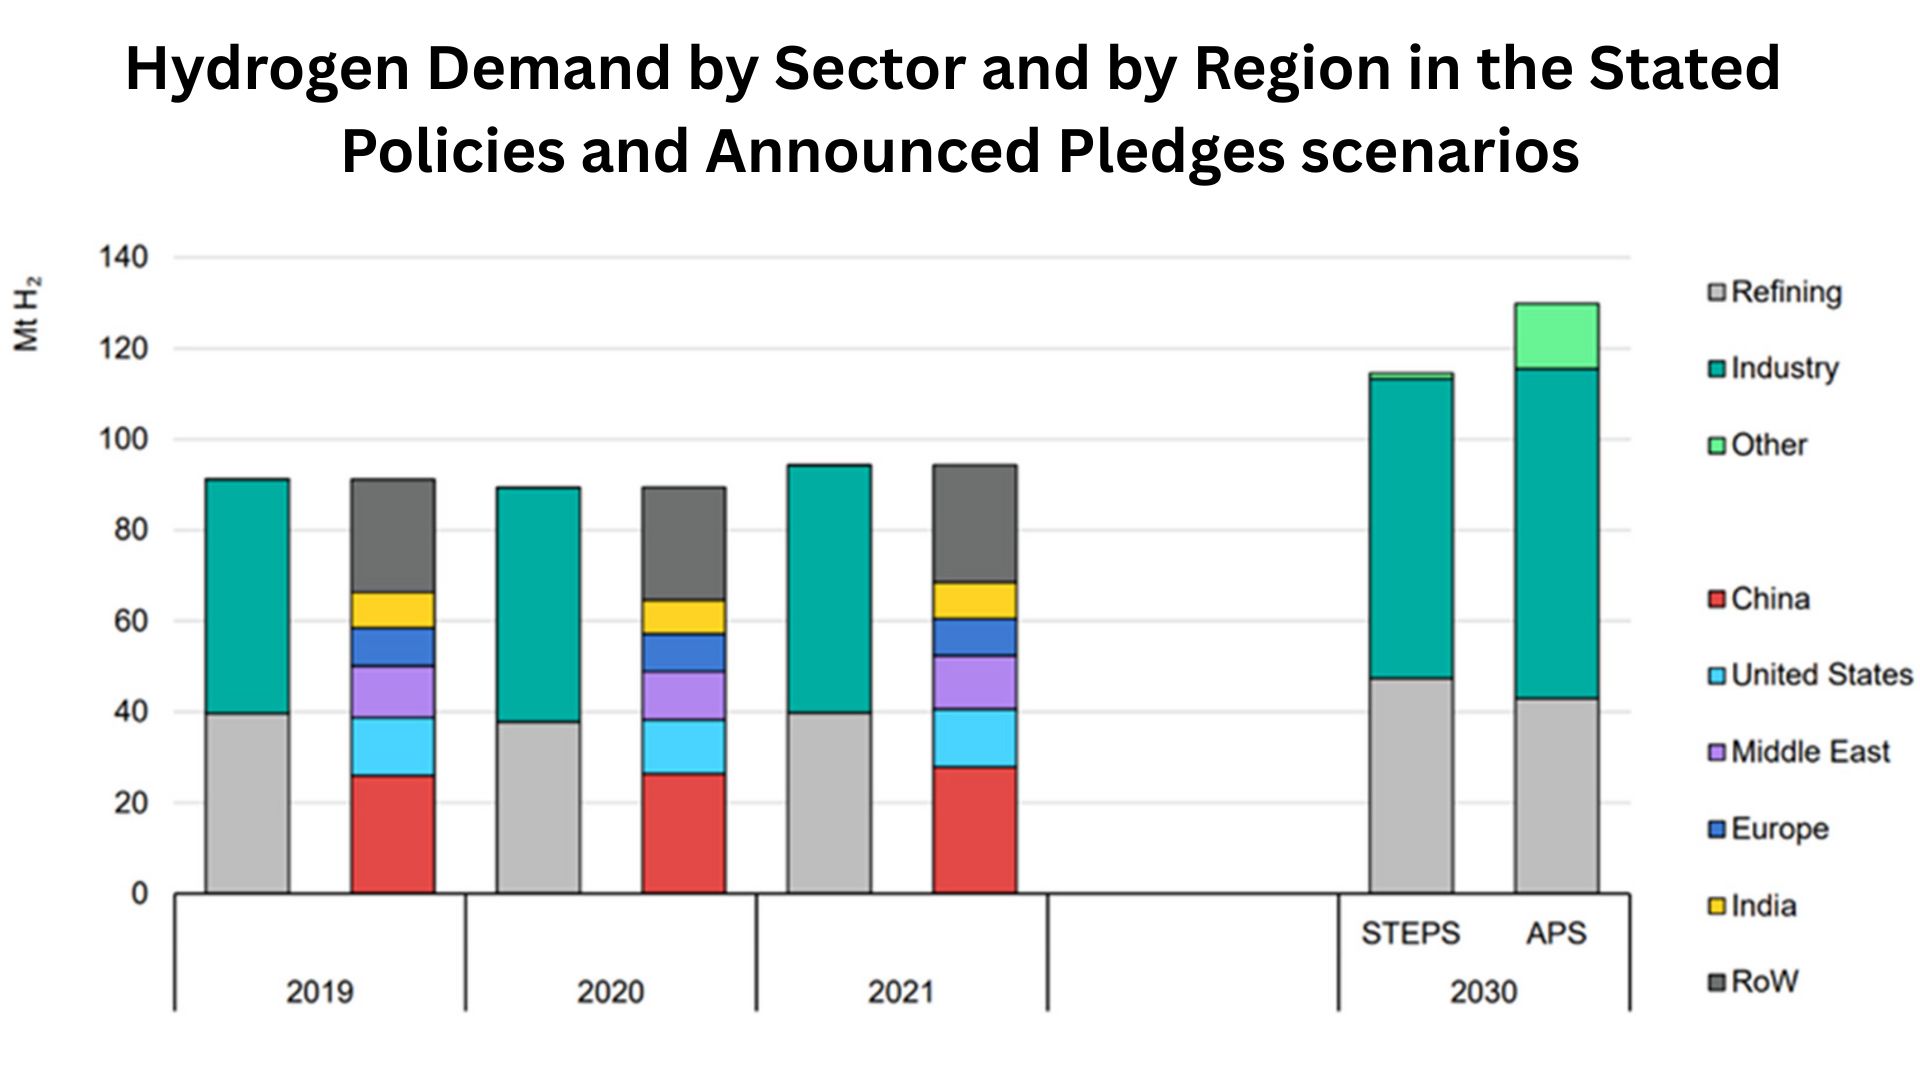
- The global pipeline now sits at 175 mtpa, but only 1.9 mtpa has been completed.
- Projects reaching investment decisions add up to 3.4 mtpa by 2030.
| Period | Projects Announced | Capacity (mtpa) | Completed Capacity | FID / Secured |
| Q2 2024 | 14 | 2.2 | 1.8 operational | 3.4 mtpa FID |
| Q4 2024 | 21 | 0.9 | 1.9 mtpa total | Mostly pending |
| 2030 projected | Ongoing pipeline | 175 mtpa | N/A | 3.4 mtpa secure |
Cost and Market Value, Where Money Comes In
(Reference: India-Briefing.com)
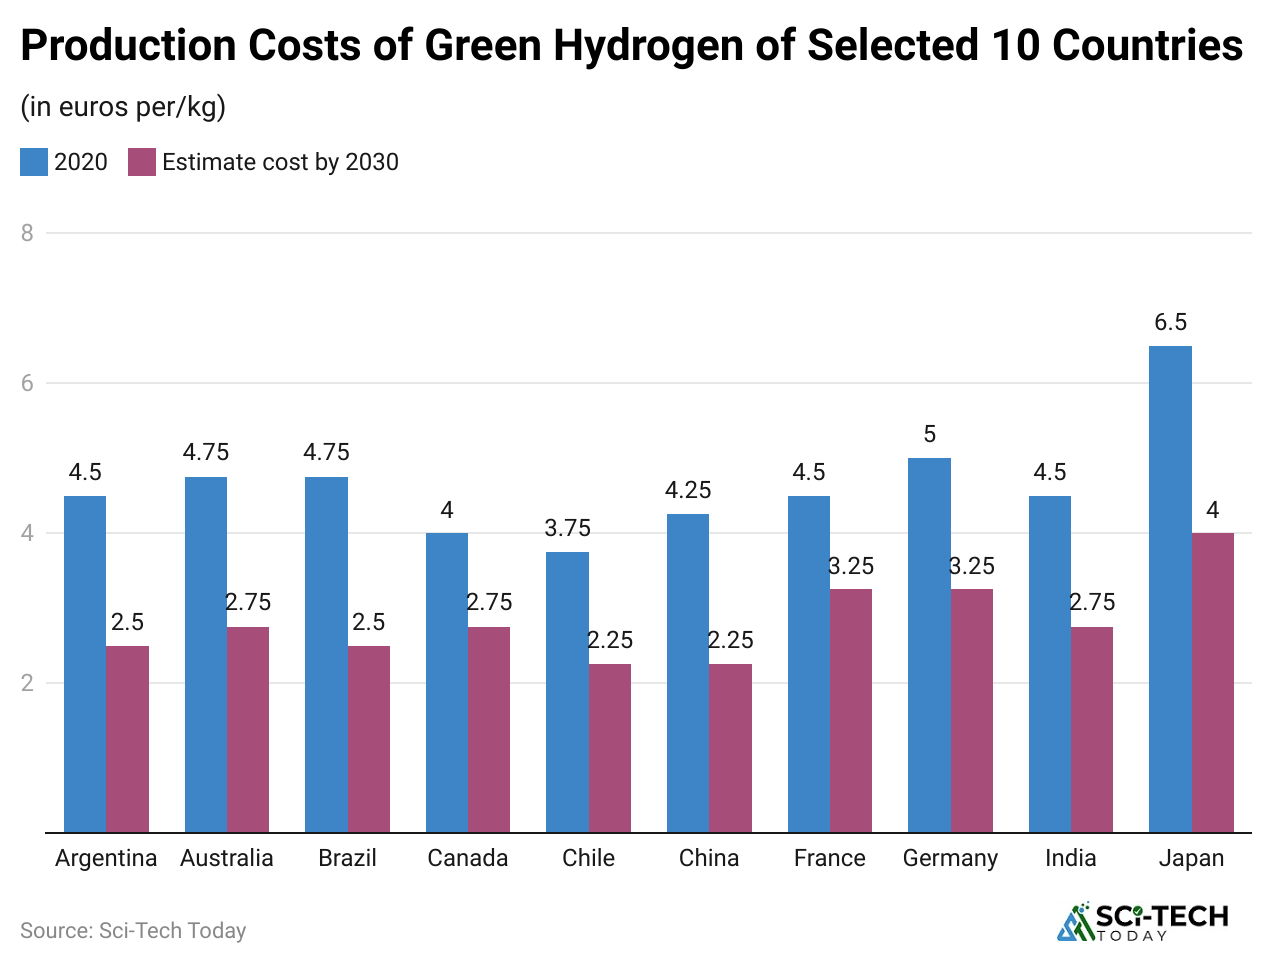
- In 2022, the hydrogen market was valued at USD 155 billion.
- By 2024, the value grew to around USD 230 billion.
- By 2050, it could reach USD 1.6 trillion.
- Green hydrogen alone: USD 7.7 billion in 2024, projected to USD 328 billion by 2035.
- Today, producing green hydrogen costs 1.5 to 6 times more than grey hydrogen.
| Year | Global Market Value | Green Hydrogen Value | Cost Comparison | Future Outlook |
| 2022 | USD 155B | USD 4.2B | 1.5 to 6× grey | Early growth stage |
| 2024 | USD 230B | USD 7.7B | Still high | Market diversifying |
| 2035 projected | USD 600B | USD 328B | Costs dropping | Strong CAGR |
| 2050 projected | USD 1.6T | Major share | Competitive | Global expansion |
Regional Moves and Strategic Goals
(Source: google.com)
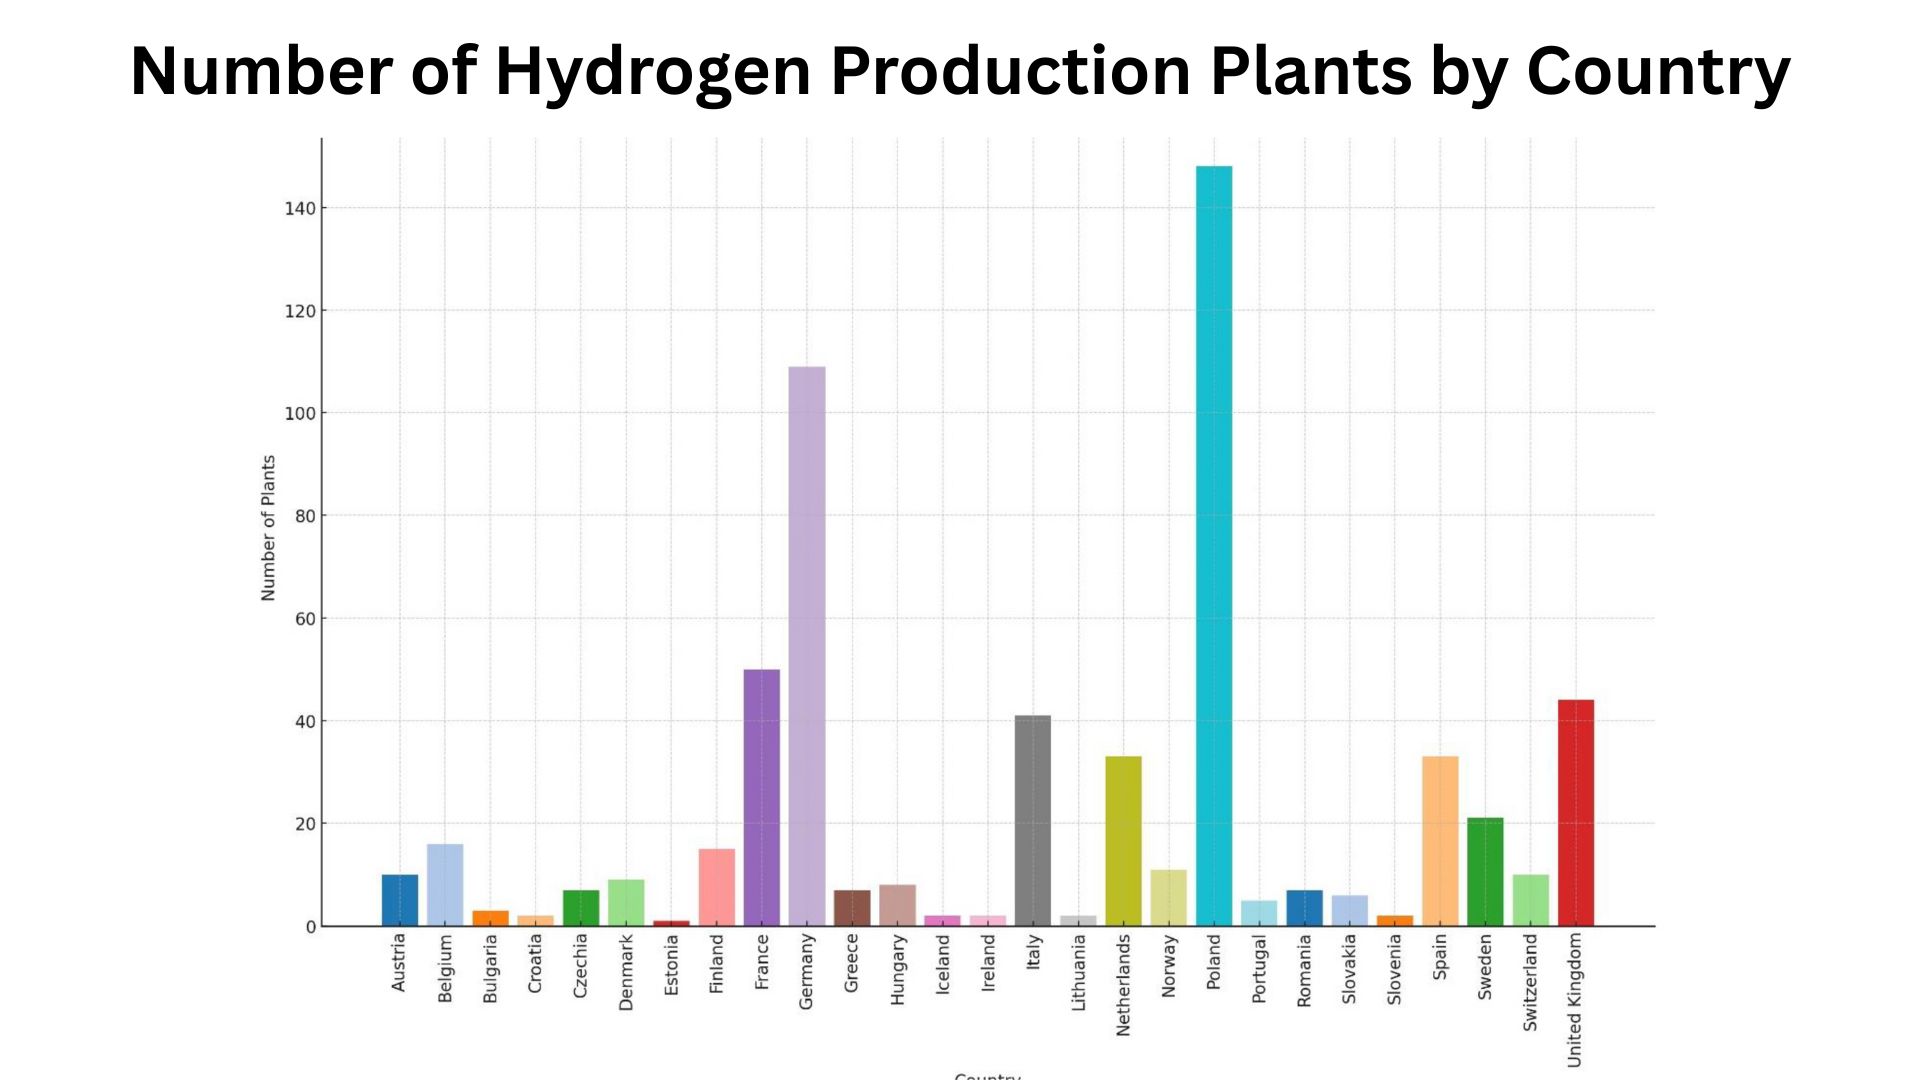
- China: Leading with 60% electrolyser capacity, aiming for 200k tonnes of clean hydrogen by 2025.
- India: Targeting 5 Mt by 2030, with 125 GW of renewable backing. Wants to cover 10% of global demand.
- Saudi Arabia: NEOM project producing 600 tonnes/day of hydrogen by 2026.
- United States: 95% hydrogen from natural gas, with Texas as a hub. Tax credits are crucial for growth.
- Europe: Pushing hydrogen banking with Euro 1.9B support.
| Country | Target | Capacity/Investment | Timeline | Notes |
| China | 200k t clean hydrogen | 60% electrolyser capacity | By 2025 | Largest electrolyser hub |
| India | 5 Mt green hydrogen | 125 GW renewables | By 2030 | 10% of the world’s demand |
| Saudi | 600 t/day hydrogen | 3.9 GW renewables | By 2026 | NEOM mega-project |
| US | 95% fossil-based | Tax credit support | 2025 expiry risk | Texas key hub |
| EU | Euro 1.9B Hydrogen Bank | Multiple projects | 2030 goals | Banking support |
Fuel Cells and End-Use Markets
(Reference: precedenceresearch.com)
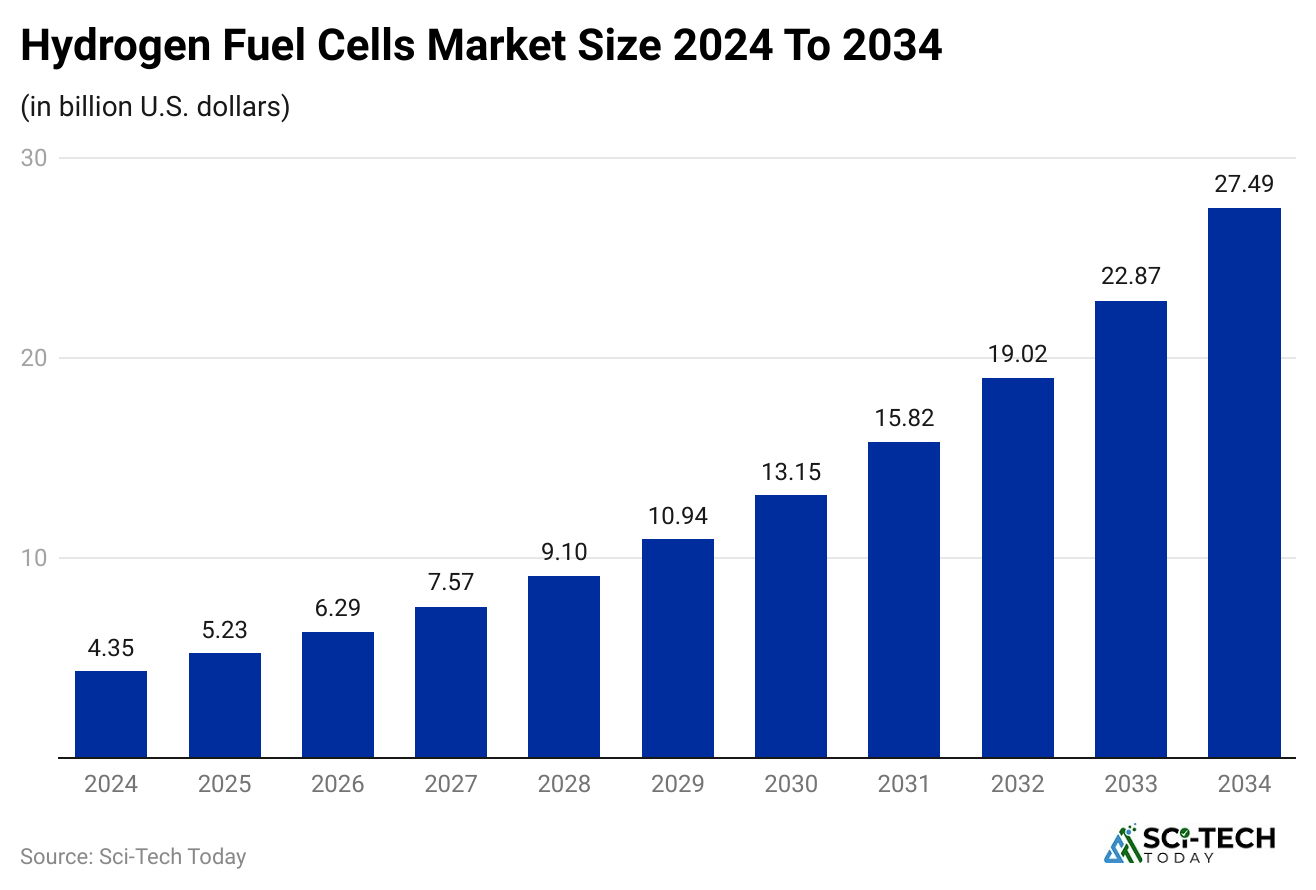
- The fuel cell market is projected to reach USD 26.6 billion by 2026.
- Fuel cell stacks are valued at USD 1.3 billion by 2024.
- Plug Power is building 30 GW of green hydrogen by 2030.
- Hyundai aims for 700,000 fuel cell systems annually by 2030.
| Company/Market | Target | Year | Notes |
| Global fuel cell market | USD 26.6B | 2026 | Growing fast |
| Fuel cell stacks | USD 1.3B | 2024 | Strong demand |
| Plug Power | 30 GW of hydrogen | 2030 | Large-scale |
| Hyundai | 700,000 systems | 2030 | Transport focus |
Ending
So, after looking at all these numbers, it’s clear that hydrogen energy statistics give us the real picture of where things stand today. On one side, most of the hydrogen we use is still coming from fossil fuels, and clean hydrogen is hardly scratching the surface yet. On the other side, the market value, the size of the pipeline, and the ambitious government targets show us how fast things can change in the next few years.
When we track it, we can see both the problems and the opportunities. The challenge is scaling up clean production and cutting costs, while the opportunity is to make hydrogen one of the key fuels that help us reduce emissions and create a cleaner energy future. If the world sticks to these plans, the numbers we’re seeing now could look very small compared to where we will be by 2030 and 2050. So, if you have any questions regarding this content, kindly let us know in the comments section. Thanks.
FAQ
Hydrogen energy is power generated from hydrogen gas, used to fuel vehicles, generate electricity, and support industrial processes. It is considered one of the cleanest energy sources when produced using renewable energy.
Hydrogen is mainly produced through electrolysis, which splits water using electricity, or steam methane reforming from natural gas. Green hydrogen, made using renewable energy, is the most sustainable and environmentally friendly option.
The biggest challenges include high production costs, limited storage and distribution infrastructure, and energy efficiency concerns. However, costs are steadily declining as technology improves and government investments increase globally.