






Introduction
Marketing Attribution Statistics: In 2026, Marketing attribution is getting more important as customer paths are now spread out across search, social, video, email, retail media, sites, apps, stores, and AI-based discovery. Marketers use attribution to see what touchpoints helped lead to a sale and also guide how to split the marketing budget.
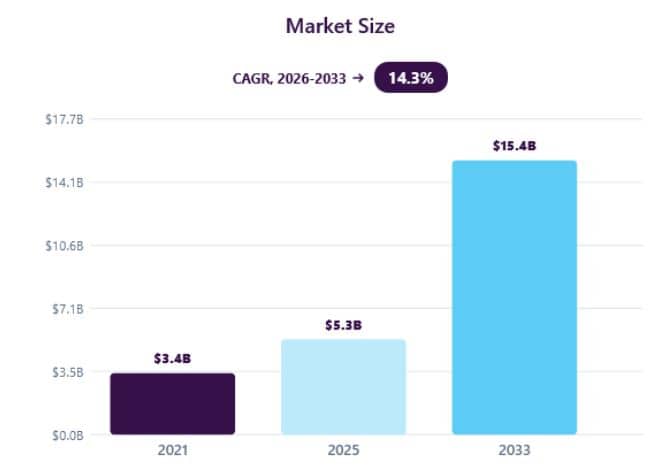
According to Grand View Research, in 2026, one estimate puts the marketing attribution software market near $6.0 billion, and it could grow to $15.4 billion by 2033, with the projected CAGR at 14.3%. As per 360iResearch, it puts the market at $6.0 billion in 2026 and forecasts $16.55 billion by 2032.
Meanwhile, Nielsen reports that 85% of marketers feel confident about ROI, while only 32% measure it across both traditional and digital media. Attribution is no longer just a reporting task, becoming a system tied to spend decisions, lift testing, AI tuning, and revenue tracking.
Editor’s Top Picks
- In 2026, the marketing attribution market is estimated at $6.0 billion in 2026 and expected to reach $15.4 billion by 2033, with a 14.3% CAGR.
- North America brings in 42.4% of global attribution software revenue.
- Multi-source attribution makes up 49.2% of revenue, while Cloud is 54.9% of the market.
- Nielsen says 85% of marketers feel confident about ROI, but only 32% measure ROI across digital and traditional channels.
- Only 28% say they have a strong ROI measurement setup, and 38% call attribution their top analytics issue.
- A lot of CMOs, 64%, say attribution changes how they plan budgets.
- Marketing Mix Modelling usually needs 12 to 24 months of data, with accuracy often listed as about plus or minus 15 to 20%.
- In B2B, the typical buyer path now runs 272 days with 88 touchpoints, as compared to 2024, when it was 211 days and 76 touchpoints.
- 81% occur before a prospect reaches the sales pipeline,
- 78% are said to be hit by cookie deprecation, while privacy loss is estimated at 30 to 40%.
- 56% of marketing groups use AI analytics, and only 29% of those teams can say what ROI those tools create.
- Adoption of AI-driven attribution has jumped 44% year over year and is expected to pass 60% by 2027.
- For 2026, 40% of marketers name Marketing Mix Modelling as their main measurement spend.
Marketing Attribution Software Market Share
(Source: grandviewresearch.com)
- The market for marketing attribution software is growing, and companies want effective ways to see how channels connect to conversions.
- In 2025, the global market value was $5.3 billion. In 2026, it is forecast at $6.0 billion and is expected to reach $15.4 billion by 203,3 with an increase of 14.3% CAGR from 2026 to 2033.
- In 2025, North America made up 42.4% of global revenue, and the U.S. has the largest share within North America.
- Asia Pacific is expected to grow the fastest from 2026 to 2033.
- In 2025, multi-source attribution brought in 49.2% of total revenue, as the market is driven a lot by the need for multi-channel measurement.
- Looking at deployment, cloud setups took 54.9% of the market, pointing to attribution tools that scale and are easy to use.
- In 2025, large enterprises were the top size group, while IT and Telecom made up 22.3% of revenue.
- Overall, marketing attribution is shifting toward linking many customer touchpoints, and the goal is clearer views of how marketing performs.
- As marketing spreads across more digital channels, bigger firms tend to rely on attribution software to add structure to measurement.
Marketing Attribution Models
| Model | Data Requirement | Accuracy | Timeframe | Best For |
|---|---|---|---|---|
| MMM | Spend data + conversions (macro) | ±15–20% | 12–24 months of history | Budget reallocation, channel ROI |
| MTA | Event-level tracking (GA4, CDP) | ±8–12% | 3–6 months minimum | Tactical adjustments, bid optimization |
| Incrementality Testing | Holdout groups + control audience | ±5–8% (highest) | 4–12 weeks per test | Channel validation, true causal impact |
(Source: whitehat-seo.co.uk)
B2B marketers need attribution methods that keep trade-offs in check: measurement quality, accessibility, and results-driven. Marketing Mix Modelling (MMM), Multi-Touch Attribution (MTA), and incrementality work for different jobs.
Marketing Mix Modelling (MMM)
- MMM supports planning and spend allocation decisions.
- It estimates ROI by channel and spots high-level patterns, as most teams use about 12 to 24 months of past data, including ad spend roll-up results like revenue, leads, or conversions.
- The reported accuracy often sits around ± 15 to 20%.
- A common benefit is that MMM does not rely on cookies, pixels, or person-level logs, which helps when third-party tracking is weak.
- Still, MMM shows statistical links as it does not prove direct cause, and findings can shift due to seasonality, rivals, and other market forces.
Multi-Touch Attribution (MTA)
- MTA tracks what happens across a customer path and is used for work like ad tuning and bid choices.
- It usually needs 3 to 6 months of data, event-level tracking, and common tools include GA4 or a CDP.
- Accuracy is often estimated around ± 8 to 12%, which places it between MMM and incrementality testing.
- GA4 used a data-driven attribution style as the default starting in September 2023, but in February 2026, GA4 added assisted conversion details to its Conversion Attribution Analysis Report, which gives more context on touches that happen earlier in the journey.
Incrementality Testing
- Incrementality testing is one of the best ways to see if marketing caused the change you observe.
- The method puts one group in the marketing condition and keeps another group as a comparison, often called a control or holdout, and checks how the results differ between the two groups.
- The measured error is usually around plus or minus 5 to 8%; it tends to rank as the most accurate option when you compare it with the other approaches.
- Most studies run for about 4 to 12 weeks, although they need enough people or events in both the test group and the control group.
- The testing approach is used to test specific channels or individual campaigns, which helps confirm whether the activity brings extra conversions, not just conversions that would have happened anyway.
(Sources: Google Analytics Blog (2026), Nielsen MMM Standards (2025), Cometly Incrementality Framework (2026).)
HubSpot Attribution Models
| Model Type | Touch | Credit Logic | Use Case |
| First-Touch | Single | 100% to first interaction | Awareness channel ROI |
| Last-Touch | Single | 100% to final interaction | Direct response optimization |
| Linear | Multi | Equal credit to all touches | Full-funnel analysis |
| Time-Decay | Multi | More credit to recent touches | Consideration phase evaluation |
| Data-Driven | Multi | Algorithm learns from conversion paths | Holistic budget allocation |
(Source: whitehat-seo.co.uk)
HubSpot’s Attribution: Connecting Marketing Activity To Revenue
- HubSpot handles attribution by testing several credit rules, not by using just one, including nine models: first-touch, last-touch, linear, time-decay, 40-20-40, U-shaped, W-shaped, custom, and data-driven.
- Running these models on the same dataset allows marketers to see how each method changes what every touchpoint seems to contribute.
- There are three main ways to view attribution, and each one gives a different kind of business insight. Contact Attribution looks at marketing impact per individual contact, Deal Attribution ties actions to sales deals, and Revenue Attribution links marketing activity to closed revenue.
- In B2B work, revenue-focused reporting is often the most helpful because it shifts the focus from lead count to the money that marketing helps produce.
- In February 2026, HubSpot added a GA4 Data Manager link, enabling GA4 events and revenue to be synced into HubSpot, which support can connect what happens on a site with CRM data and attribution records. It also cuts down on manual data work.
- Rather than judging channels one at a time, marketers can compare attribution models, tie customer activity to deals, and see how those signals relate to revenue. This can make attribution more practical for budget choices and performance reviews.
Attribution Spend Patterns Statistics
(Source: digitalapplied.com)
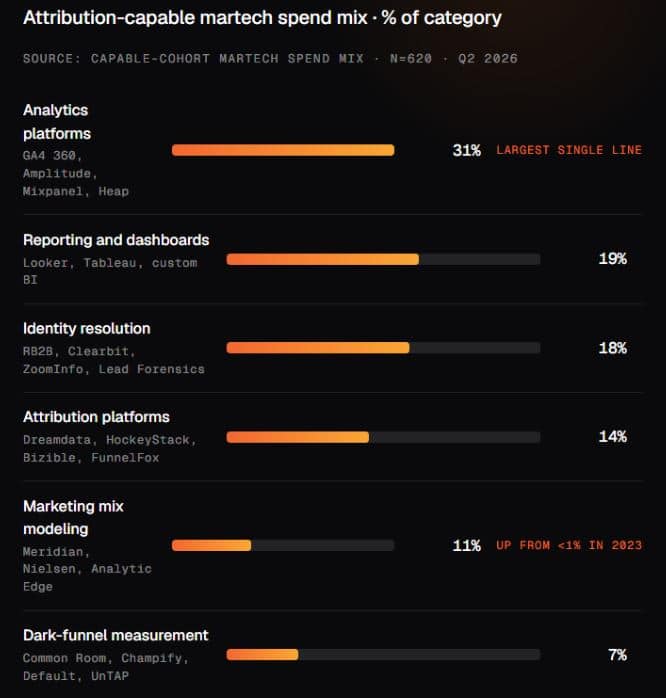
- From 2024 to 2026, the spending plan shifts toward more advanced ways to measure results.
- The analytics platforms take the top share at 31% of martech spend that supports attribution.
- Reporting and dashboards come in next at 19%, while Identity resolution is close behind at 18%, pointing to identity work being nearly as big as standard reporting.
- Marketing mix modelling, or MMM, jumps from under 1% to 11%, which is one of the biggest jumps across categories.
- Dark-funnel measurement also rises to 7%, up from almost nothing before, which means identity resolution grows faster than analytics overall, so budgets seem to lean harder into measurement and identity.
- The marketers have attribution capability; they see a 23% martech premium and a 1.6 times increase in pipeline.
- For finance and marketing leaders, it sounds like cutting attribution work could help near-term spend efficiency, but could also hurt the measurement base that supports growth.
- The above statistical information points to the GTM model that is becoming more mature, where money is shifting away from only dashboards, and more funds go toward identity, modelling, and harder-to-measure demand signals.
Marketing ROI Measurement and Attribution Statistics 2026
| Metric | Value |
| Marketers confident in holistic ROI measurement ability | 85% |
| Marketers actually measuring holistically (digital + traditional) | 32% globally (23% in Europe) |
| CMOs confident in measuring marketing ROI | 30% |
| CMOs who base budgets on past ROI performance | 64% |
| Marketers who cite attribution as their #1 analytics challenge | 38% |
| CMOs who say attribution directly influences budgeting decisions | 64% |
| Marketers struggling to prove ROI as their top priority | 83% |
| Only 28% of marketers have a solid ROI measurement system | 28% |
| Marketers with data-driven attribution: revenue growth advantage | 1.7x faster |
(Source: omnibound.ai)
The B2B Attribution Problem
| Metric | Value |
| Average B2B buyer journey (2025 data) | 272 days (up from 211 days in 2024) |
| Average B2B journey touchpoints | 88 (up from 76) |
| Average stakeholders per deal | 10 (up from 6.8) |
| Channels per journey | 4 (up from 3.7) |
| % of B2B journey before sales pipeline | 81% |
| Days buyers spend in self-education pre-pipeline | 220 days (~7 months) |
| B2B buying journey by segment: large enterprise average | 326 days |
| B2B marketers who consider 30/90-day attribution windows adequate | <5% (implied by journey length data) |
(Source: omnibound.ai)
Privacy Signal Loss and Attribution Challenges In 2026
| Metric | Value |
| Existing attribution setups impacted by cookie deprecation by 2026 | 78% |
| Marketers using UTM standardization practices | 63% |
| Privacy Signal Loss: estimated cross-channel tracking reduction | 30–40% |
| Server-side tracking recovery of lost signal | 60–75% |
| CMOs who list data reliability as #1 barrier to attribution improvement | Majority |
(Source: omnibound.ai)
AI Attribution And The Growing Measurement Gap In Marketing
- Marketing attribution is shifting in two main ways, showing that attribution tools are getting more capable and buyers are taking paths that are harder to trace.
- The main problem in 2026 is not just getting more data; the key issue is showing whether AI-led actions lead to actual revenue.
- According to the 2026 SparkToro and Datos benchmark study reports, 77.97% of AI search traffic in its sample comes from ChatGPT, Perplexity is listed at 15.10%, Gemini is 6.40%, and Claude is 0.17%.
- The report shows the heavy mix makes AI assistants a more important way people discover options, but older attribution setups may fail to pin down the first AI touch when the user finally lands on a site.
- The study also indicates results from over 1,200 websites, which found AI-referred visits convert at 1.66% versus traditional search visits converting at 0.15%, which is about an 11-times gap.
- The size can change with the industry, the platform, and what “conversion” means, so the 11x figure should be treated as a benchmark rather than a universal rate.
- On the team side, 56% of marketing groups say they use AI-powered analytics, but only 29% can put a number on the ROI from those tools.
- 41% of marketers say they can show ROI from AI work, which is down from 49% earlier. This declining of ROI shows that as AI spending keeps growing, tracking and measurement seem to lag.
- AI- and data-based attribution is up 44% from last year, and more than 60% of teams are expected to use it by 2027. This suggests marketers are relying more on machine learning and mapping hard customer paths instead of just sticking to simple manual models.
- Marketing Mix Modelling is named the top spend for 40% of marketers in 2026, and another method is also getting more attention.
- Gartner rolled out its Magic Quadrant for MMM tools in 2024 and broadened the review in 2025 for more demand for stronger measurement.
- Most marketers who track AI efforts say they see ROI gains. Reported improvements range from 15% to 40%. Still, one problem keeps coming up. It is not the idea. It is measurement that stays the same over time.
- Marketers are adopting AI quicker than they can prove the financial results. Marketers will need better first-party data for AI-powered search, CRM links, and clear measurement rules and measurement frameworks to connect these actions to pipeline and revenue.
Future Outlook For Marketing Attribution
- Attribution in the coming years will move toward causal ways of thinking by leaning on AI, respecting privacy, cover more channels at once.
- Grand View Research expects the marketing attribution software market to grow from $6.0 billion in 2026 to $15.4 billion by 2033.
- Attribution systems are set to change fast as marketers will stitch together multi-touch attribution, marketing mix modeling, lift tests, Privacy rules, and AI-based forecasts into one way to measure performance.
- Traditional work focused on clicks, ads served, site visits, and email sends, and future attribution has to deal with AI search answers, chat-style suggestions, generated posts, agent-led buying steps, and discovery that happens through machines.
- According to Gartner’s forecast, by 2028, over 70% of worldwide advertising spend may end up on AI-influenced self-serve systems.
- The strategic advantage will therefore belong to organizations that can independently determine what caused growth, rather than simply accepting platform-reported conversion numbers.
Conclusion
Marketing attribution matters more in 2026 as customer journeys grow longer, more fragmented, and harder to track. There is a real gap between confidence and full end-to-end coverage. Only 32% of marketers blend digital and offline media in one view; stronger attribution frameworks remain necessary. AI, multi-touch attribution, Marketing Mix Modelling, and incrementality testing are increasingly being combined to improve measurement quality.
Privacy updates are another driver for pushing organizations to rely more on first-party data and lean on modelled signals when direct tracking is limited. In the future, organizations that connect attribution to CRM, revenue records, experiment work, and AI analytics should be better positioned to make informed budget decisions and evaluate marketing’s contribution to growth.
FAQ
The market is estimated at $6.0 billion in 2026.
Only 32% measure ROI across both traditional and digital media.
Incrementality testing has the highest estimated accuracy at ±5–8% among the options mentioned.
It runs about 272 days and includes around 88 touchpoints.
AI is helping attribution work, but it also brings new touchpoints that are harder to track, like AI search and conversational discovery.