
Introduction
Millennials on Social Media Statistics: Since the lockdown, people who never existed on the internet have created accounts on social media. UK 2026 data indicate 90.4% of Millennials use social media. The use of social media is increasing daily. Social media is gaining popularity not only among millennials but also among other generations.
However, the use of these platforms is growing extensively among all generations. These statistics guide recent insights, including the preferences for product research on social media, back-to-school shopping, etc.
Editor’s Choice
- 61% of millennials said they will trust a brand on social media if it has a large number of followers.
- Millennials on Social Media Statistics show that 90.4% of them use these platforms actively.
- Millennials keep themselves updated about the brand through social media networks.
- 46% of millennials use social media to browse products. Others prefer to read reviews or recommendations (44%), find out about promotions (39%), and receive a coupon (28%).
- Individuals who shop on social media such as Instagram are more likely to be aged between 18 and 24 and 25 to 40, contributing 70% and 67%, respectively.
- 84% of millennials are more likely to trust online advertising than traditional advertising.
- In the USA, 50% of millennials use Facebook every day.
- In 2023, the top three leading platforms for millennials to research a product worldwide were Search engines (54%), Amazon (36%), and Social media (36%).
- Most of the users in the millennial generation said it is going in the right direction, representing 53% of votes in a survey by Statista. Nearly 50% of millennials believe the opposite.
- In Q2 of 2023, around the world, Millennials aged between 27 and 42 years preferred Facebook for product purchases, contributing 56%.
General Millennials On Social Media Statistics
- Millennials on Social Media Statistics show that 90.4% of them use these platforms actively.
- More than half of the millennial generation’s users have started using social media platforms since the beginning of the COVID-19 outbreak.
- Millennials are likely to check social media sites multiple times every day.
- 61% of millennials said they will trust a brand on social media if it has a large number of followers.
- 84% of millennials are more likely to trust online advertising than traditional advertising.
- Furthermore, millennials keep themselves updated about the brand through social media networks.
- In the USA, 50% of millennials use Facebook every day.
- Millennials spend an average of 2 hours and 38 minutes on social media every day, with the majority of the time spent on Facebook (87%), followed by Instagram (27%) and YouTube (66%).
- 75% of millennials state that social media networks have become part and parcel of their lives.
- Furthermore, 60% of millennials share content through private messaging apps as compared to any other social media platform.
- 78% of millennials are likely to purchase a product or service after seeing the ad on social media.
- According to Millennials On Social Media Statistics, these individuals spend more time on social media than watching television.
- 39% of millennials said they had created Facebook accounts only for sharing self-promotional content.
- On average, millennials have 2.8 devices and spend around 4 hours online using tablets, laptops, and PCs.
Reasons Millennials Use Social Media For Shopping
- Around 43-44% of Millennials say they discovered a new product on social media in the last three months, and about one‑third (34%) say social media is the channel where they discover new products most often.
- In one 2026 shopping‑habits dataset, 43% of Millennials report having purchased a product directly through a social media platform in the past three months.
- About 16% of Millennials say they use social media specifically to search for product information or reviews, which is reported as the highest rate of any generation in that dataset.
- Other 2025–26 social commerce research indicates that roughly 80% of Millennials have bought at least one item via social media, and over half (around 56%) have made a purchase in the past three months, showing high overall engagement in social‑commerce activity.
Number of Gen Z Users In The US on Social Media Platforms
(Reference: statista.com)
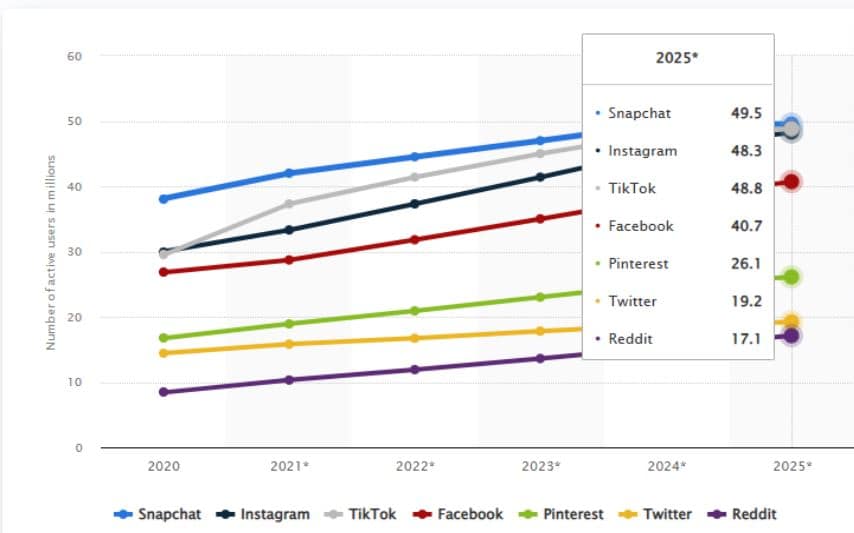
- Snapchat leads as the most-used platform among U.S. Gen Z with 49.5 million users in 2025, maintaining its top position throughout the forecast period due to its strong appeal in messaging and ephemeral content.
- TikTok shows the most dramatic growth, climbing from around 30 million users in 2020 to 48.8 million in 2025, reflecting its explosive rise as a dominant short-form video platform among younger audiences.
- Instagram remains a top contender with 48.3 million Gen Z users by 2025, driven by features like Reels, Stories, and influencer-led content that resonate strongly with this demographic.
- Facebook reaches 40.7 million Gen Z users in 2025, showing steady but slower growth, indicating that while it retains relevance, younger users prefer more visual and interactive platforms.
- Pinterest grows moderately to 26.1 million users by 2025, with its appeal rooted in lifestyle, fashion, and creative inspiration, particularly among female Gen Z audiences.
- Twitter (X) reaches 19.2 million Gen Z users in 2025, reflecting modest growth as the platform faces competition from newer, more visually engaging social networks.
- Reddit shows consistent upward growth to 17.1 million users by 2025, fuelled by Gen Z’s interest in community-driven discussions, niche interests, and anonymous engagement.
Leading Social Media Platforms By Marketers
(Reference: statista.com)
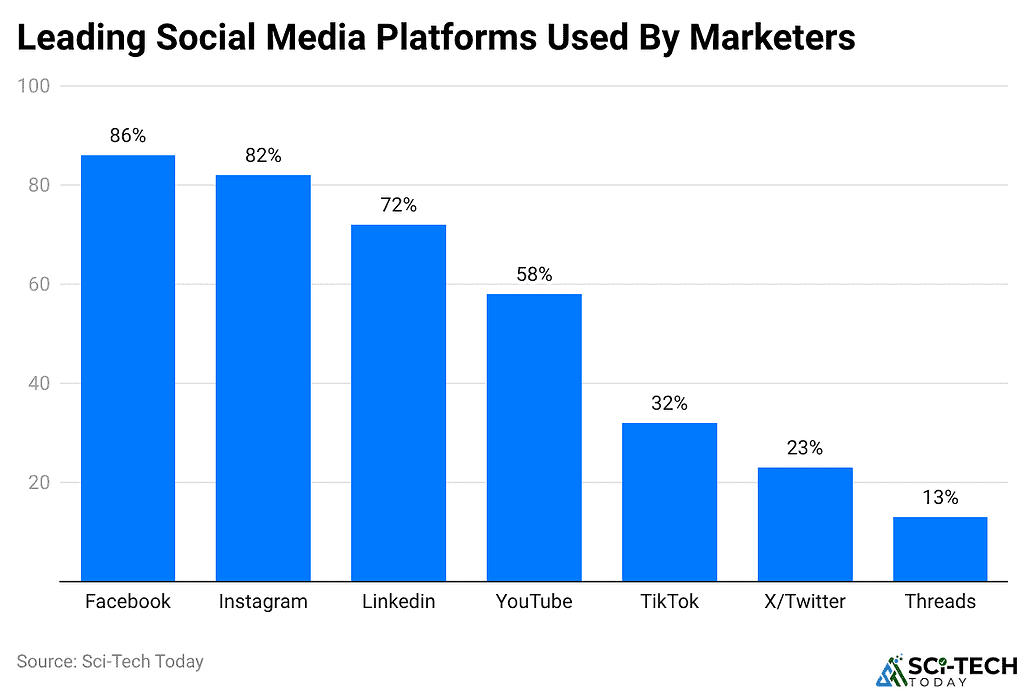
- Facebook remains the most popular platform among marketers, used by 86% of respondents, showing its dominance as a key channel for advertising, audience engagement, and brand visibility.
- Instagram closely follows at 82%, reflecting its strength as a visual-first platform with powerful tools like Reels, Stories, and shoppable posts that drive marketer adoption.
- LinkedIn holds a strong third position at 72%, highlighting its critical role in B2B marketing, professional networking, and targeted advertising for industry decision-makers.
- YouTube is used by 58% of marketers, showcasing the rising importance of video content marketing for storytelling, tutorials, and long-form brand engagement.
- TikTok captures 32% adoption, indicating its growing influence in short-form video marketing, especially for brands targeting younger and Gen Z audiences.
- X/Twitter is used by only 23% of marketers, reflecting declining confidence in the platform due to brand safety concerns and shifting user dynamics.
- Threads ranks lowest at 13%, signalling that the relatively new platform is still in its early stages of adoption and has yet to gain significant traction among marketers.
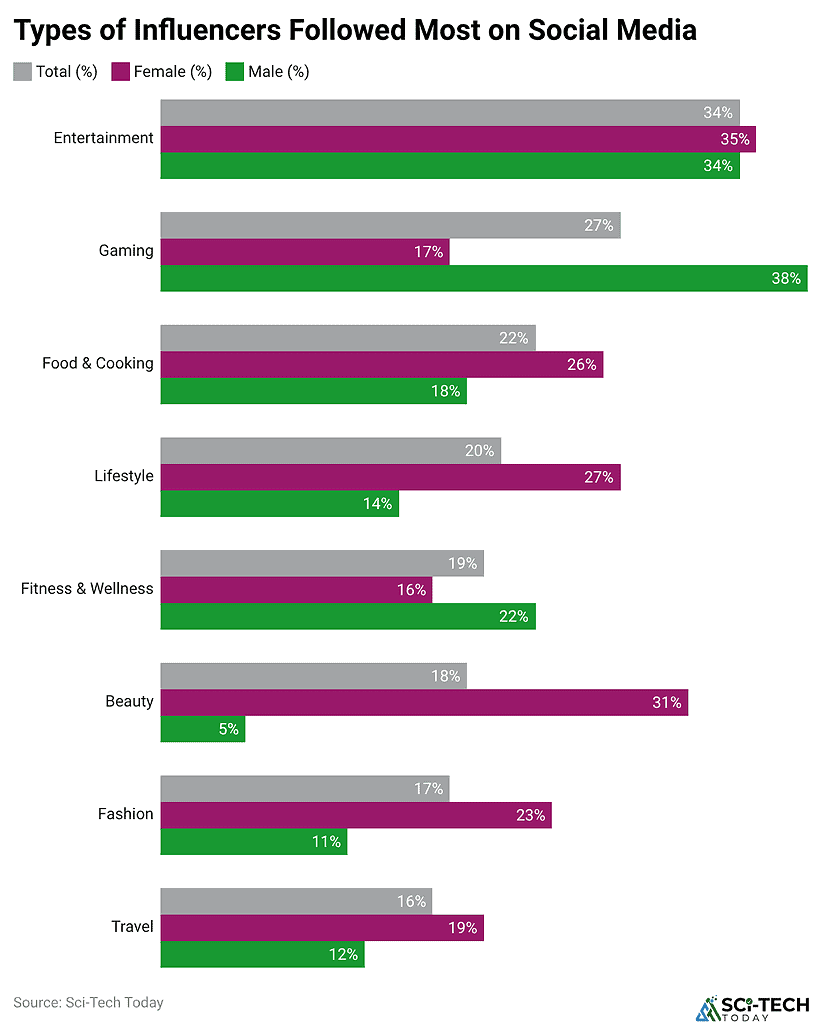
Gen Z and Millennial Users Trust In Influencer
Recommendations
(Reference: statista.com)
- Around 91% of young consumers follow influencers on social media.
- A 2026 Youth Pulse study finds that 25% of youths openly say they trust influencers, and nearly half (47%) have purchased a product based on an influencer recommendation, indicating meaningful behavioural influence even when stated trust is modest.
- Other 2025–26 research and industry commentary report that around 55–57% of Gen Z shoppers are more likely to buy from an influencer’s recommendation than from traditional brand messaging or even friends’ suggestions, underscoring creators’ strong persuasive power.
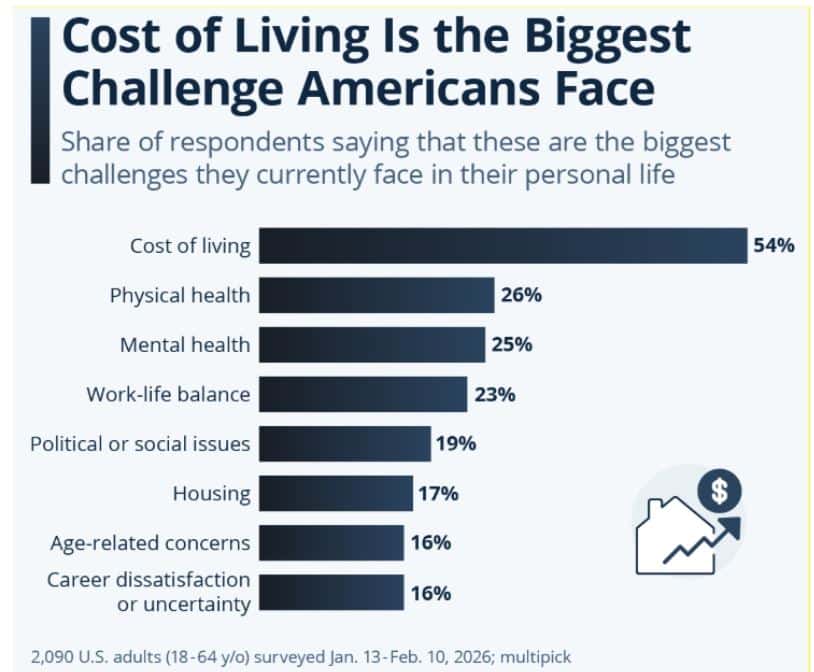
US Adults Facing Cost-of-Living Challenges
(Source: statista.com)
- Cost of living stands out as the most pressing concern, cited by 54% of respondents, highlighting how inflation, rising prices, and economic pressures dominate the daily lives of U.S. adults.
- Physical health ranks as the second biggest challenge at 26%, reflecting growing awareness of wellness, healthcare access, and the long-term effects of lifestyle-related conditions.
- Mental health closely follows at 25%, emphasizing the increasing recognition of psychological well-being and the lingering impact of stress, anxiety, and burnout in modern life.
- Work-life balance is a major struggle for 23% of Americans, signaling the difficulty of managing professional demands alongside personal and family responsibilities.
- Political or social issues concern 19% of respondents, reflecting the impact of national divisions, social movements, and policy debates on individual well-being.
- Housing challenges affect 17% of Americans, underscoring ongoing struggles with affordability, rising rents, and limited access to homeownership in many regions.
- Age-related concerns are reported by 16% of respondents, highlighting issues such as aging, retirement planning, and long-term health considerations.
- Career dissatisfaction or uncertainty is also cited by 16%, reflecting widespread concerns about job stability, career growth, and the evolving nature of the workforce.
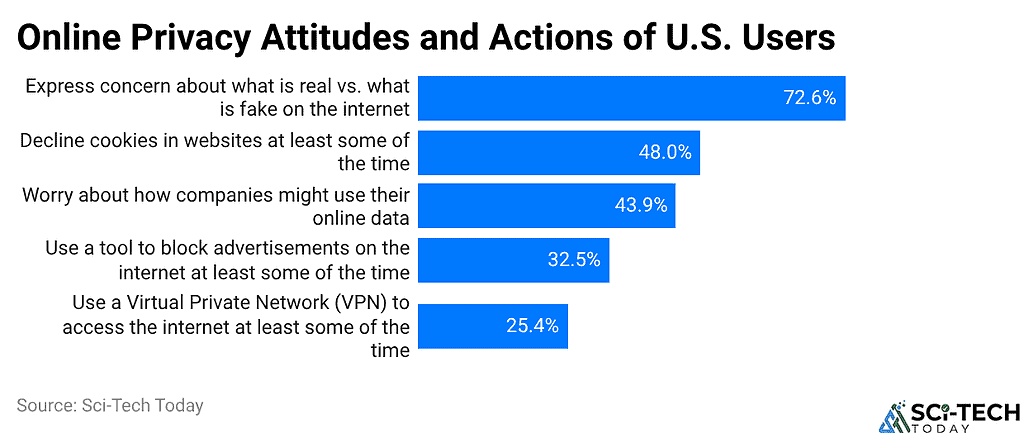
Online Privacy Attitudes And Actions Of U.S. Users
(Reference: statista.com)
- A striking 72.6% of online users express concern about distinguishing real vs. fake content on the internet, highlighting growing anxiety around misinformation, deepfakes, and the credibility of digital sources.
- 48% of internet users decline cookies on websites at least some of the time, reflecting heightened awareness of data tracking and a proactive stance toward limiting digital footprints.
- 43.9% of respondents worry about how companies might use their personal online data, signaling widespread skepticism about corporate data practices and privacy policies.
- 32.5% of users actively rely on ad-blocking tools, demonstrating a clear preference for cleaner browsing experiences and reduced exposure to targeted advertising.
- 25.4% of internet users use a VPN to access the internet at least occasionally, indicating a meaningful share of consumers prioritizing anonymity, security, and access to restricted content.
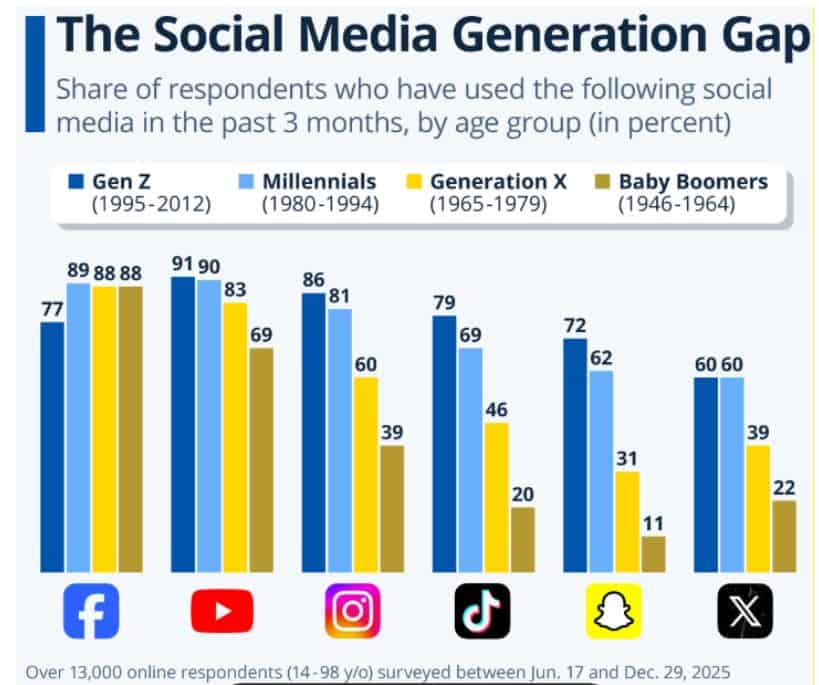
Social Media Presence By Generations
(Source: pewresearch.org)
- Facebook shows strong cross-generational appeal, with Millennials, Gen X, and Baby Boomers all at 88–89% usage, while Gen Z lags slightly behind at 77%, indicating it remains the most universally adopted platform.
- YouTube dominates across all age groups, with 91% of Gen Z, 90% of Millennials, 83% of Gen X, and 69% of Baby Boomers using it, making it the most widely consumed platform regardless of age.
- Instagram shows a clear generational divide, with 86% of Gen Z and 81% of Millennials using it, while adoption drops sharply to 60% among Gen X and just 39% among Baby Boomers.
- TikTok is heavily skewed toward younger users, with 79% of Gen Z and 69% of Millennials engaging with the platform, compared to 46% of Gen X and only 20% of Baby Boomers.
- Snapchat usage falls steeply with age, led by Gen Z at 72% and Millennials at 62%, while only 31% of Gen X and 11% of Baby Boomers use the platform.
- X (formerly Twitter) shows moderate adoption among younger generations, with both Gen Z and Millennials at 60%, dropping to 39% for Gen X and 22% for Baby Boomers.
Millennial Clothing Shopping
- On average, the Millennial man spends 59.9% more cash on clothes and shoes compared to the woman.
- According to some calculations, the Millennial man on average spends USD 318.45 on clothes and apparel on a monthly basis.
- On average, the female Millennial spends USD 199.17 monthly on clothes and footwear.
- Millennials spend an average of USD 187.14 monthly on clothing which is 28.4% more than the average consumer.
- Female clothing makes up USD 57.58 of monthly expenditures for the Millennial, and this figure is 9.34% more than that of the average consumer.
- Male clothing constitutes USD 30.58 of a Millennial’s monthly expenditure which is 1.87% less than the average expenditure.
- Footwear represents 29.1% more monthly expenditures than the average consumer’s expenditure, accounting for USD 49.58.
- The clothing of the child younger than two years old takes USD 15.25 of the Millennial’s monthly expenditure which exceeds the average monthly expenditure by 137.7%.
- The child aged 2-15 years old takes USD 34.25 of Millennial’s monthly expenditure which is 101.5% more than the average one.
Conclusion
It is said that millennials were the first generation to be introduced to the digital era. From Google’s Orkut to today’s number of social media platforms, millennials are connecting with their friends and family. Millennials on Social Media Statistics show that social media has become a part of their lives as they spend more time on such platforms.
Online media is primarily consumed for visual content. However, spending more time on the screen can lead to various health issues. Thus, in conclusion, individuals of any generation should limit their time spent on social media.
FAQ
The majority of Millennials rely on social networks on a day-to-day basis. They can be called “always-on” since the majority use social networks on a daily basis. There are numerous areas where this impacts them including social contacts, consumption of entertainment and information, informal education, and civic engagements.
Generation Z spends the greatest amount of time on social media in total and on an everyday basis. They have the largest number of social network users compared to other generations.
Statistically, it can be said that the two youngest generations which include Millennials and Generation Z have the highest average IQ levels. It is worth mentioning that IQ rates have been rising for the past years and it is called the Flynn effect.
