Introduction
Average Screen Time Statistics: Screens have become a major part of our daily lives; they have changed how people work, communicate, learn, and seek entertainment today, with the average screen time for internet users now occupying a large portion of their waking hours.
This rise in digital engagement is driven by the rapid global adoption of mobile technology, the pervasive influence of social media platforms, and the change toward remote professional and educational models.
Analyzing these detailed average screen time statistics is important for industries from public health to technology development firms. We offer concrete, data-based insights into changing consumer behavior, digital dependency, and the resulting health and societal challenges.
So, this report delivers a complete walk-around, breaking down the most current global, regional, and demographic patterns, emphasizing the facts that shape our relationship with technology. Let’s get started.
Editor’s Choice
- People worldwide currently spend an average of 6 hours and 40 minutes on internet-connected screens each day.
- The daily average screen time in the United States is notably higher than the global figure, reaching approximately 7 hours and 3 minutes for adults.
- A staggering 41% of American teenagers, aged 13 to 18, report having daily screen time that exceeds 8 hours.
- South Africa consistently records the highest national average screen time globally, with users logging an intensive average of 9 hours and 24 minutes of digital activity daily.
- The global average time dedicated solely to social media platforms is approximately 2 hours and 23 minutes per day, accounting for over 35% of an individual’s total online time.
- The average screen time for a Gen Z individual ages 16-24 is approximately 9 hours per day, making this demographic the heaviest user group.
- The average American is estimated to check their mobile phone an alarming 205 times each day, underscoring a pattern of hyperconnectivity and habitual device engagement.
- Children as young as 0 to 2 years old are already engaging with screens, with approximately 49% of this group interacting with smartphones.
- Teenagers who spend 4 or more hours on screens daily show heightened mental health risks, with 1% reporting anxiety symptoms and 25.9% reporting symptoms of depression.
- The average time spent streaming video content, including services like Netflix and YouTube, commands over 3 hours and 16 minutes of a person’s daily total average screen time.
Average Screen Time Breakdown by Device and Activity
 (Reference: cureus.com)
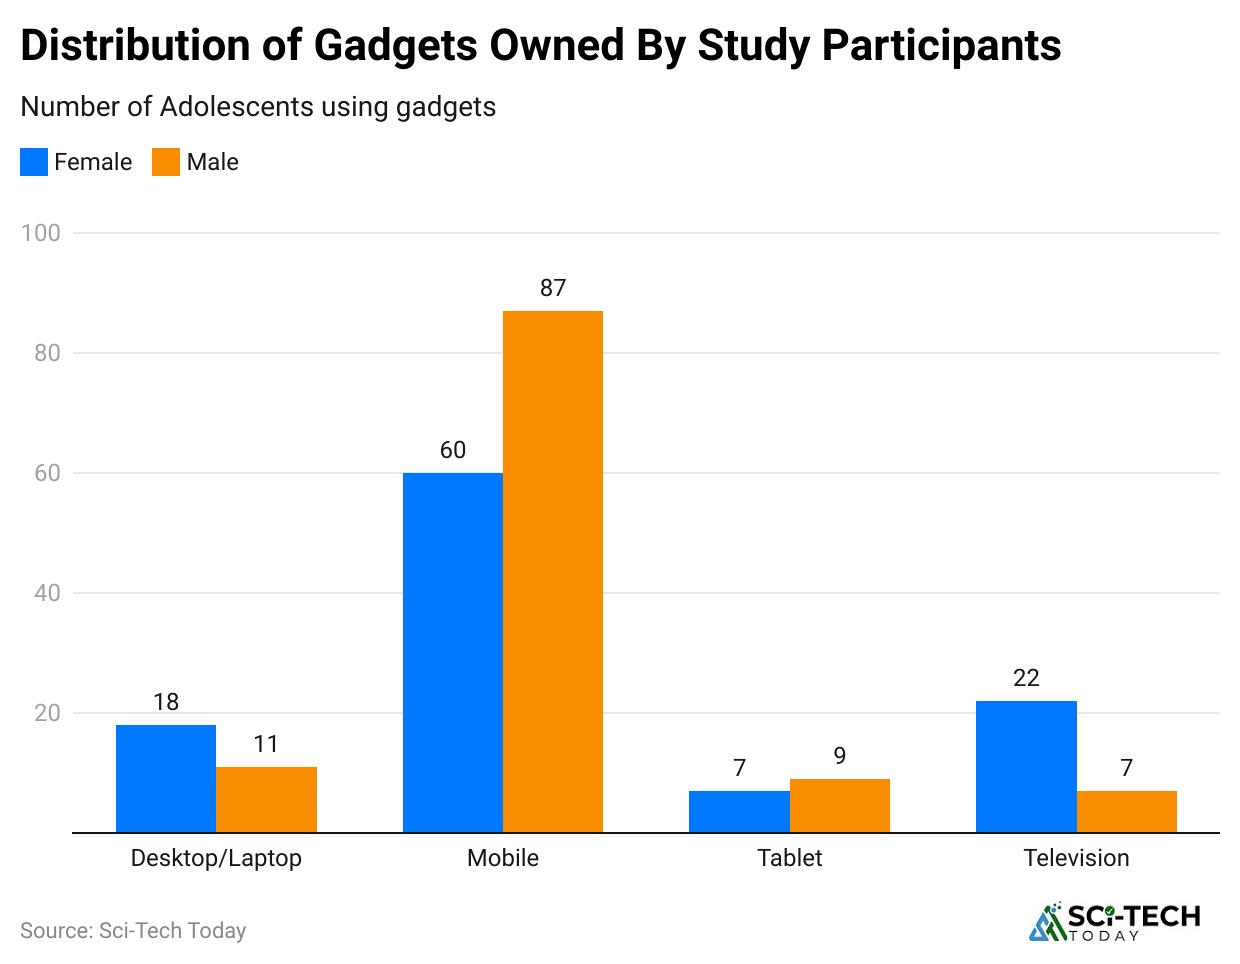
- Globally, smartphones account for the largest single share of screen time, with the average screen time on mobile devices reaching an estimated 3 hours and 46 minutes per day as of 2024.
- Time spent on desktop and laptop computers averages around 2 hours and 51 minutes daily, a segment often characterized by professional, educational, or dedicated gaming activities rather than passive browsing.
- A staggering 96.5% of the world’s 5.35 billion internet users access the web via a mobile phone.
- The single largest activity contributing to average screen time is watching television and streaming online videos, which collectively command an estimated 3 hours and 16 minutes of a user’s day.
- Daily time dedicated to social media platforms is substantial, averaging 2 hours and 27 minutes globally.
- Gaming activity adds a considerable amount to the total average screen time, estimated at approximately 1 hour and 46 minutes per day.
| Digital Activity | Global Average Screen Time Daily | Proportion of Total Time Approximate |
| Watching TV/Streaming Video | 3 hours and 16 minutes |
48.4% |
|
Social Media Usage |
2 hours and 27 minutes | 36.3% |
| Gaming Console, PC, Mobile | 1 hour and 46 minutes |
26.2% |
|
Browsing Websites Non-Social |
51 minutes | 12.6% |
| Video Chatting | 20 minutes |
4.9% |
Average Screen Time Trends
 (Reference: demandsage.com)
- As of 2024/2025, the global average screen time for internet users aged 16 to 64 stands at approximately 6 hours and 45 minutes per day, which equates to over 40% of an individual’s typical waking hours.
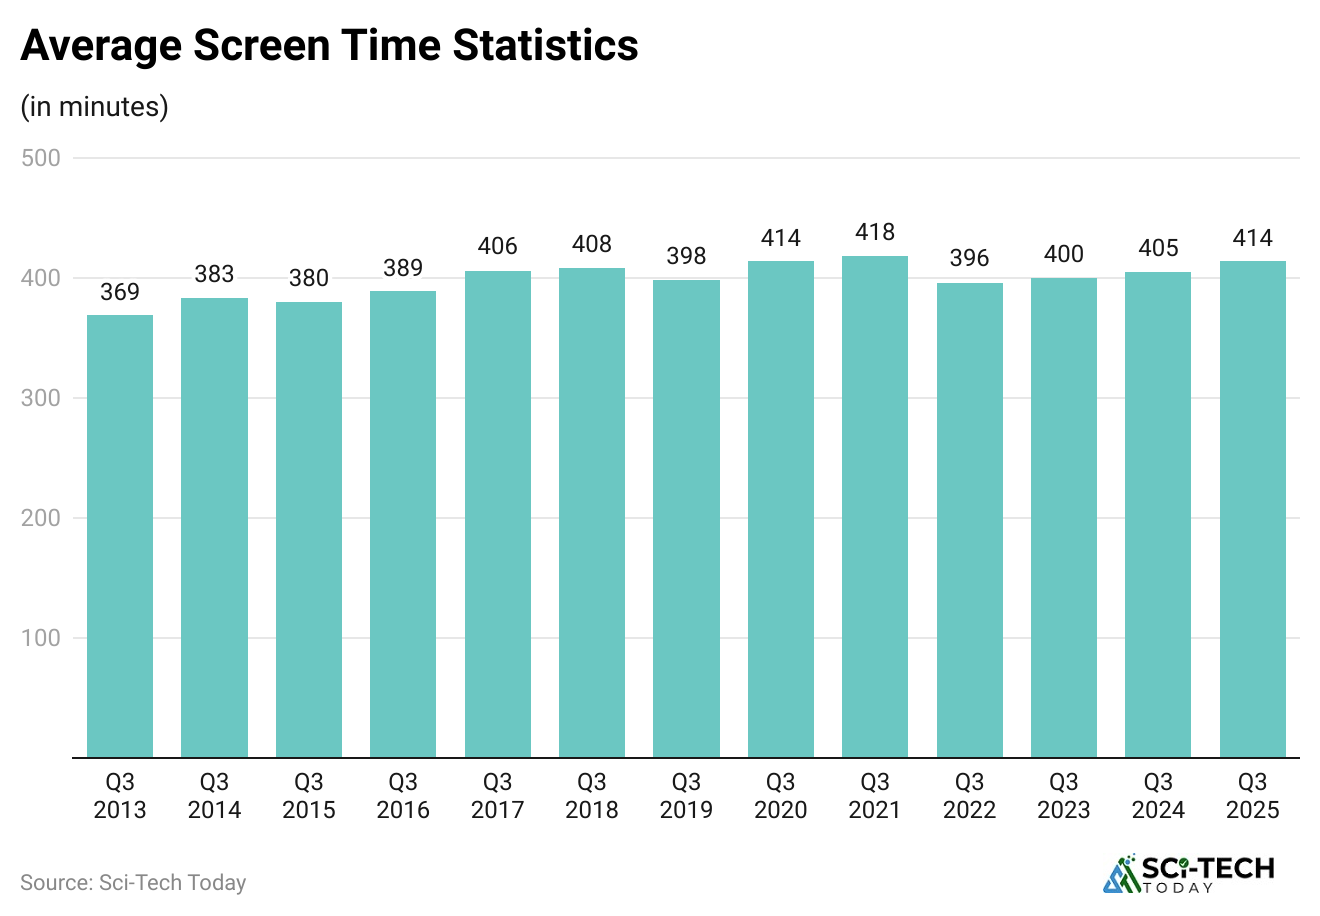
- Daily global average screen time has seen a substantial climb of nearly 45 to 50 minutes since 2013.
- The period around Q3 2021 saw a peak, reaching approximately 6 hours and 58 minutes daily, which was an approximate 1% rise over 2020.
- Following the pandemic-driven peak in 2021, the average screen time stabilized, with a slight decrease observed in Q3 2022 to 6 hours and 36 minutes, before ticking back up to the current 6 hours and 45 minutes in 2024.
- While annual fluctuations occur, the long-term trend remains positive, with projections estimating that the global daily average screen time may approach 6 hours and 54 minutes by the end of Q3 2025.
| Year/Period | Global Average Screen Time Daily | Annual Change Approximate |
| Q3 2013 | 6 hours and 9 minutes | Baseline |
| Q3 2017 | 6 hours and 46 minutes | 4.4% |
| Q3 2020 Pandemic Surge | 6 hours and 54 minutes | 4.0% |
| Q3 2022 Post-Surge Dip | 6 hours and 36 minutes | 5.1% |
| Q3 2024/2025 Current | 6 hours and 45 minutes | 1.4% Since Q3 2023 |
Geographic Disparities in Average Screen Time
 (Reference: demandsage.com)
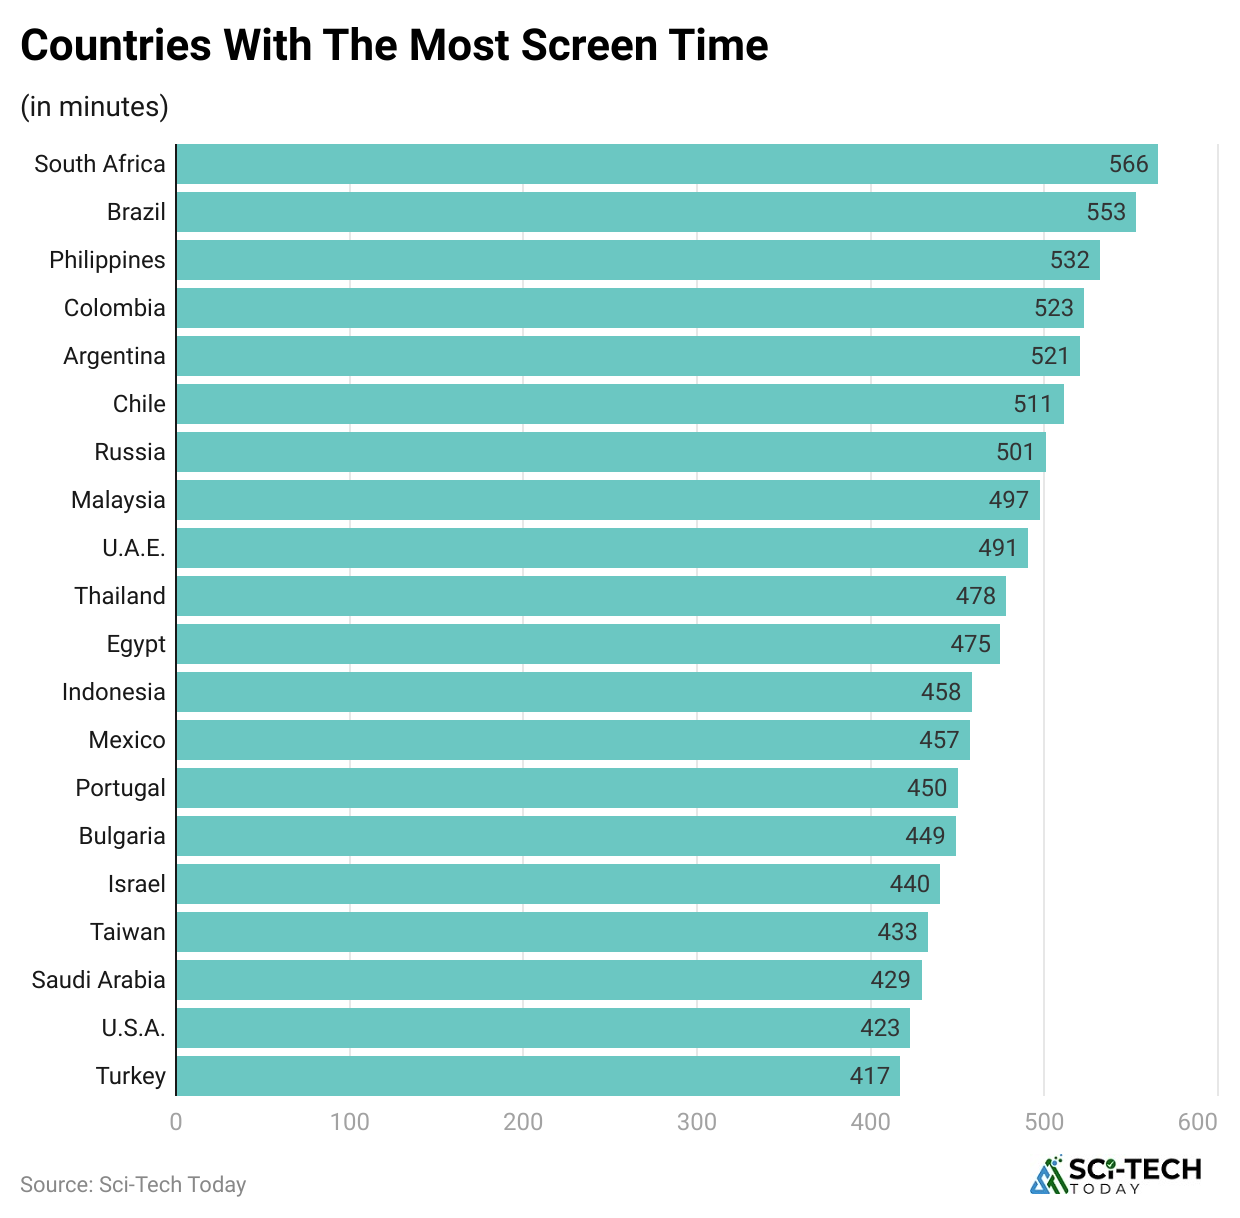
- South Africa consistently reports the highest average screen time globally, with users spending an alarming average of 9 hours and 24 minutes per day on internet-connected screens.
- Several countries follow closely behind, with Brazil reporting a daily average of 9 hours and 13 minutes and the Philippines at 8 hours and 52 minutes.
- The average screen time in the United States is slightly above the global average, recorded at approximately 7 hours and 2 minutes per day.
- Developed economies in Europe often show significantly lower average screen time figures; for instance, European countries generally average around 6 hours and 2 minutes daily, with countries like Austria and Switzerland reporting closer to 5 hours and 30 minutes.
- The global average time spent exclusively on a smartphone is approximately 4 hours and 37 minutes, while the US average sits lower at about 3 hours and 22 minutes.
| Country/Region | Total Average Screen Time Daily | Mobile Screen Time Daily |
| South Africa | 9 hours and 24 minutes | 5 hours and 11 minutes |
| Brazil | 9 hours and 13 minutes | 5 hours and 12 minutes |
| Philippines | 8 hours and 52 minutes | 5 hours and 21 minutes |
| Global Average | 6 hours and 45 minutes | 4 hours and 37 minutes |
| United States | 7 hours and 2 minutes | 3 hours and 22 minutes |
| Germany | 5 hours and 33 minutes | 2 hours and 42 minutes |
Average Screen Time by Generation
 (Source: adamconnell.me)
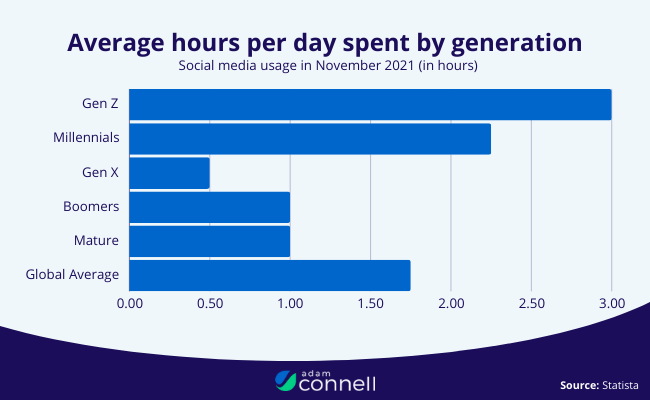
- Generation Z, typically aged 13 to 28, reports the most extensive digital engagement, logging a staggering average screen time of approximately 9 hours per day.
- Millennials ages 29 to 44 follow next, with their daily average screen time clocking in at about 6 hours and 42 minutes.
- Generation X, ages 45 to 5,9, maintains a more restrained average screen time, averaging roughly 4 hours and 10 minutes per day.
- Baby Boomers and older adults 60+ register the lowest average screen time, typically around 3 hours and 31 minutes daily..
- In the most active age bracket, 16 to 24, females record an average screen time of about 7 hours and 32 minutes daily, which is notably higher than the 7 hours and 7 minutes reported by their male counterparts.
- A significant 76% of Gen Z users admit they spend too much time on their phones, a self-awareness that contrasts with their high usage and an addictive pull felt by over half 56% of this generation
| Generation Age Range | Average Daily Screen Time | Highest Average Daily Mobile Time |
| Gen Z 13 to 28 | 9 hours | 6 hours and 27 minutes |
| Millennials 29 to 44 | 6 hours and 42 minutes | 4 hours and 36 minutes |
| Gen X 45 to 59 | 4 hours and 10 minutes | 4 hours and 9 minutes |
| Baby Boomers 60+ | 3 hours and 31 minutes | 3 hours and 31 minutes |
Children and Teen Average Screen Time Data
 (Reference: headphonesaddict.com)
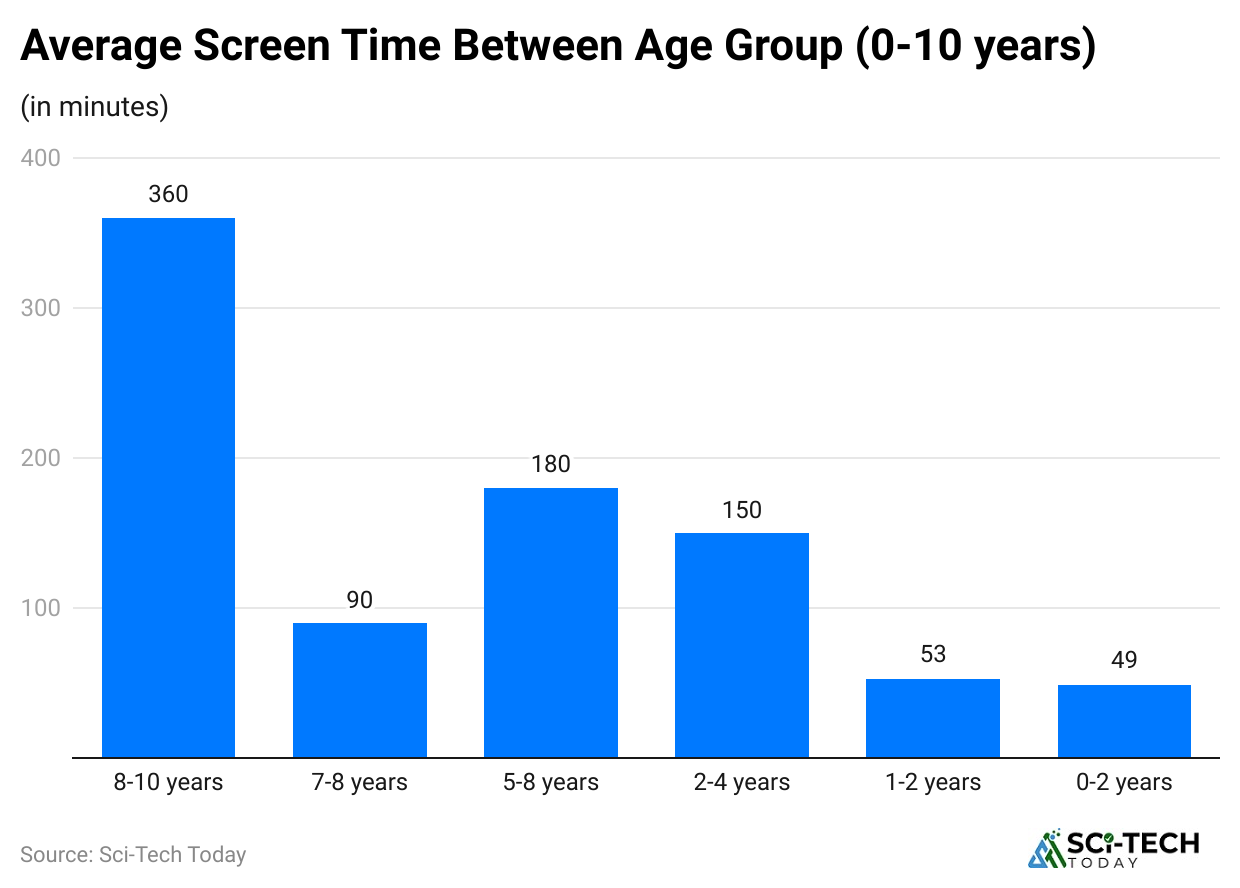
- Adolescents aged 11 to 14 exhibit alarmingly high average screen time, with estimates reaching up to 9 hours per day.
- Children in the 8 to 10 age bracket also maintain a high digital presence, spending an average screen time of approximately 6 hours daily.
- Screen exposure is starting earlier than ever, with a significant 49% of children aged 0 to 2 years already interacting with a smartphone.
- American teenagers from lower-income households earning $35,000 log a far greater daily average screen time of 9 hours and 19 minutes, which is over 2 hours more than the 7 hours and 16 minutes averaged by their higher-income peers.
- TikTok is the primary time sink for children, with an average of 1 hour and 53 minutes spent on the platform daily, followed by Snapchat at about 1 hour and 30 minutes.
- For children aged 9 to 11, the proportion who engage in gaming rises significantly, with 68% participating.
| Age Group U.S. Estimates | Average Screen Time Entertainment Only | Parental Smartphone Ownership Rate |
| Ages 0 to 2 | Approximately 2.5 hours | 40% ever interacted with a smartphone |
| Ages 8 to 10 | Approximately 6 hours | 29% of parents say their child has their own smartphone |
| Ages 11 to 14 | Approximately 9 hours | 60% of parents say their child has their own smartphone |
| Recommended Limit Ages 6+ | 2 hours | N/A |
Parental Control and Management of Average Screen Time
 (Reference: meetcircle.com)
- A concerning 40% of parents report that they do not place any concrete limits on their child’s screen time.
- Nearly half, 49% of U.S. parents admit to relying on screen time daily to manage parenting challenges, with 28% conceding that they give in to screen time multiple times a week to avert tantrums.
- A substantial 60% of parents report feeling guilty about their child’s screen time, largely citing excessive duration and the feeling of using screens as a ‘babysitter’ as the primary sources of their concern.
- Despite recommendations to limit screen time for children aged 2 to 5 to just one hour per day, only about 1 in 3 children in this age group meet these guidelines globally.
- The majority of parents 68% agree that children should generally be at least 12 years old before receiving their own smartphone, even though 60% of 11 to 12-year-olds in the U.S. already own one.
| Parental Approach to Screen Time Limits U.S. | Percentage of Parents | Implication |
| Do not set any limits | 40% | Leads to significantly higher odds of excessive screen use. |
| Set a daily limit on time | 27% | The most common form of active restriction. |
| Permit screen use only on weekends | 17% | A less common but structured approach to limiting weekday exposure. |
The Health Implications of Average Screen Time
 (Reference: allconnect.com)
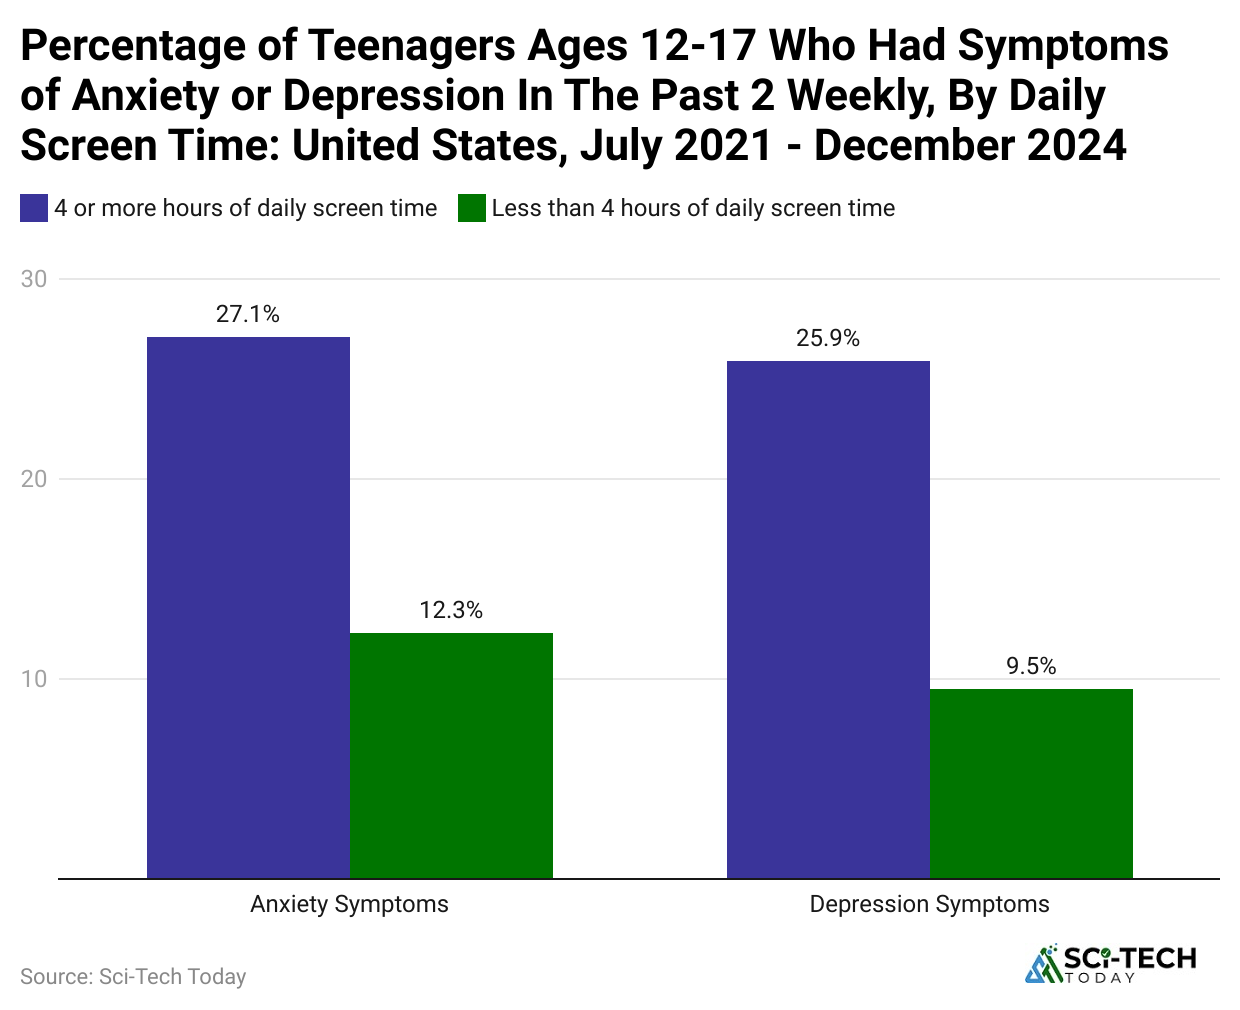
- Research indicates that 27.1% of teenagers who log 4 or more hours of daily screen time report symptoms of anxiety, while 25.9% report symptoms indicative of depression.
- Teenagers who spend 7 or more hours a day on screens are nearly twice as likely to be diagnosed with anxiety or depression compared to those with lower usage habits.
- A 2024 WHO report highlights that more than 1 in 10 adolescents 11% across European and Central Asian countries show signs of problematic social media behavior, a figure that is higher among girls 13% vs. 9% for boys.
- Only 1/3 of parents feel confident that their child’s screen time does not interfere with their sleep.
- Survey data from the US reveal that 69% of Americans have experienced a phone-related physical health issue in the past year.
- Metabolic and Sedentary Links: High screen usage correlates with increased sedentary behavior, with obesity being the most frequently cited health issue linked to excessive screen time, accounting for an estimated 23% of related cases in certain studies.
| Mental Health Indicator: Teens with 4 Hours of Screen Time | Percentage Reporting Symptoms | Correlation Strength |
| Symptoms of Anxiety | 27.1% | Significant positive correlation |
| Symptoms of Depression | 25.9% | Significant positive correlation |
| Risk of Problematic Gaming in Boys | 16% | High, especially with long sessions |
Conclusion
Overall, the analysis of average screen time confirms that digital engagement has become a deep-seated structural element of modern human behavior, with individuals globally dedicating a substantial 6 hours and 45 minutes of their day to internet-connected screens.
This metric is amplified in certain demographics, with Gen Z exceeding 9 hours daily, effectively digitizing a full workday’s worth of time outside of traditional work. While technology delivers access to information, connection, and productivity, the volume of this usage, especially the high rates of mobile-centric social media and entertainment consumption, raises vital questions for public policy, education, and health.
This data makes it undeniable: from the 49% of two-year-olds interacting with a smartphone to the 27.1% of high-screen-time teens experiencing anxiety, this kinda digital has brought about a need for conscious, data-informed approaches.
So, the future of well-being lies in digital literacy and encouraging a mindful use of technology, ensuring that screens serve as a tool for a better quality of life rather than a source of detriment. I hope you agree with my conclusion. If you find this analysis helpful, kindly share it with your friends. If you have any questions, kindly let us know in the comments section. Thanks for staying up till the end.
