
Introduction
Visual Computing Statistics: Visual computing focuses on the tools and technologies that enable the creation, editing, and understanding of different visual content such as images, videos, and graphics. This segment is a mix of hardware and software, including GPUs and specialised computing platforms, powering a huge range of industries, including gaming, VR/AR, healthcare, automotive, and entertainment. The market is expanding quickly because people want better graphics, VR/AR is becoming more common, and AI is increasingly used to process visual data. Growing digital content creation also adds to this rise.
This article on Visual Computing Statistics includes several current analyses from different perspectives that will definitely help you understand the topic and its related factors effectively.
Editor’s Choice
- The global Visual Computing market will reach around USD 39.9 billion in revenue by 2025, up from USD 33 billion in 2024.
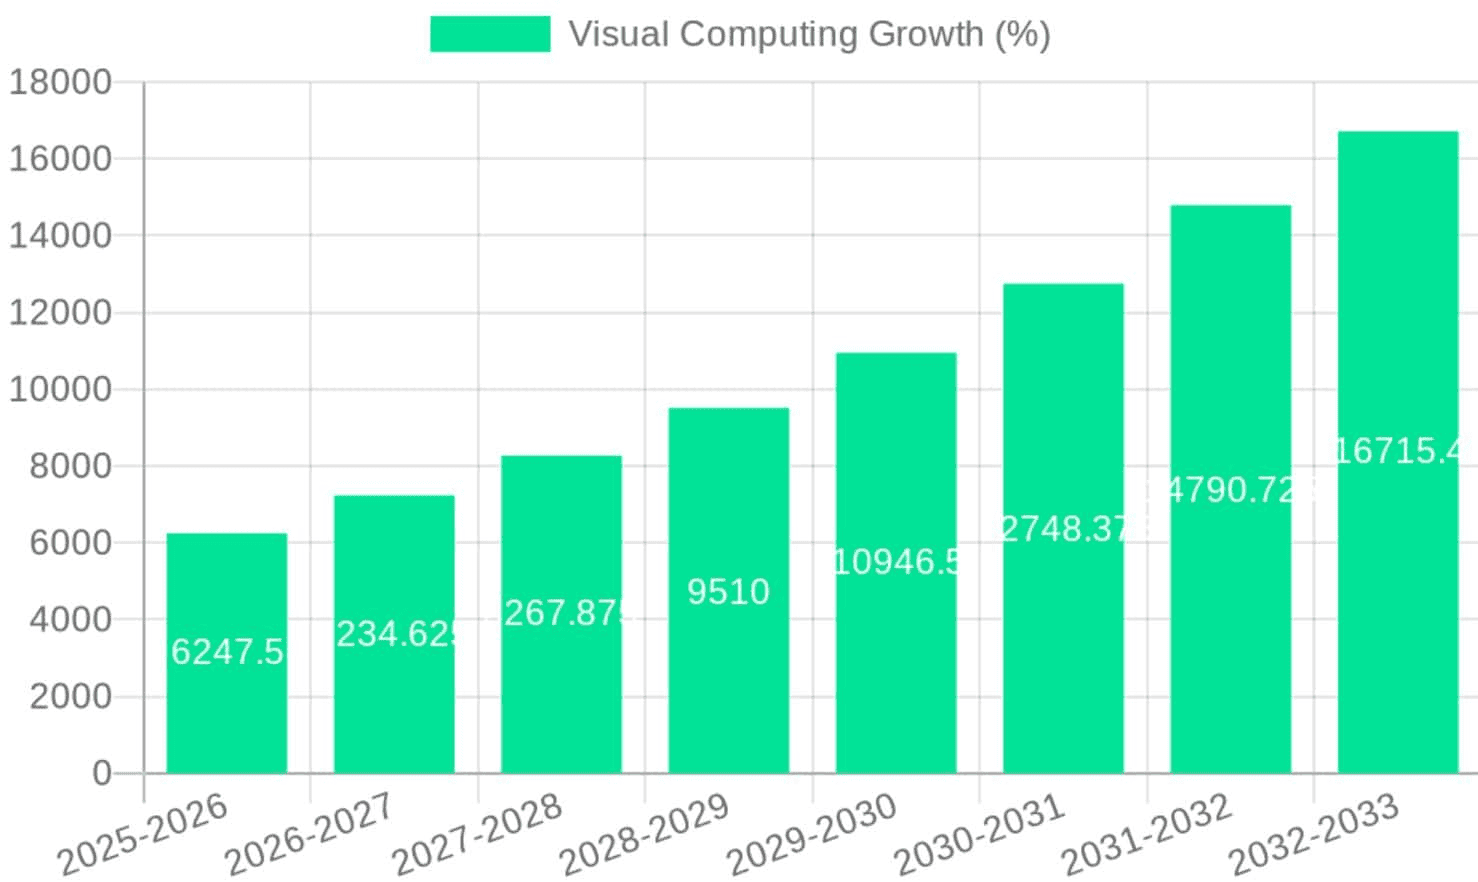
- Visual computing growth rises steadily from 6,247.5 in 2025 to 7,234.62 (2026 to 2027), 8,267.87 (2027 to 2028), 9,510 (2028 to 2029), and 10,946.5 (2029 to 2030).
- The North America visual computing market is showing strong momentum, with its value expected to rise from USD 16.2 billion in 2025 to about USD 72.1 billion by 2034, supported by a steady 18% CAGR.
- According to Future Market Insights, the United States visual computing market is estimated to reach USD 31.7 billion by 2025.
- The global computer vision market for visual computing has captured the largest share, rising from USD 25.42 billion in 2024 to around USD 57.11 billion by 2033.
- In 2025, the hardware segment accounted for 61.4% of the visual computing market.
- The monitor segment is expected to generate 38.6% of the total revenue in the visual computing market, followed by Interactive Whiteboards (15.7%).
- The Visual Computing market’s gaming segment will hold the largest share at 27.5%.
- Coherent Market Insights projects the Global Computer Graphics market to reach USD 34.47 billion by 2025.
General Visual Computing Statistics
- The Mordor Intelligence Report also stated that in 2024, hardware accounted for 68.0% of the computer vision landscape, while edge-AI chipsets are expected to rise at a 24.5% CAGR from 2025 to 2030.
- Manufacturing accounted for 37.5% that year, with automotive ADAS use anticipated to grow at a 21.0% CAGR.
- Asia-Pacific accounted for 41.0% of global activity in 2024, and the Middle East is projected to expand at a 17.2% CAGR over the same period.
- Besides, China’s 3D industrial camera field, Keyence, LMI, and Hikvision collectively secured 59.7% of the market.
- According to market.us, government-backed programs, including South Korea’s USD 1.1 billion Digital New Deal investment in AR and VR.
- Leading firms such as Niantic demonstrate the sector’s potential, earning more than USD 1 billion yearly through AR gaming.
- Tool adoption is also rising, with Unity now driving 60% of global AR/VR experiences.
- Demand for visual content remains strong, with 90% of marketers prioritising short-form video.
- Niantic’s consistent USD 1 billion annual revenue further highlights AR’s profitability.
Visual Computing Market Size
(Source: sp-ao.shortpixel.ai)
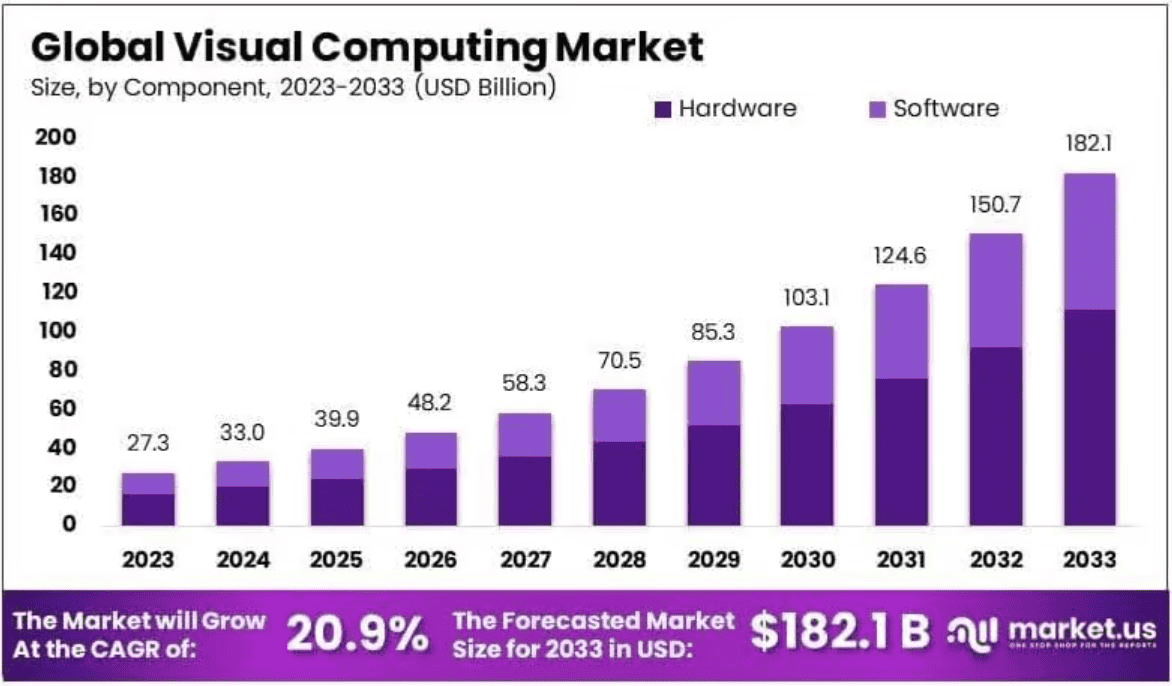
- The global Visual Computing market is expected to reach around USD 39.9 billion in revenue by 2025, up from USD 33 billion in 2024.
- In the coming years, the market is estimated to reach around USD 48.2 billion by 2026, USD 58.3 billion by 2027, USD 70.5 billion by 2028, USD 85.3 billion by 2029, USD 103.1 billion by 2030, USD 124.6 billion by 2031, USD 150.7 billion by 2032, and USD 182.1 billion by 2033.
- Additionally, the market will grow at a CAGR of 20.9% from 2024 to 2033.
Visual Computing Growth Statistics
(Source: multisite-public.s3.ap-south-1.amazonaws.com)
- Visual computing growth rises steadily from 6,247.5 in 2025 to 7,234.62 (2026 to 2027), 8,267.87 (2027 to 2028), 9,510 (2028 to 2029), and 10,946.5 (2029 to 2030).
- It continues to reach 12,748.37 in 2030 to 2031, 14,790.72 in 2031 to 2032, and ultimately to 16,715.4 (2032 to 2033).
- These gains reflect year-over-year growth rates of 15.80%, 14.28%, 15.02%, 15.11%, 16.46%, 16.02%, and 13.01%.
Visual Computing Market Revenue By Region
- According to Consainsights.com, in the North American region, the Visual Computing market revenue totalled USD 13.42 billion in 2023 and is estimated to reach approximately USD 34.99 billion by 2033.
Moreover, other regional revenue analyses are mentioned below:
|
Region
|
2023 | 2033 (expected) |
| Market Valuations (USD billion) |
||
| Europe | 9.37 | 24.45 |
| Asia Pacific | 6.54 | 17.05 |
| Middle East & Africa | 4.27 | 11.15 |
| South America | 0.90 | 2.34 |
By Technology
(Reference: consainsights.com)
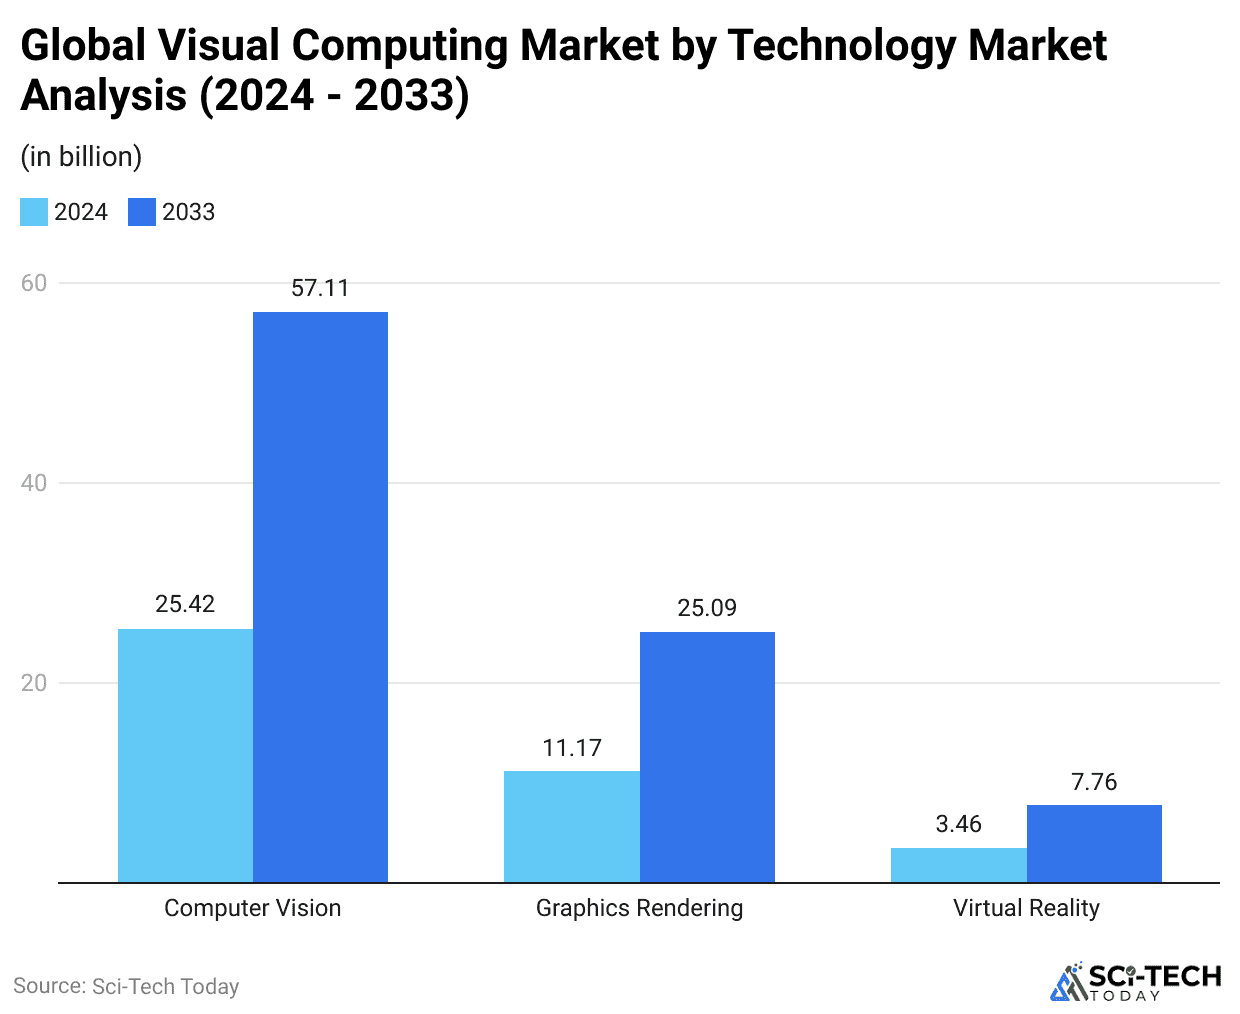
- The global computer vision market for visual computing has captured the largest share, rising from USD 25.42 billion in 2024 to around USD 57.11 billion by 2033.
|
Technology
|
2024 | 2033 |
| Market revenue (USD billion) |
||
| Graphics Rendering | 11.17 | 25.09 |
| Virtual Reality | 3.46 | 7.76 |
Visual Computing Market Share Statistics By Components
(Source: futuremarketinsights.com)
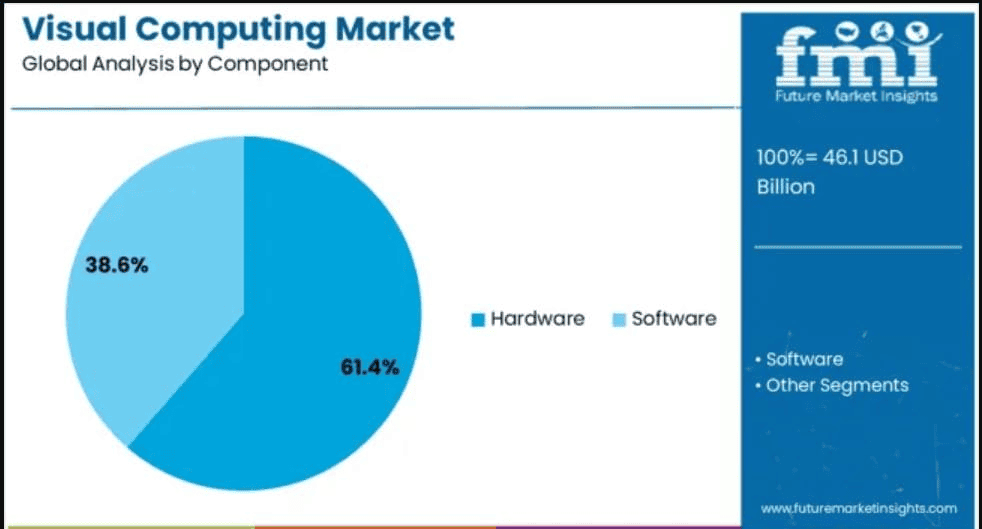
- In 2025, the hardware segment held 61.4% of the visual computing market.
- Meanwhile, the software segment will make up the remaining 38.6%.
By Display Platform
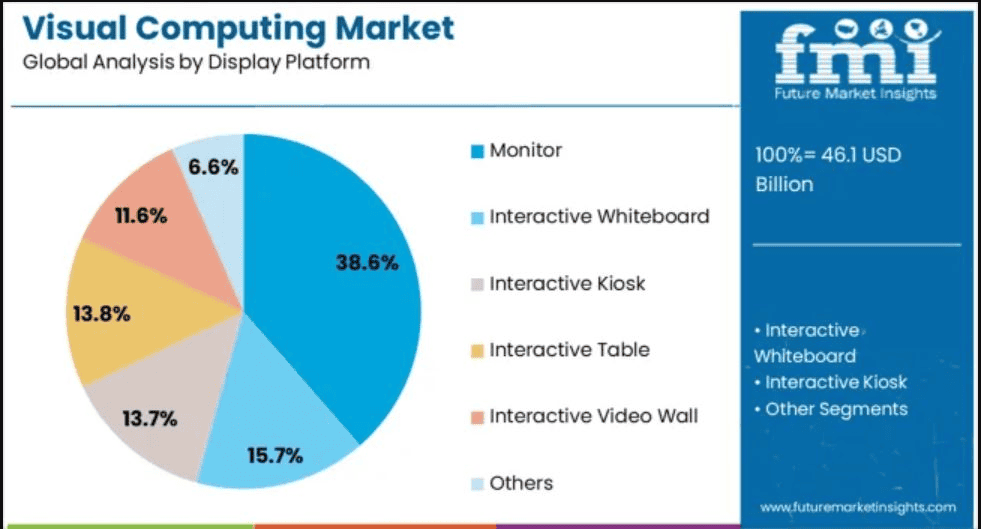
(Source: futuremarketinsights.com)
- Over the same period, the monitor segment is expected to generate 38.6% of the total revenue in the visual computing market, followed by Interactive Whiteboards (15.7%).
- Furthermore, other display platforms market shares are estimated as Interactive Table (13.8%), Interactive Kiosk (13.7%), Interactive Video Wall (11.6%), and the rest (6.6%).
By Industry
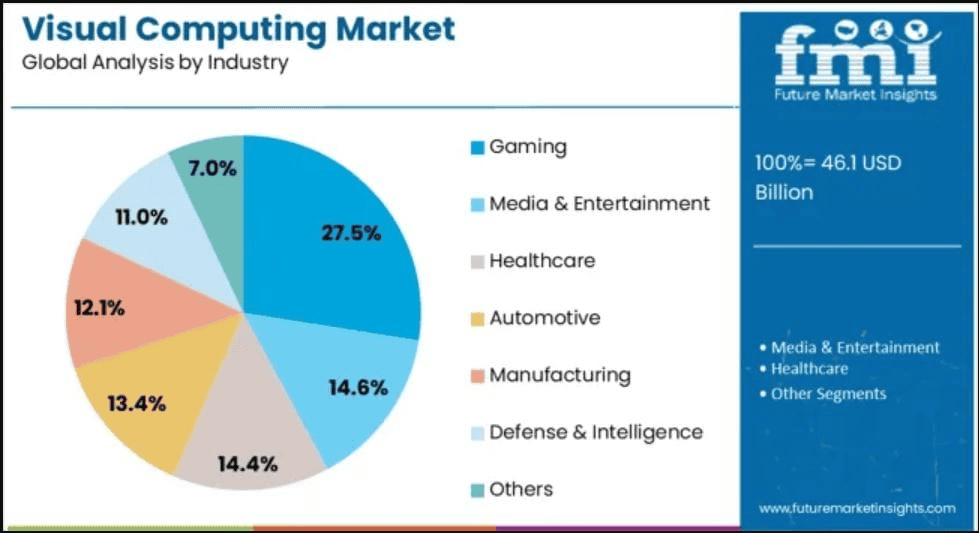
(Source: futuremarketinsights.com)
- As of 2025, the Visual Computing market’s gaming segment will hold the largest share at 27.5%.
- Meanwhile, media & entertainment will account for 14.6%, followed by healthcare (14.4%), automotive (13.4%), manufacturing (12.1%), defense & intelligence (11%), and other (7%).
North American Visual Computing Market Statistics
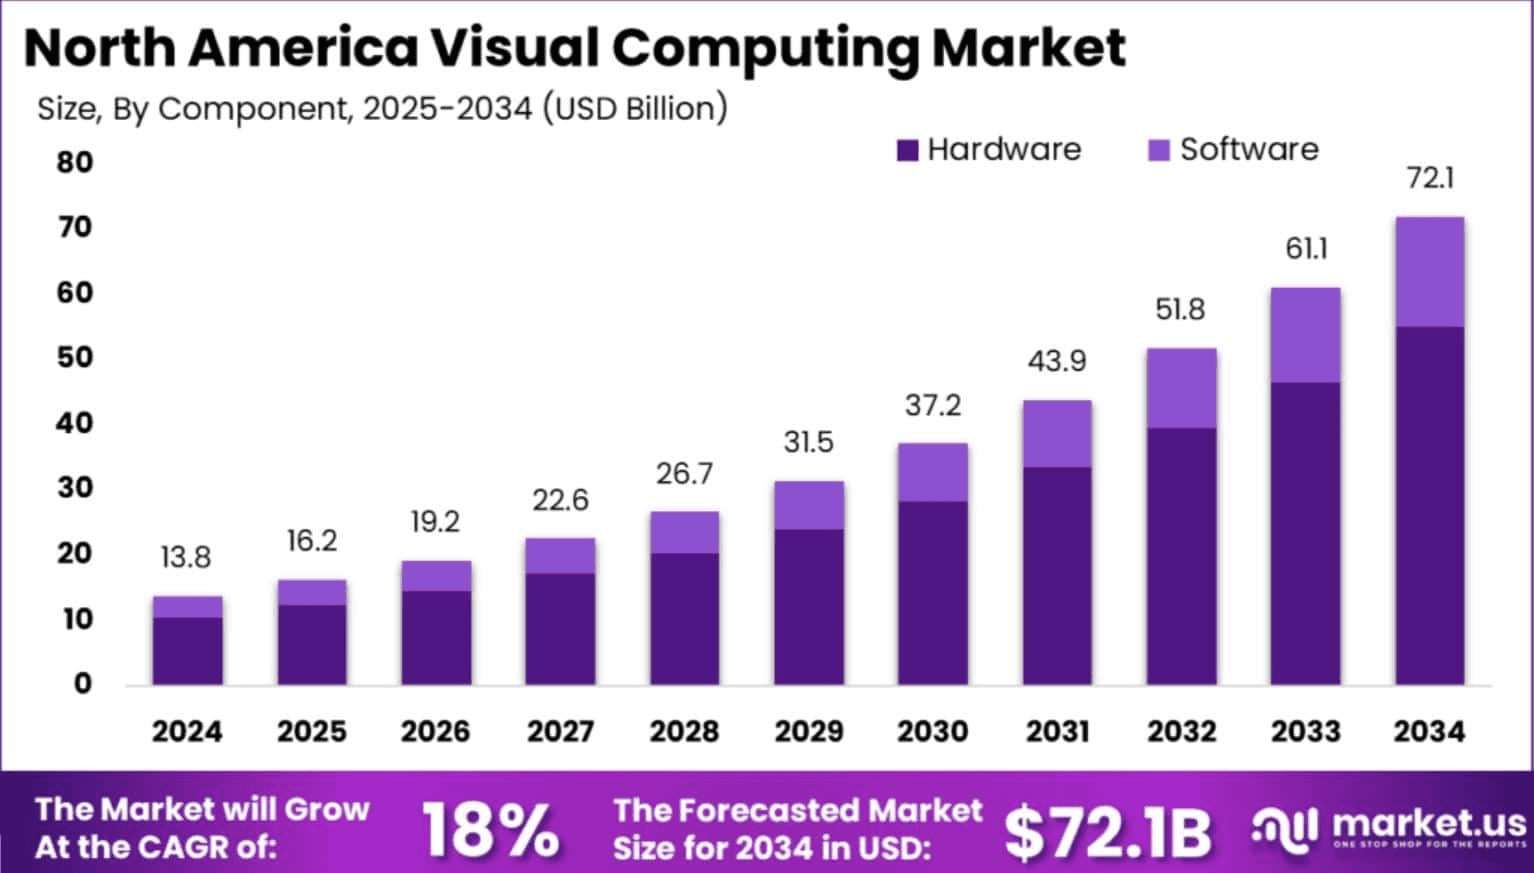
(Source: market.us)
- The North America visual computing market is showing strong momentum, with its value expected to rise from USD 16.2 billion in 2025 to about USD 72.1 billion by 2034, supported by a steady 18% CAGR.
- In the U.S., the market was already significant in 2024 at USD 12.16 billion, and forecasts suggest it will grow from USD 14.32 billion in 2025 to nearly USD 62.57 billion by 2034, expanding at a 17.8% CAGR during the same period.
- In 2024, hardware led the visual computing market at 76.4%, while interactive kiosks accounted for over 50% of usage across industries.
- Computer vision held a strong position at 32.2%, and the IT & Telecom sector accounted for approximately 37.5%.
- Key components continued to evolve: GPU share increased from 13.6% to 15.4%, while processor share rose from 17.3% to 18.2%.
- Display panel shipments dipped slightly from 37.2% in 2019 to 35.7% in 2024, and software edged down from 14.6% to 14.0%.
- Meanwhile, cloud solutions grew from 20.5% to 21.3%, and services rose from 8.9% to 9.6%.
United States Visual Computing Market Statistics
- According to Future Market Insights, the United States visual computing market is estimated to reach USD 31.7 billion by 2025.
- The market valuations in the next few years are estimated at USD 36.1 billion (2026), USD 41.2 billion (2027), USD 47.3 billion (2028), USD 55 billion (2029), USD 64 billion (2030), USD 74.6 billion (2031), USD 86.7 billion (2032), USD 100.4 billion (2033), USD 116.4 billion (2034) and USD 135.7 billion (2035).
- The market will grow at a CAGR of 15.6% from 2025 to 2035.
Computer Vision Market Revenue Statistics
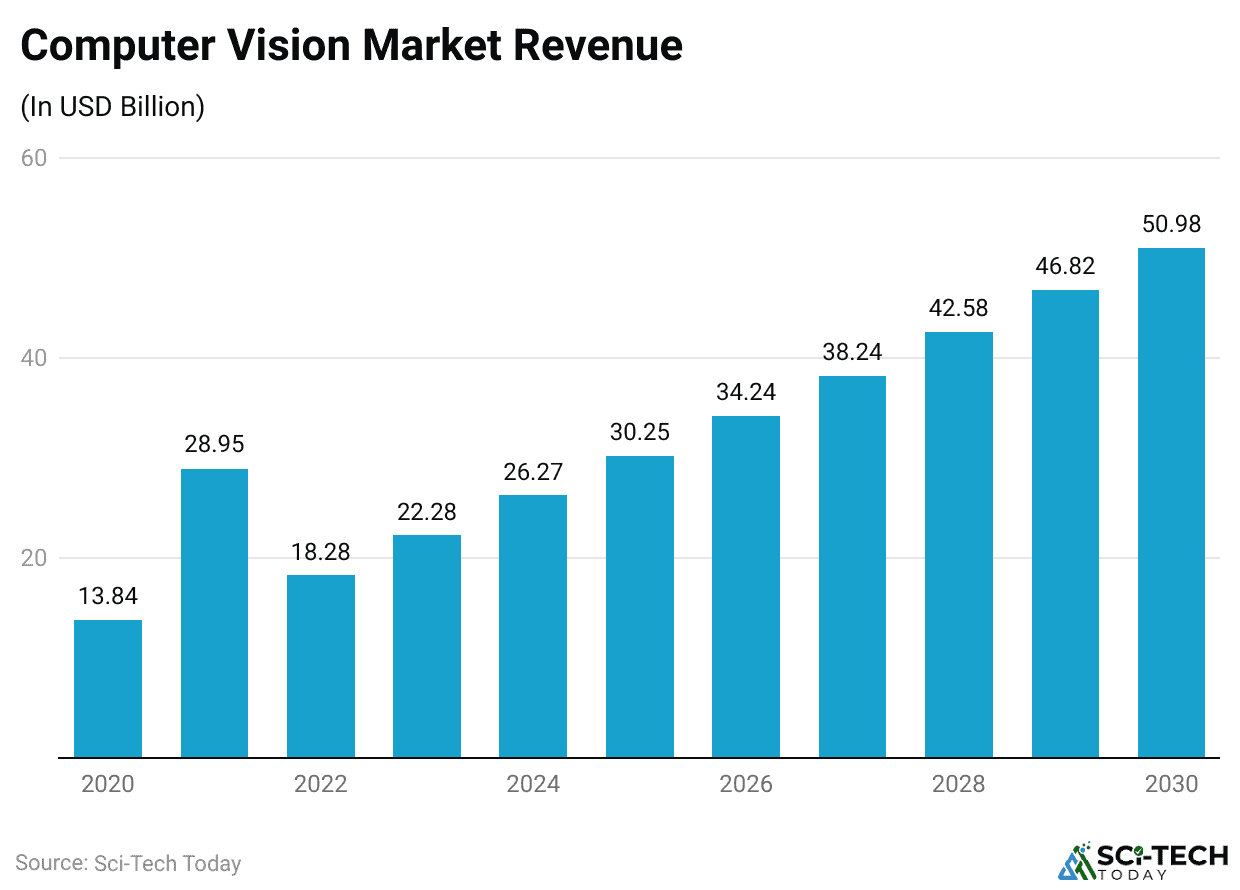
(Reference: scoop.market.us)
- The above chart shows the global Computer Vision market revenue reached USD 13.84 billion in 2020, followed by USD 28.95 billion (2021), USD 18.28 billion (2022), USD 22.28 billion (2023), and USD 26.27 billion (2024).
- From 2025 onward, revenue continues to grow to around 30.25 billion by 2025.
- The revenue analysis for the coming years is as follows: USD 34.24 billion (2026), USD 38.24 billion (2027), USD 42.58 billion (2028), USD 46.82 billion (2029), and USD 50.98 billion (2030).
By Types
- In 2025, the Computer Vision Market Revenue by type includes USD 10.3 billion from speech recognition, USD 13.5 billion from image recognition, and USD 6.5 billion from facial recognition.
Revenue analysis is stated in the table below:
|
Year
|
Speech recognition | Image recognition | Facial recognition |
| Revenue (USD billion) | |||
| 2026 | 12 | 15 | 7.2 |
| 2027 | 13.7 | 16.5 | 8 |
| 2028 | 15.7 | 18.1 | 8.8 |
| 2029 | 17.7 | 19.6 | 9.6 |
| 2030 | 19.6 | 21.1 | 10.3 |
Computer Graphics Market Statistics
- Coherent Market Insights projects the Global Computer Graphics market to reach USD 34.47 billion by 2025.
- By 2032, the market is forecast to grow to USD 52.52 billion, with a 6.2% CAGR from 2025 to 2032.
- In 2025, the software segment is expected to lead the market with 55.4%, while the Computer-Aided Design (CAD) segment will dominate with 34.3%.
- Regionally, the Asia Pacific is estimated to hold 33.5%, followed by North America at 27.4%.
- In March 2025, AMD acquired ZT Systems, a provider of AI and compute infrastructure.
Sustainable Initiatives of Visual Computing
- Green computing reduces energy use, limits e-waste, and uses resources efficiently throughout a device’s lifecycle.
- Making some modern chips can emit about 60–125 kg of CO₂ per CPU.
- VRVis, a research group working in visual computing, says its projects help meet 13 of the 17 UN Sustainable Development Goals.
- In one green-building project, VR with sensors improved energy-use predictions by 20% and lowered real energy use by 15%.
- Worldwide, data centres release around 100 megatons of CO₂ every year, roughly 2% of global emissions.
Conclusion
After completing the article on Visual Computing Statistics, it is clear that it allows linking human vision with digital systems and reshaping. Emerging fields such as computer vision, graphics, and interactive technologies open new avenues for science, business, and daily life. These developments help people make sense of data more easily, enable the creation of believable virtual worlds, and encourage new creative ideas.
Progress in this field can only move forward responsibly when experts from various areas work together. With growing dependence on data, digital advancements are becoming more engaging and interesting through visual computing.
