





First Glance
Ocean Pollution Statistics: The ocean is always at the center of the health of our planet. It covers more than 70% of Earth’s surface and plays a significant role in providing us with food, oxygen, jobs, and even the climate we live in. But here’s the very harsh truth: the ocean is also turning into a dumping ground. That’s where these ocean pollution statistics really open our eyes.
Every year, millions of tons of plastic, oil, chemicals, and other waste end up in the water. Some of it floats around where we can see it, but most of it breaks into tiny pieces and hides in the food chain, affecting fish, birds, and even humans. The more you look at these ocean pollution statistics, the more shocking it gets.
In this article, I’m going to take you through the most important ocean pollution statistics available today. From where all this pollution comes from, to how much is already in the sea, how it affects marine life, and what is being done to clean it up. We’ll look at it word by word, and I’ll keep it straightforward, so that by the end, you’ll have a clear picture of just how serious the situation is. Let’s break it down.
What Caught the Editor’s Eye
- Global plastic production reached approximately 460 million tonnes in 2024, with an estimated 8 to 10 million metric tons still entering the ocean annually.
- Right now, the oceans are holding between 75 and 199 million tons of plastic waste, and it’s growing every year.
- Garbage Patch contains approximately 1.8 trillion pieces of plastic, weighing roughly 100,000 tonnes (100 million kilograms).
- Around 100 million marine animals die every year because of plastic pollution, and at least 1 in 3 marine mammal species are affected by entanglement.
- There are nearly 500 dead zones in the world’s oceans due to nutrient pollution, covering an area of about 250,000 square kilometers.
- Microplastics are everywhere. Studies show that 90% of plastics by count in open water are microplastics, and they are entering the food chain.
- Rivers are a major source, with just 1,000 rivers responsible for almost 80% of plastic inflow into the ocean.
- Oil spills have decreased over the decades, but still, 600,000 tons of oil seep naturally into oceans every year, and accidental spills continue.
- Less than 3% of oceans are highly protected, while 90% of coral reefs are at risk by 2050.
- Cleanup efforts like the Ocean Cleanup Project are aiming to remove 90% of floating ocean plastic by 2040, but prevention is still more effective.
| Key Aspect | Fact |
| Global plastic production | 460 million tons per year |
|
Plastic enters oceans annually | 8 to 10 million tons |
| Plastic is currently in the oceans |
75 to 199 million tons |
|
Great Pacific Garbage Patch | 1.8 trillion pieces, 100 million kg, area twice that of Texas |
| Marine animal deaths |
100 million per year |
|
Marine mammals affected | 1 in 3 species is entangled |
| Microplastics in open water |
90% of plastic by count |
|
Rivers’ contribution | 1,000 rivers are equal to 80% of ocean plastic inflow |
| Dead zones from nutrient pollution |
500 zones, 25,000 km total |
|
Oil entering oceans | 600,000 tonnes naturally + 2,000 tonnes spills |
| Coral reefs at risk |
90% by 2050 |
|
Protected ocean areas | 3% highly protected |
| Major cleanup goal |
90% of floating plastic removed by 2040 (The Ocean Cleanup) |
Scale of the Problem
(Source: worldoceanreview.com)
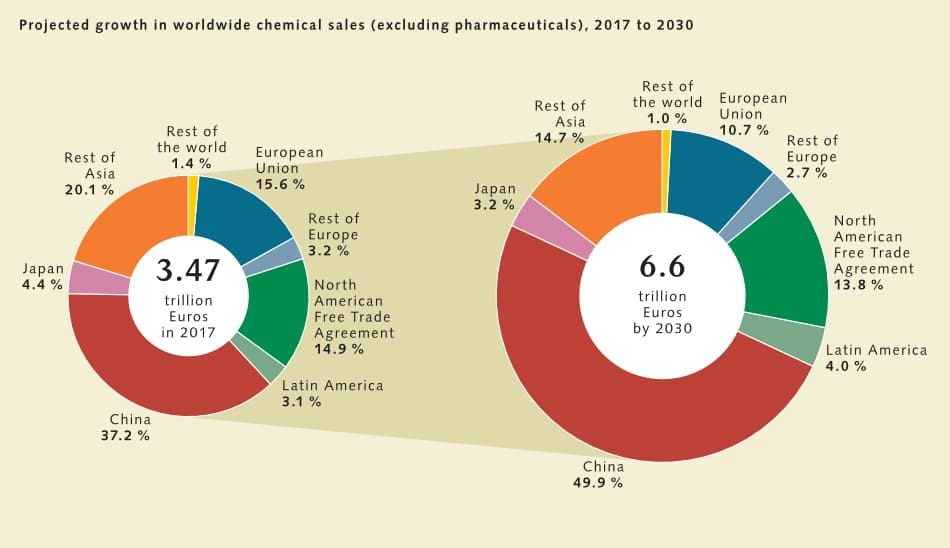
- Plastic production started small, like 2 million tons a year in 1950, but now has exploded to over 460 million tons annually. That’s more than 200-fold growth, and it keeps accelerating.
- Since 1950, we’ve made over 10 billion tons of plastic. Half went straight to landfills, and only around 9% got recycled.
- And each year, we produce roughly 350 million tons of plastic waste globally, with between 4.8 and 12.7 million tons ending up in the sea.
| Metric | Figure |
| Annual plastic production (1950 vs now) | 2 Mt vs. 460 Mt per year |
| Cumulative production since 1950 | 10Gt total plastic made |
| Recycling rate | 9% recycled; 50% to landfills |
| Annual plastic waste to the ocean | 4.8 to 12/7 million tons |
How Much Plastic Is Actually in the Oceans?
(Source: theoceancleanup.com)
- Estimates suggest that there are between 75 and 199 million tons of plastic and waste floating around in the oceans right now.
- Every year, another 8 to 10 million metric tons flow into the ocean, so it’s not slowing down.
- Then you have microplastics hiding everywhere. One study says 1 to 2 million tons enter each year, which is around 0.5% of annual plastic waste.
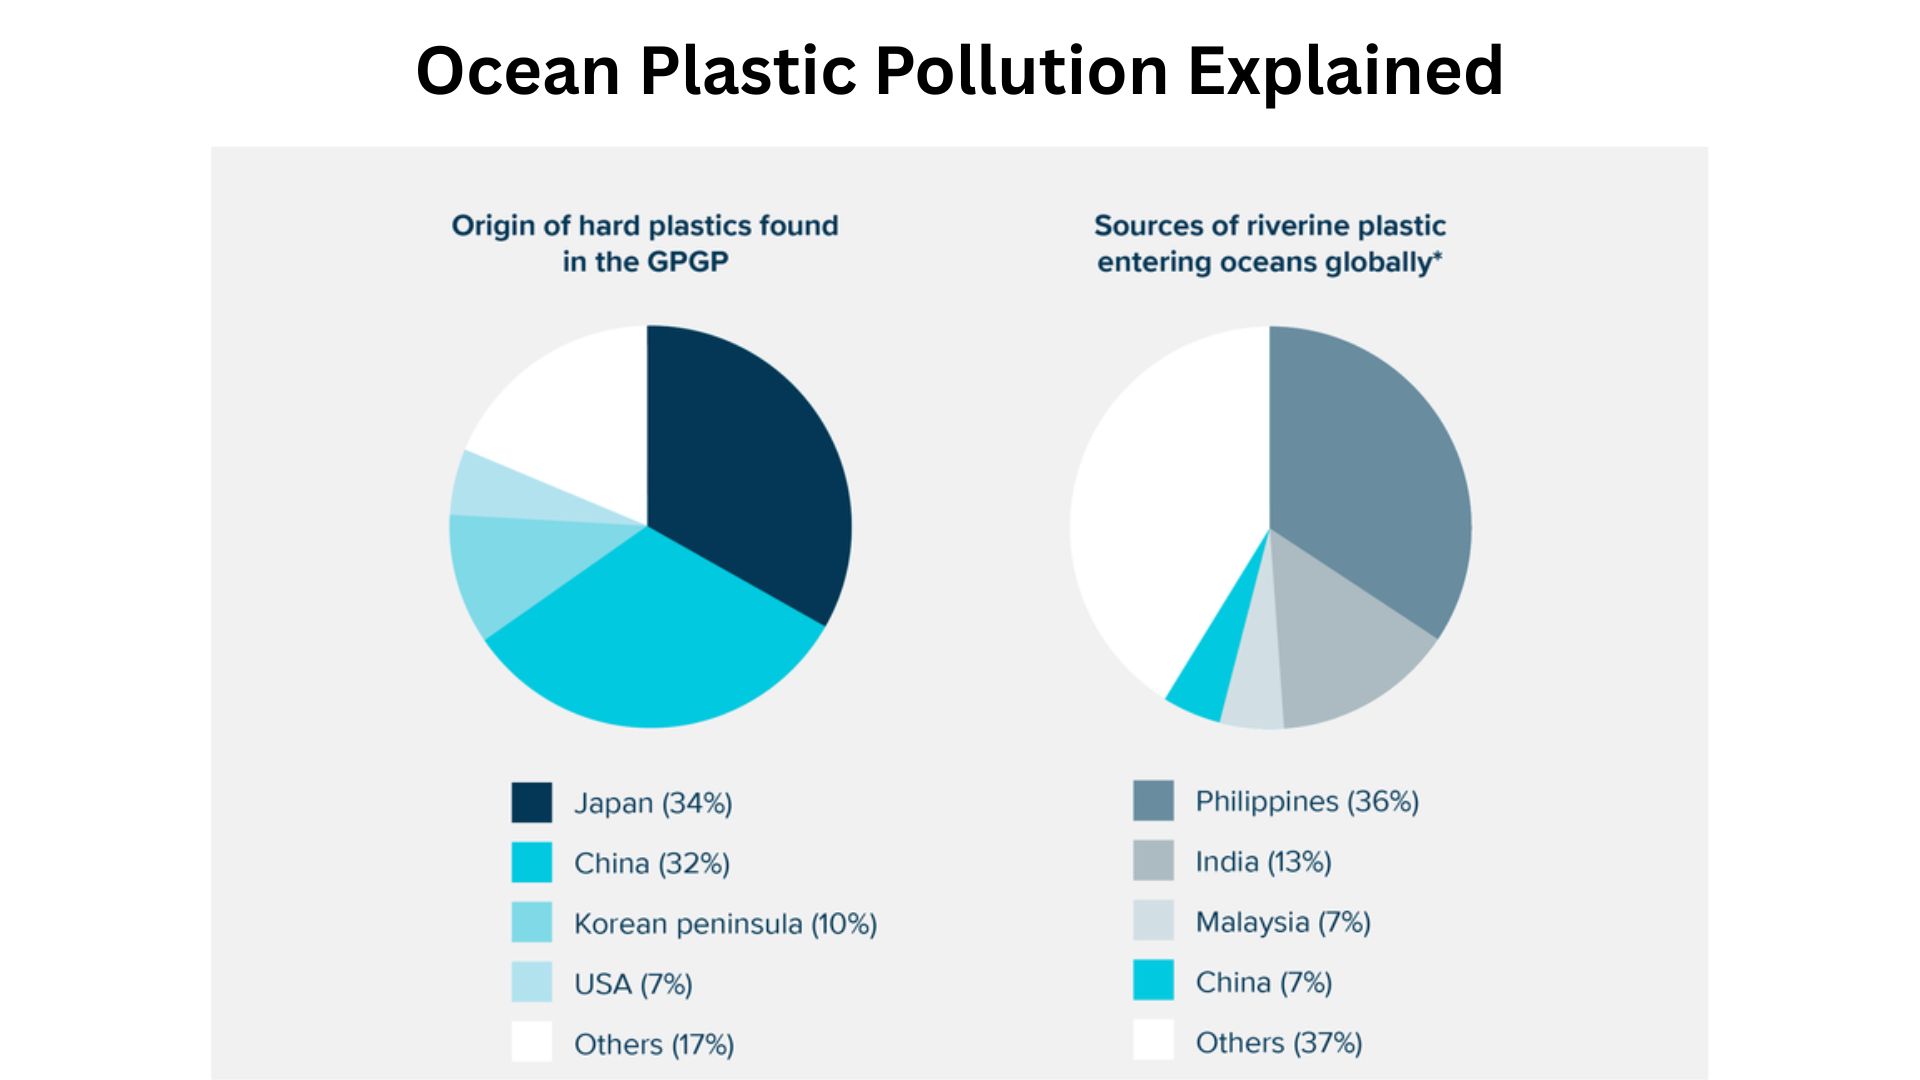
- Jakarta and Southeast Asia, as well as others, including India (10.2 million tons annually), produce a significant chunk of that waste globally.
| Metric | Figure |
| Plastic is currently in the ocean | 75 to 199 million tonnes |
| Annual inflow to the ocean | 8 to 10 million tonnes |
| Shares from mismanaged waste | 0.5% of total plastic waste |
Garbage Patches and Gyres
(Source: mdpi.com)
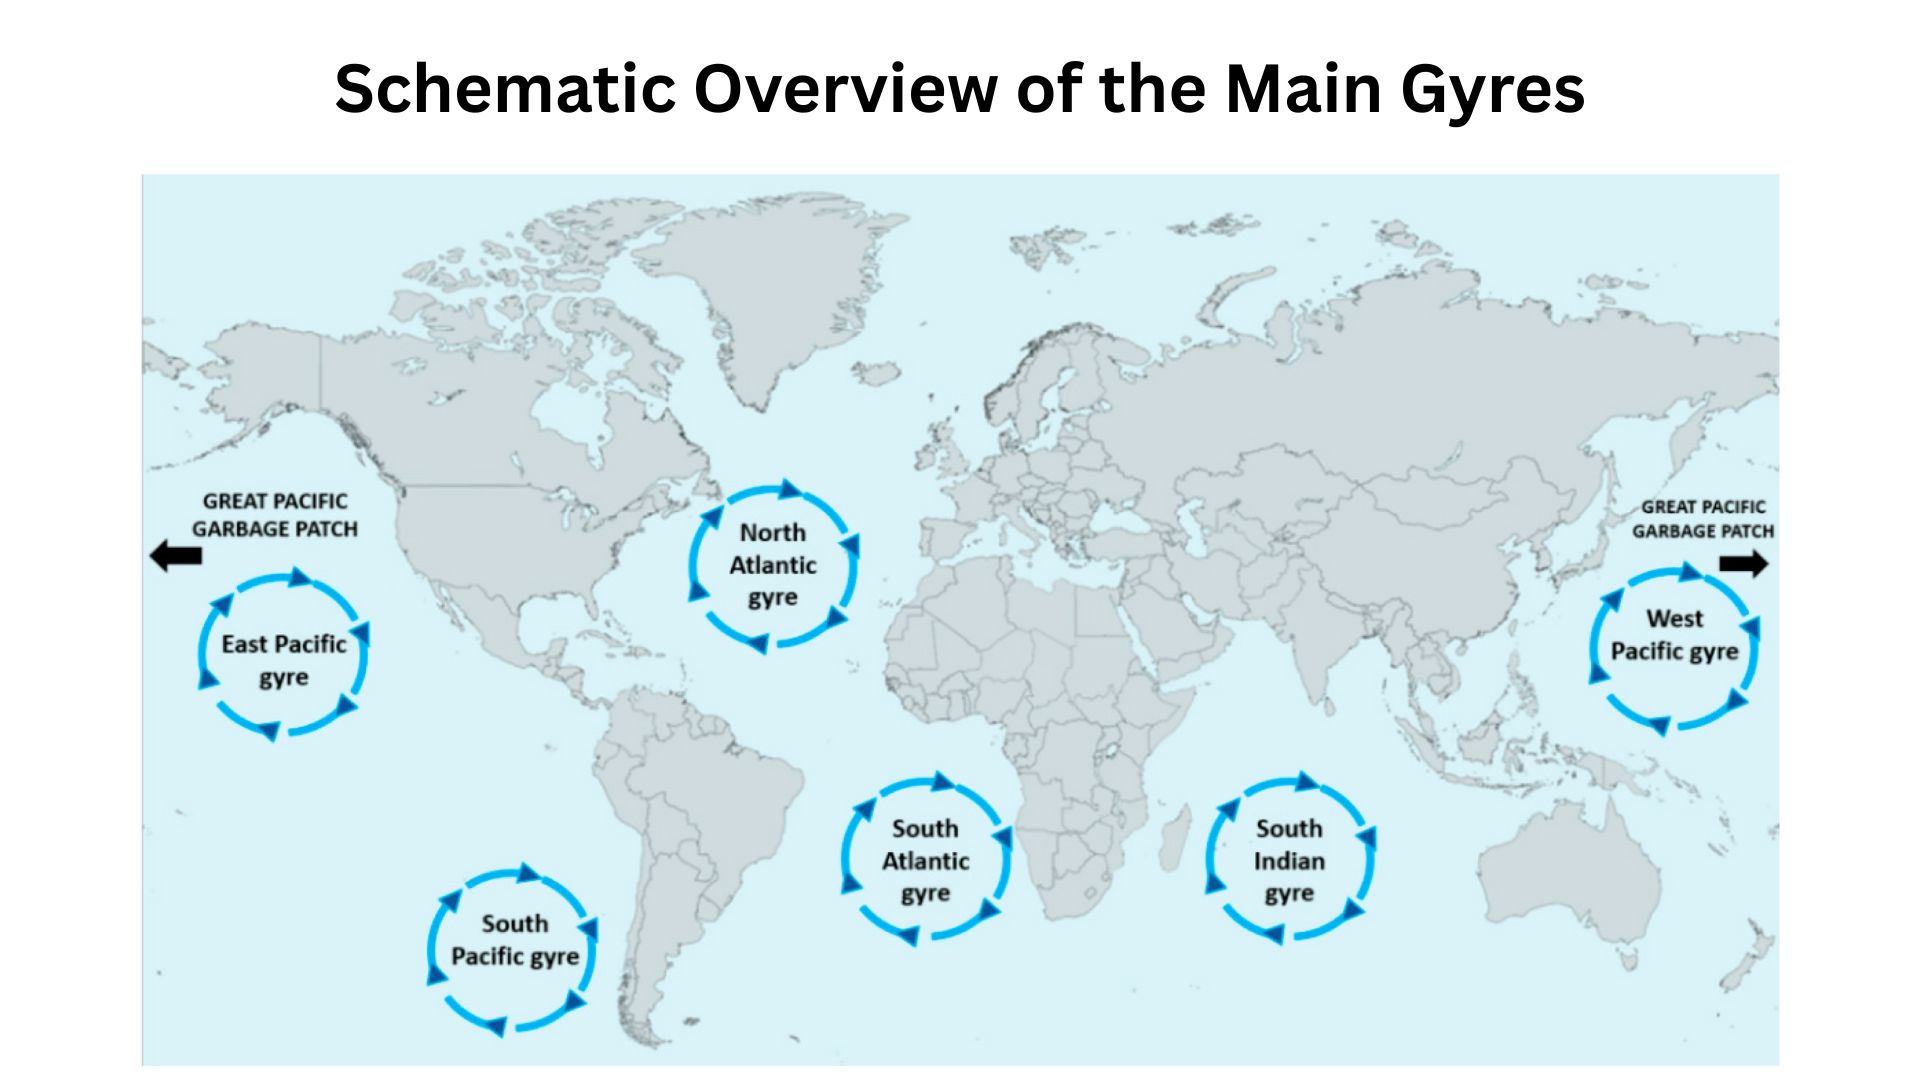
- The ocean has five major garbage patches, gyres, where trash collects due to currents. The most infamous is the Great Pacific Garbage Patch.
- That one alone holds about 1.8 trillion pieces of plastic (larger than 0.5 mm), weighing around 100 million kilograms.
- It spans an area twice the size of Texas (or three times France). It’s not a solid island but more like a plastic soup.
| Feature | Detail |
| Number of gyres | Five main ocean gyres worldwide |
| Great Pacific Garbage Patch | 1.8 trillion pieces, 100 million kg, 2x Texas size |
Plastic in the Ocean
- Every year, 300 million tons of plastic get produced. And it is equal to the weight of the whole population, and half of the amount gets used just once.
- About 8 million tons of plastic go into the ocean every year.
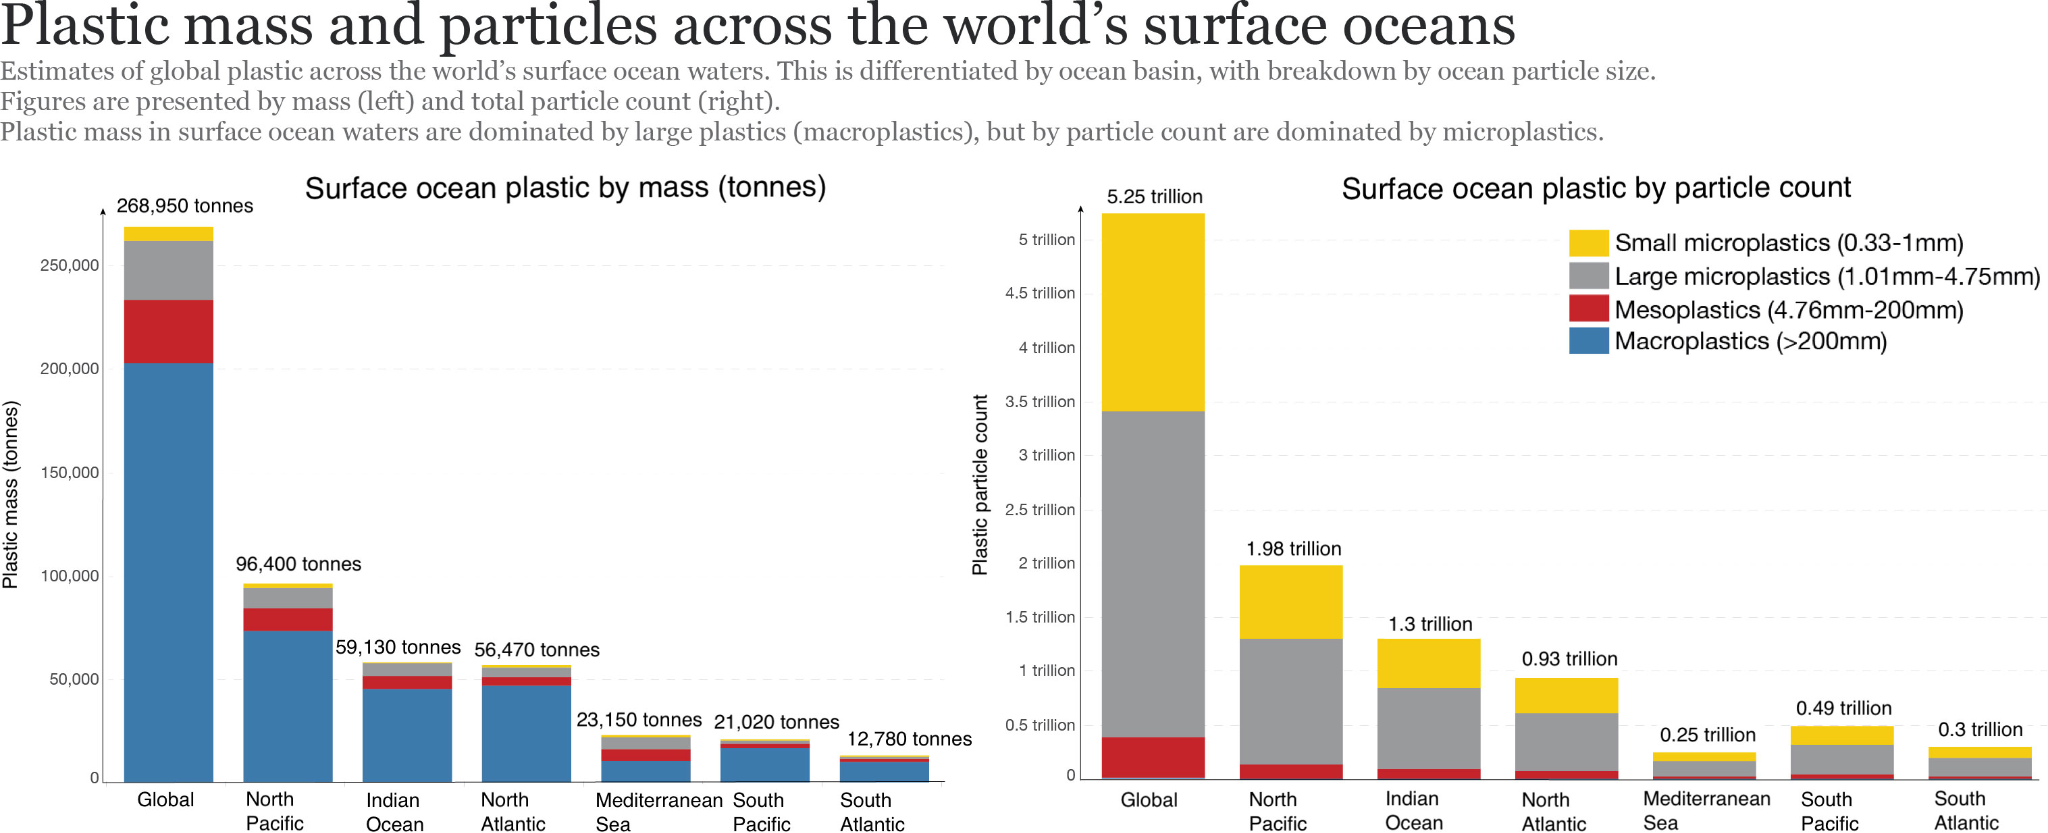
- It is believed that there are 5.25 trillion pieces of plastic waste in our oceans. 269,000 tons float on the water, and there are 4 billion microfibers per km² under the surface.
- Our waste goes 70% into the ocean’s ecosystem, 15% floats in the oceans, and 15% gets washed up on our beaches.
- During the last 10 years, we produced more plastic than during the previous century. In 2050, the pollution of fish will be exceeded by the amount of our dumped plastics.
- In various studies, plastics have comprised 60-90% of marine pollution.
- Ocean crusaders suggest that there are about 46,000 pieces of plastic for every mile of water.
- While breaking down over 100s of years, it breaks into small pieces and spreads around the whole planet.
- Except for the incinerated plastics, everything that we produced is still on our planet in some form.
Sources of Ocean Pollution
(Reference: researchgate.net)
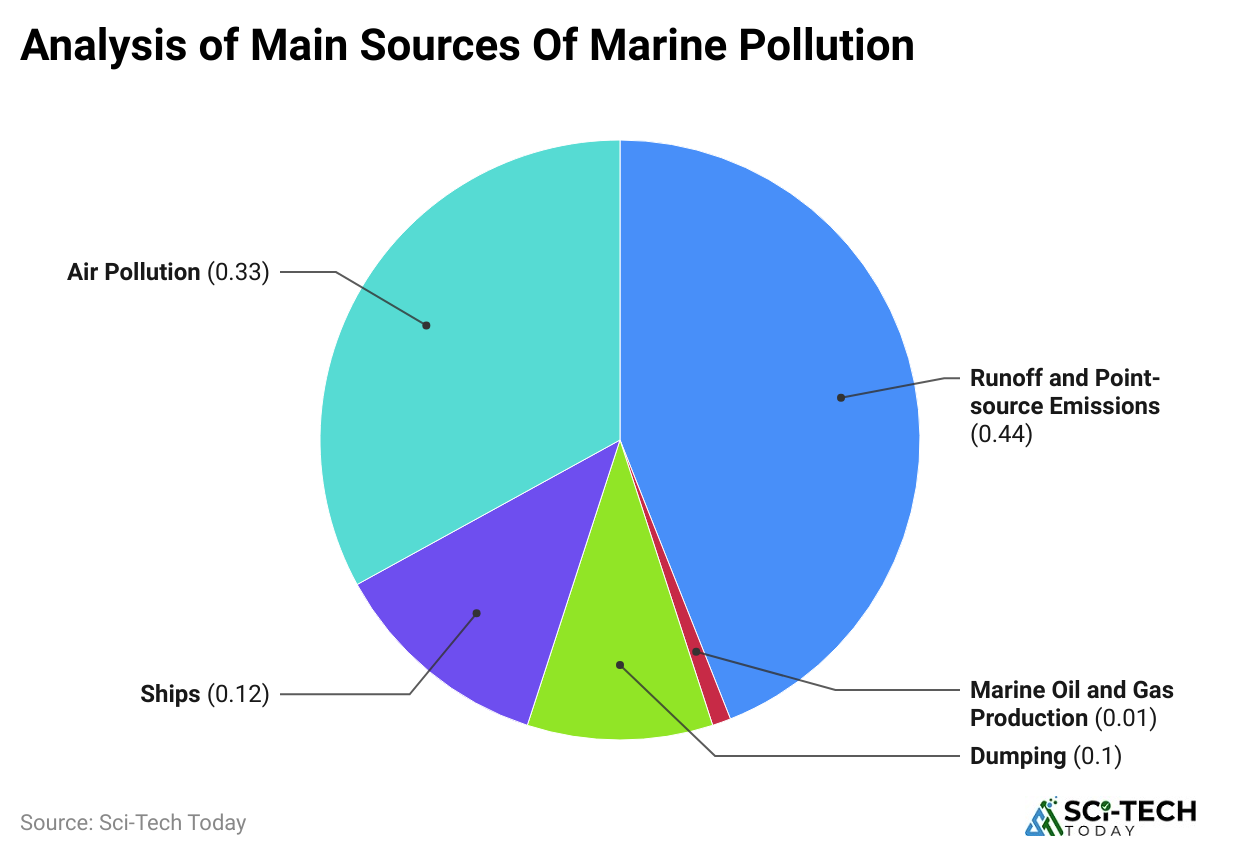
- Globally, an estimated 80% of marine plastic pollution originates from land-based sources, including mismanaged waste, litter, stormwater systems, and river transport.
- 1,656 rivers are responsible for nearly 80% of riverine plastic that reaches the oceans.
- Fishing also contributes. In the Great Pacific Garbage Patch, around 80% of plastic mass comes from fishing gear like nets, buoys, and traps, not all land-based.
| Source Type | Impact |
| Land-based | 80% of ocean plastic |
| Rivers | 1,656 rivers account for 80% input |
| Fishing gear | 80% of the GPGP plastic mass comes from fishing gear |
Effects on Marine Life and Ecosystems
(Source: mdpi.com)
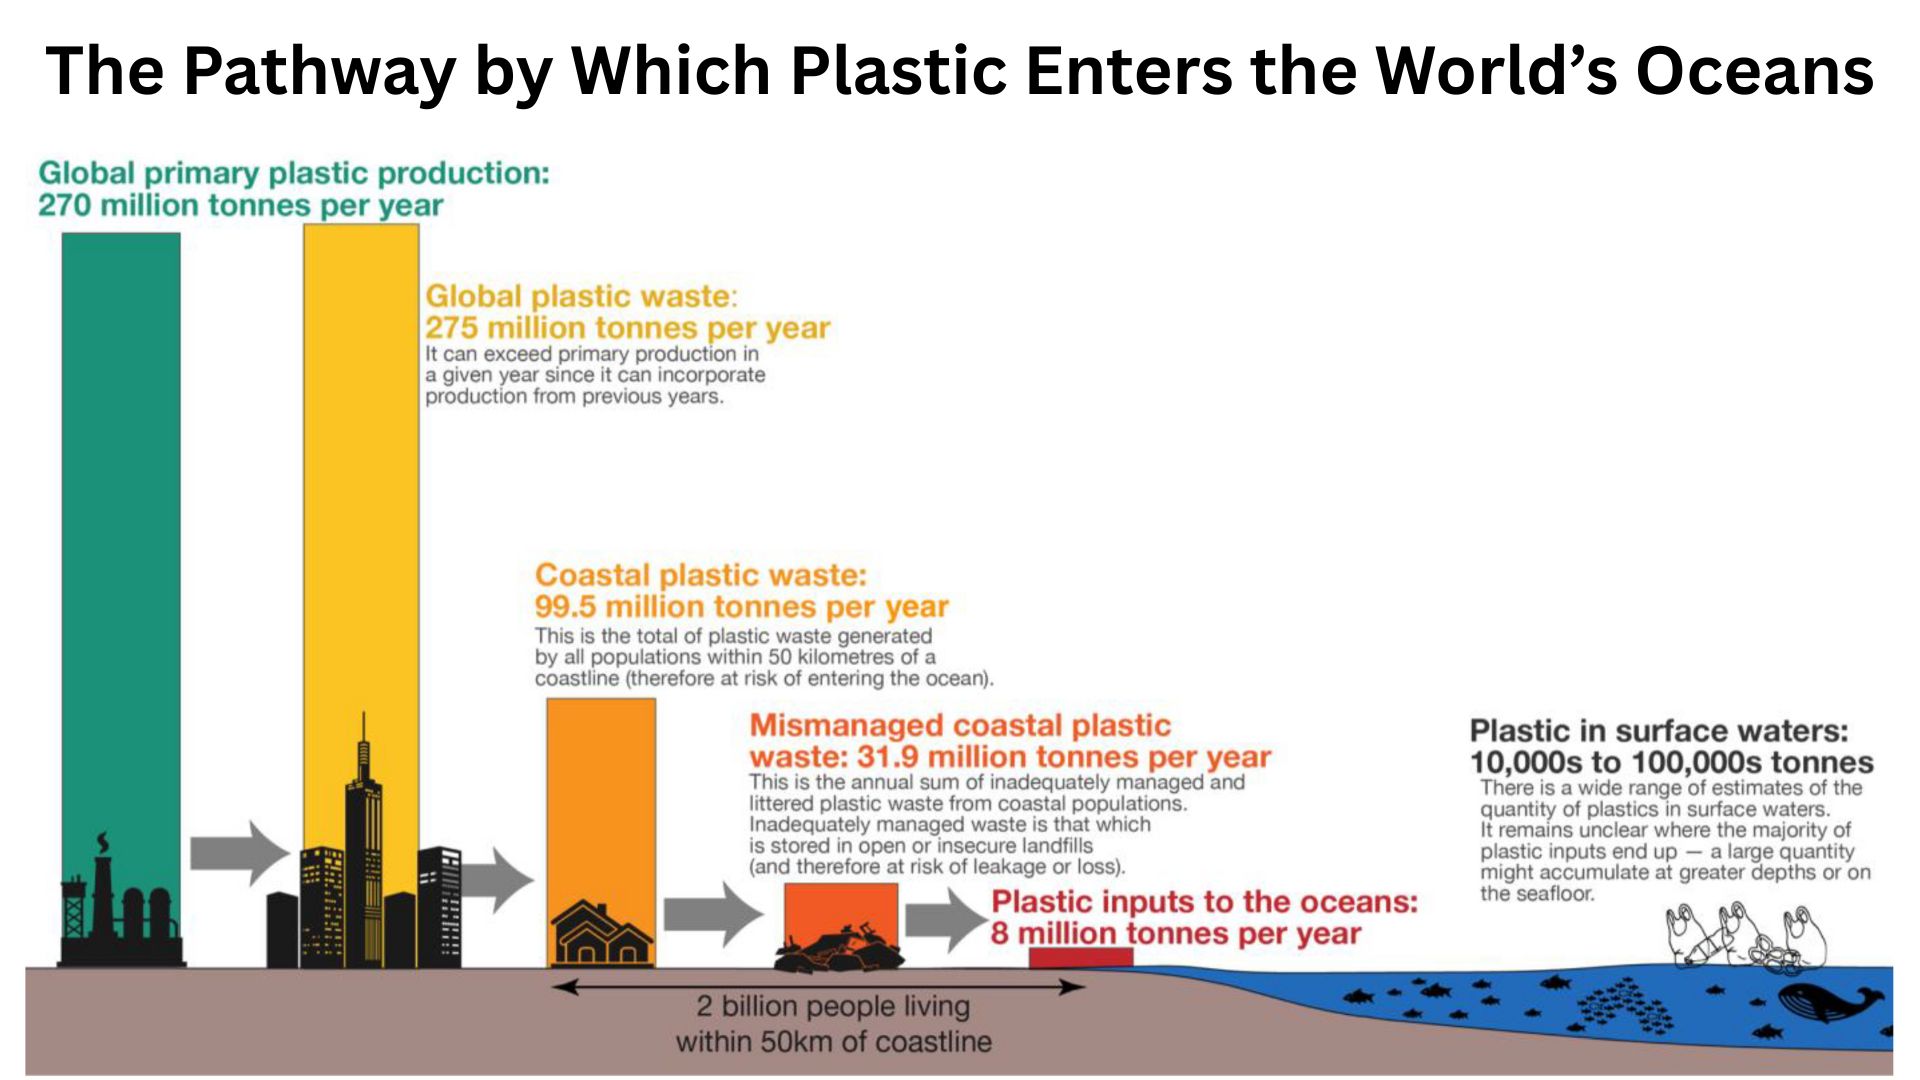
- It’s estimated that over 100 million marine animals die each year from plastic waste. Tens of thousands get entangled; birds and mammals suffer ingestion.
- At least 1 in 3 marine mammal species gets entangled in litter. And North Pacific fish ingest 12 to 14 thousand tons of plastic annually.
- Microplastics, tiny bits, now make up 90% of the plastics by count in the pelagic marine zone. Those bits enter the food chain, starting with plankton.
- Industrial microfibers alone, like those from washing clothes, could be 700,000 fibers per wash, contributing to about 4 billion microfibers per km in oceans.
| Effect | Trend |
| Marine animal deaths | 100 million animals/year |
| Marine mammals’ entanglement | 1 in 3 species affected |
| Microplastics in the pelagic zone | 90% by count |
| Microfiber pollution concentration | 4 billion fibers per km |
Other Pollution Types – Oil, Nutrients, Noise, Microplastics
(Reference: mdpi.com)
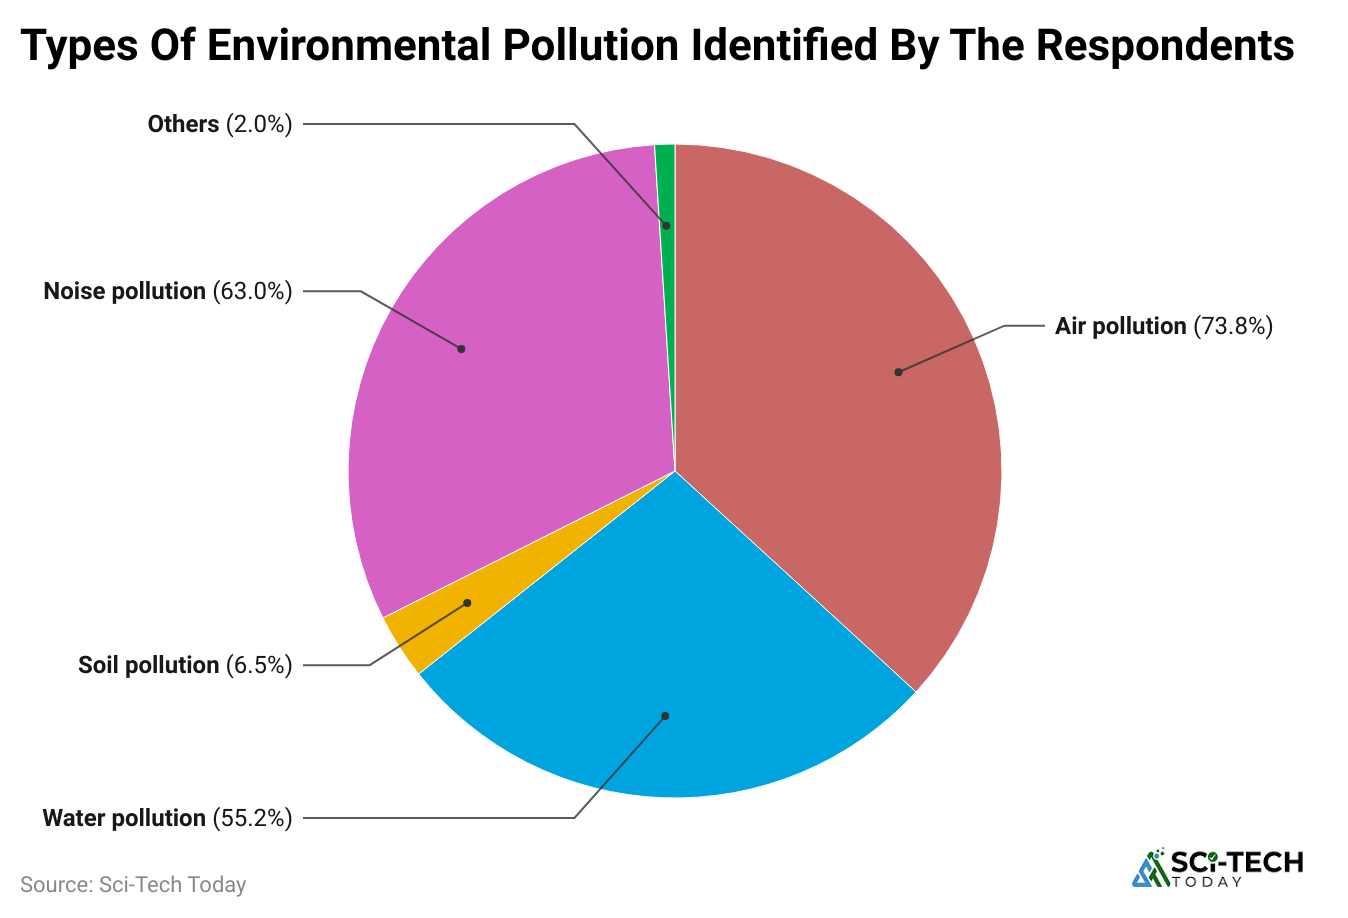
- Oil spills are down nowadays, thanks to safer tanks, etc., but natural seeps still release 600,000 tonnes annually.
- In 2025, approximately 4,000 tonnes of oil were spilled in six reported tanker incidents worldwide.
- Nutrients like nitrogen cause dead zones, oxygen-deprived areas. There are currently around 500 such dead zones globally, covering 250,000 km (the size of the UK).
- Noise pollution, from shipping or sonar, endangers marine animals like jellyfish and their predators, upsetting food chains.
| Type | Key Data |
| Oil Pollution | Natural seeps, 600kt/year; spill 4kt/year |
| Dead zones | 500 zones, a total of 250,000 km |
| Noise pollution | Affects invertebrates, ripples upward |
Cleanup Efforts and Human Response
(Source: frontiersin.org)
- The Ocean Cleanup (nonprofit) has removed tens of millions of kilograms of litter. They target 90% of floating ocean plastic by 2040.
- In 2025, the Global Ocean Cleanup involved 54 coastal cleanups in 25 countries, with volunteers removing 47.4 tons (94,920 lbs) and restoring 53.3 miles of coastline.
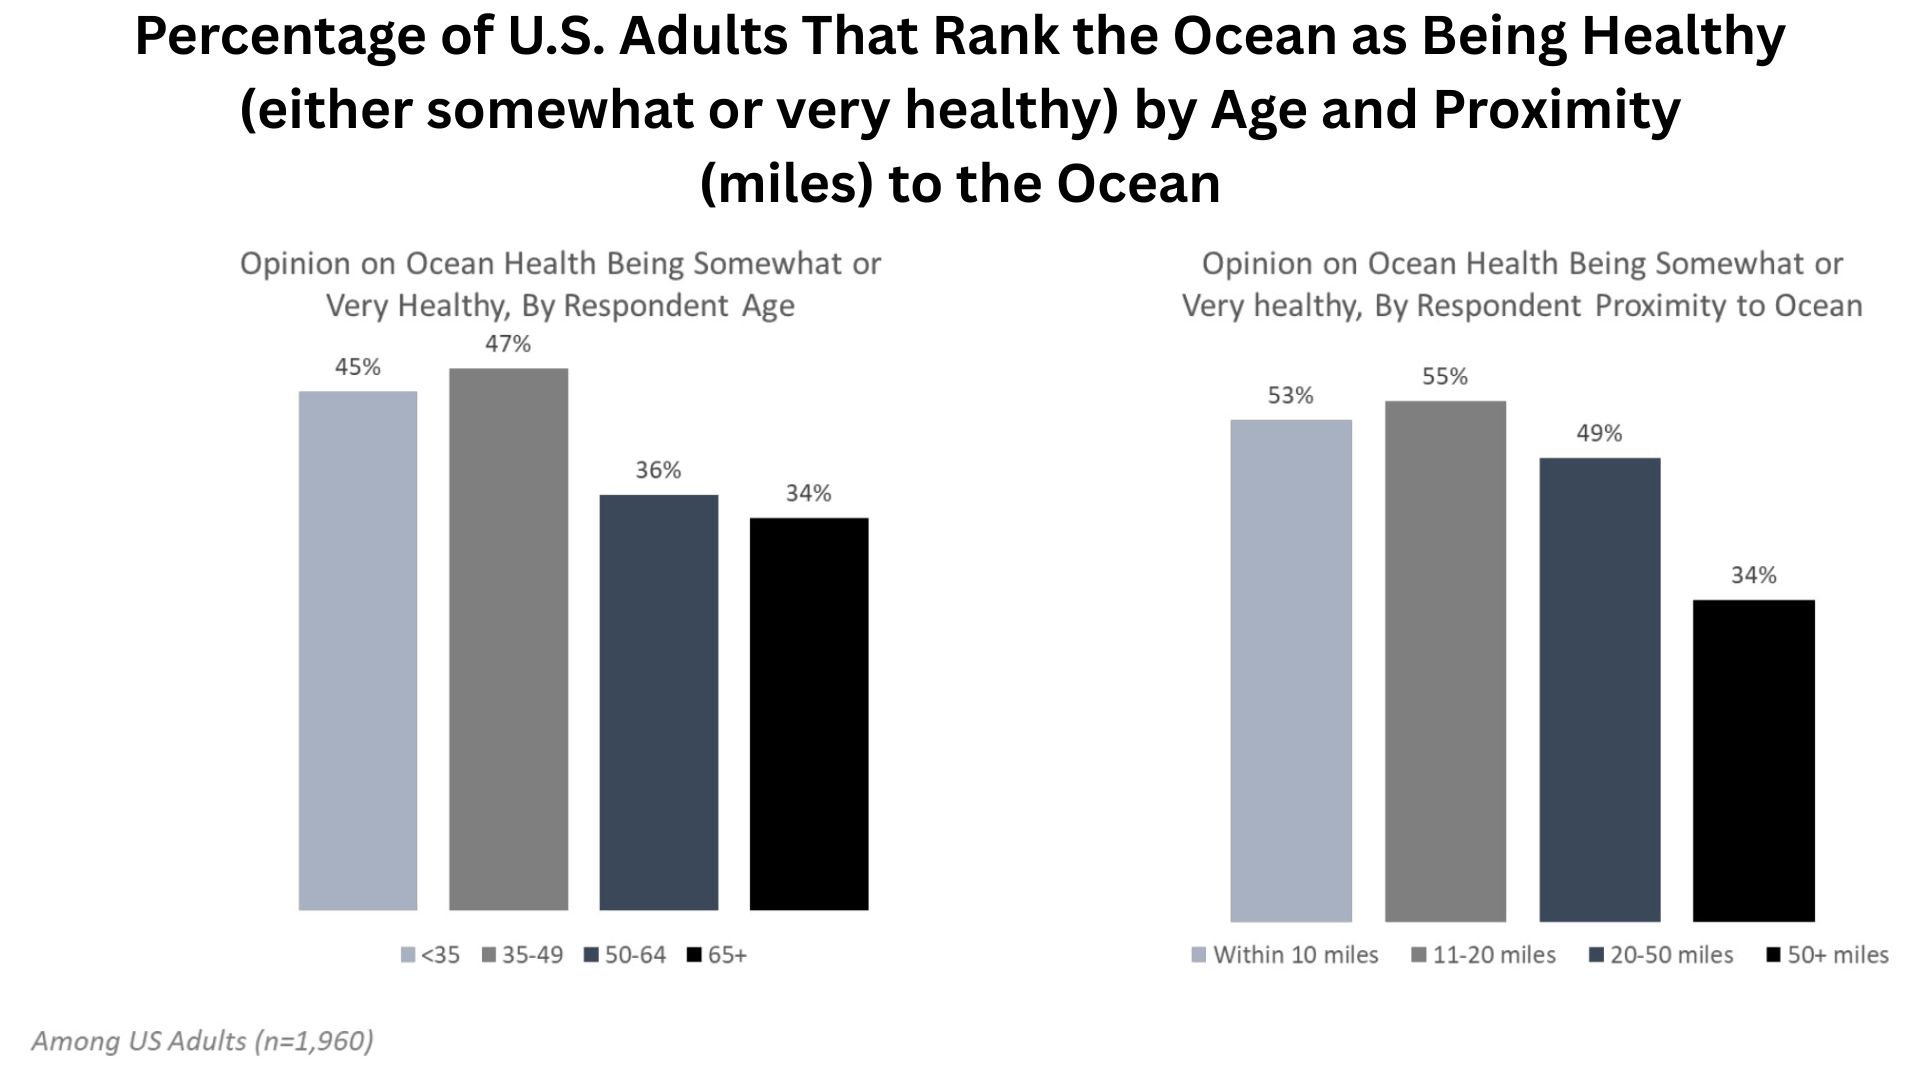
- But cleanup is hard; prevention is more effective. Countries need better waste systems, improved treatment plants, etc.
| Initiative | Data |
| Ocean Cleanup goal | Remove 90% of floating ocean plastic by 2040 |
| 2025 Global Cleanup | 54 cleanups, 47.4 tons removed, 1,984 volunteers |
| Treatment plants | Advanced systems reduce microplastics by 98% vs 79% (cases in Sydney) |
Global and Policy Responses
(Source: frontiersin.org)
- A worldwide treaty on plastic by 2022 to end plastic pollution by 2040 is underway.
- Some scientists have predicted that about 8% of marine catch consists of plastic waste, which is an immediate threat to food security and employment, particularly for small-scale fishermen.
- John Kerry underlines that less than 3% of oceans are highly protected and 90% of coral reefs are at risk by 2050. He pushes for legal treaties, fishing bans, and maritime regulation.
| Theme | Status |
| Global treaty | Aim: end plastic pollution by 2040 |
| Plastic in marine catch | 8% of the catch contains plastic |
| Ocean protection | 3% protected; 90% coral reefs at risk |
Summary
After going through all these ocean pollution statistics, one thing becomes very clear: the numbers are not just numbers; they are warnings. The ocean has always been our planet’s life support, but the way we are filling it with plastic, chemicals, oil, and noise is pushing it to the edge. When we hear that millions of tons of plastic enter the sea every year or that hundreds of dead zones now exist where nothing can survive, it’s not just about the environment; it’s about us, too.
These show us the real cost of our throwaway culture. It’s not hidden anymore; it’s right there in the fish we eat, in the coral reefs we are losing, and in the jobs that millions of people depend on. The scary part is that the problem is still growing every year, and if we don’t take it seriously, future generations might inherit oceans that are more like dumping grounds than living ecosystems.
But there’s also some hope. Cleanup projects, stronger laws, better waste systems, and global measures are steps in the right direction. The numbers prove the problem is huge, but they also prove that action can make a difference. If millions of people caused this, then millions of people can also solve it. At the end of the day, these ocean pollution statistics are not just about the damage; it’s also about the chance to turn things around if we act now. I hope you guys like this article. If you have any questions or want to give any feedback, kindly let us know in the comments section. Thanks.
FAQ
Ocean pollution is the harm caused when trash, chemicals, oil, and waste from human activities enter the sea. About 80% of this pollution starts on land before flowing down rivers or washing off beaches into the water.
The Philippines is the single largest contributor of plastic waste entering the ocean, accounting for over 36% of global oceanic plastic emissions.
Marine pollution includes plastic waste, chemical and industrial runoff, oil spills, nutrient loading from sewage, and underwater noise. These diverse contaminants damage fragile ocean habitats, disrupt marine life behaviors, and threaten global ecosystems.