Introduction
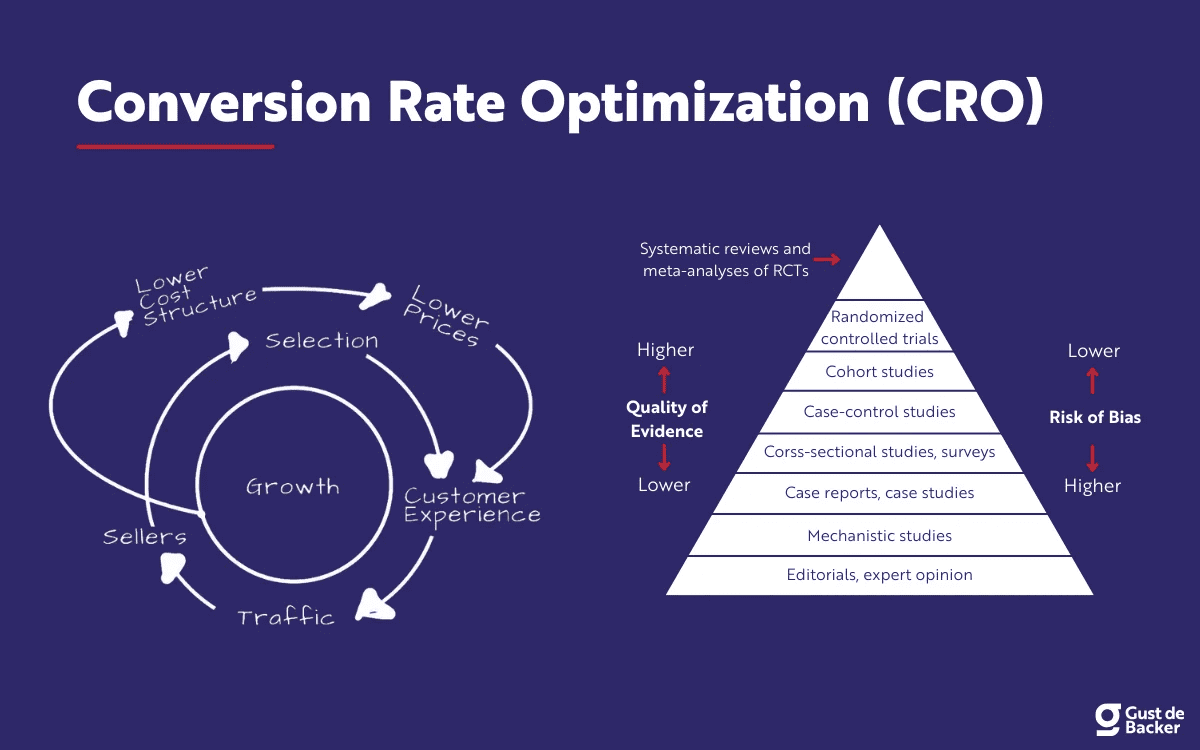
Conversion Rate Optimization Statistics: CRO serves as the compass guiding businesses toward profitability. CRO is the systematic process of increasing the percentage of website visitors who take a desired action, be it filling out a form, signing up for a service, or making a purchase. This discipline is entirely driven by hard-hitting data.
This comprehensive guide delivers the most current Conversion Rate Optimization Statistics. It provides the benchmarks, industry specifics, and basic insights that guide the transformation of clicks into customers.
We’ll explore everything from budget allocation and channel performance to the granular impact of a single-second delay in page load time. Understanding these data isn’t just about tweaking a button color. It’s about fundamentally understanding human behavior online to unlock massive revenue potential. So, let’s get started.
Editor’s Choice
- The global average conversion rate for e-commerce sites consistently hovers just under 3%, reinforcing that the majority of traffic doesn’t transact and proving the vast potential for optimization.
- The elite top 10% of advertisers running Google Ads campaigns routinely achieve conversion rates soaring over 45%.
- Mobile conversion rates continue to trail desktop, averaging around 6% to 2.5% despite accounting for nearly three-quarters of all retail site traffic.
- Email marketing remains a powerhouse channel, delivering an average conversion rate of 6% to 3.2% from click to sale.
- Reducing website load time by just one second can typically boost your conversions by approximately 7%..
- Firms that use dedicated CRO tools and methodologies report an outstanding average Return on Investment (ROI) of 223%.
- The biggest opportunity for B2B lead generation is expanding landing pages: moving from 10 to 40+ pages can result in an astonishing lead increase of over 500%.
- User-Generated Content (UGC), such as reviews and testimonials, elevates the likelihood of conversion by more than 100%.
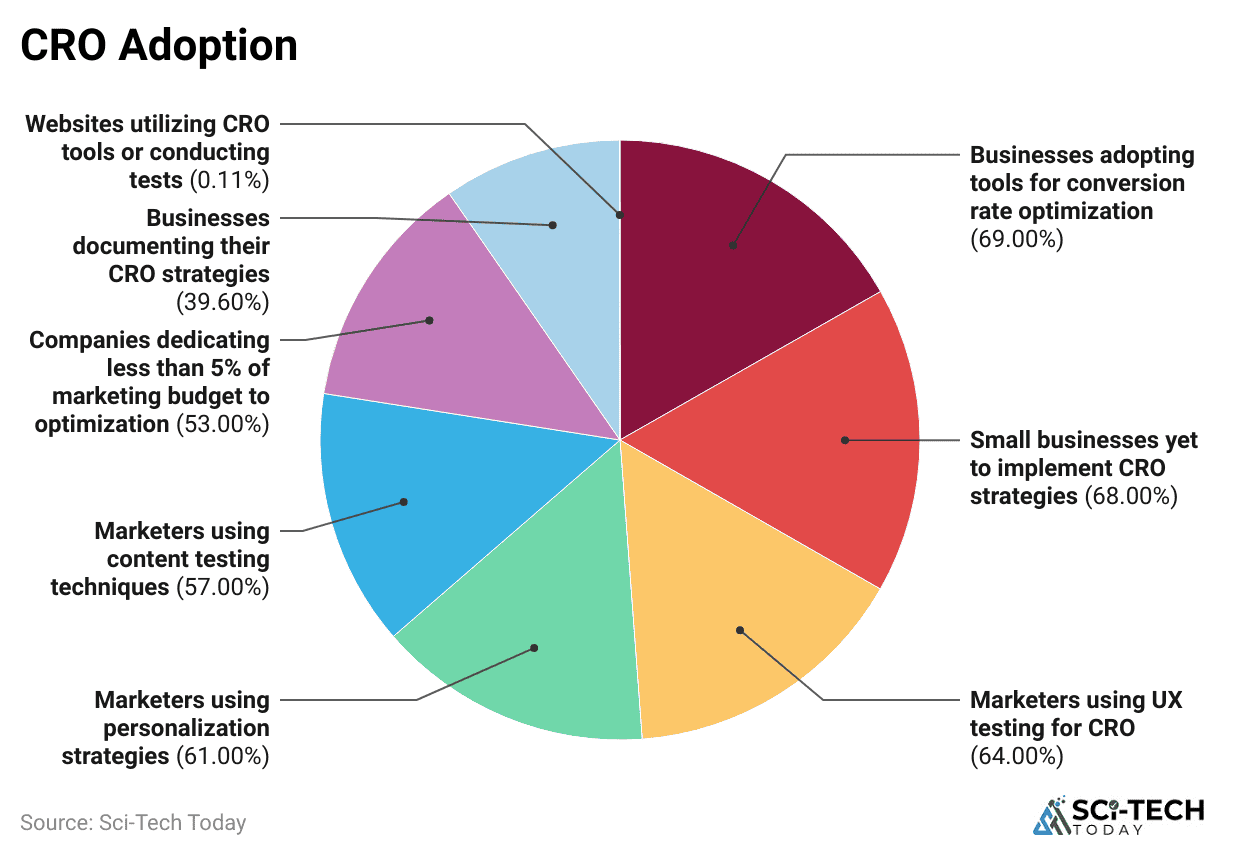
CRO Adoption and Investment
 (Reference: market.biz)
- A staggering 68% of small businesses have not yet implemented a dedicated Conversion Rate Optimization strategy.
- Current data shows that, on average, businesses spend only $1 on Conversion Rate Optimization efforts for every $92 they allocate to acquiring brand-new traffic.
- Despite the high ROI, over 50% of companies dedicate less than 5% of their total marketing budget toward optimization activities.
- Companies are increasingly recognizing the necessity of specialized tools, with organizations spending an average of approximately $2,000 per month on various CRO tools and software to conduct sophisticated A/B tests and analytics.
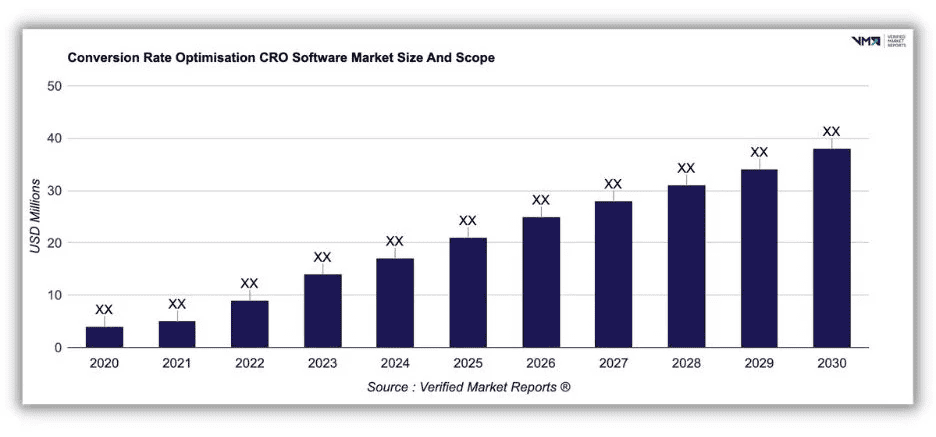
- The global market for CRO software itself is a strong indicator of future trends, having been projected to reach a valuation of over $1.93 billion by 2026.
- In terms of practice, about 77% of businesses regularly employ A/B testing as their primary method to enhance conversion rates.
- Only around 40% of global businesses take the essential step of formally documenting their Conversion Rate Optimization strategies.
| Spend Ratio (CRO vs. Acquisition) | $1 (CRO) to $92 (Acquisition) |
| Small Business CRO Strategy |
68% lack a plan |
|
Marketing Budget Share on CRO |
5% for over 50% of companies |
| Average Monthly Tool Spend |
$2,000 |
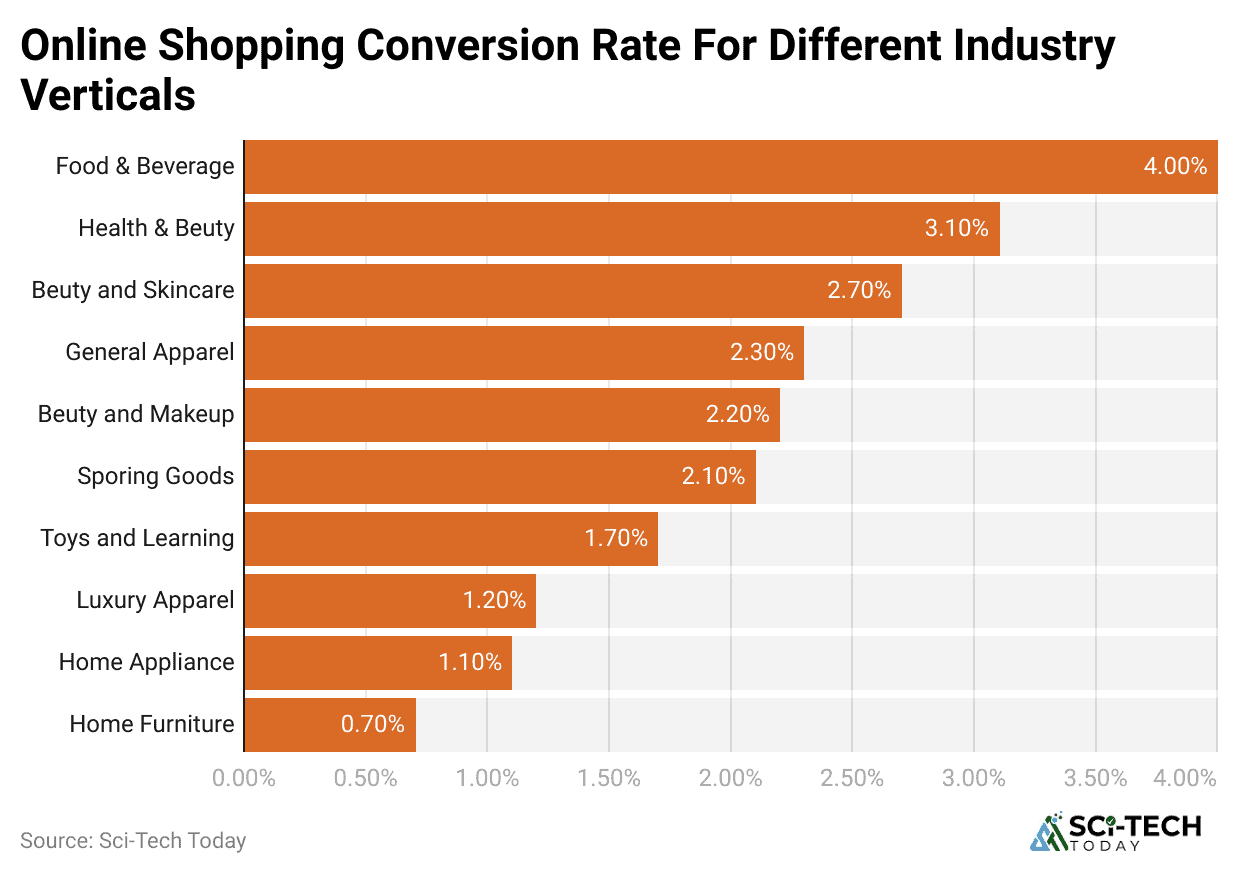
Conversion Rates by Industry
 (Reference: meetanshi.com)
- The Food and Beverage e-commerce sector frequently records some of the highest conversion rates, with recent data showing averages ranging from 6.11% to 6.64%.
- The SaaS (Software as a Service) industry boasts an impressive average conversion rate of approximately 9.5%.
- The Finance and Insurance sectors often show the highest conversion rates from paid search ads, sometimes peaking over 15.6%.
- B2B Services demonstrate a strong performance for complex sales, achieving an average conversion rate of 4.6%.
- In the retail space, Luxury Handbags and Jewelry struggle with some of the lowest conversion rates, often below 1.5% and sometimes as low as 0.3%.
- Health and Beauty sites often perform above the general e-commerce average, consistently achieving conversion rates around 4.55% to 4.95%.
- For B2B Tech and E-commerce, conversion rates from an organic search are more modest, sitting around 2.1% to 2.6%.
- The highly competitive Travel Industry sees conversion rates from organic search averaging around 8.5%.
| Industry Vertical | Average Conversion Rate |
| SaaS (Lead) | 9.5% |
| Food & Beverage | 6.11% to 6.64% |
| B2B Services | 4.6% |
| Luxury & Jewelry | 1.5% |
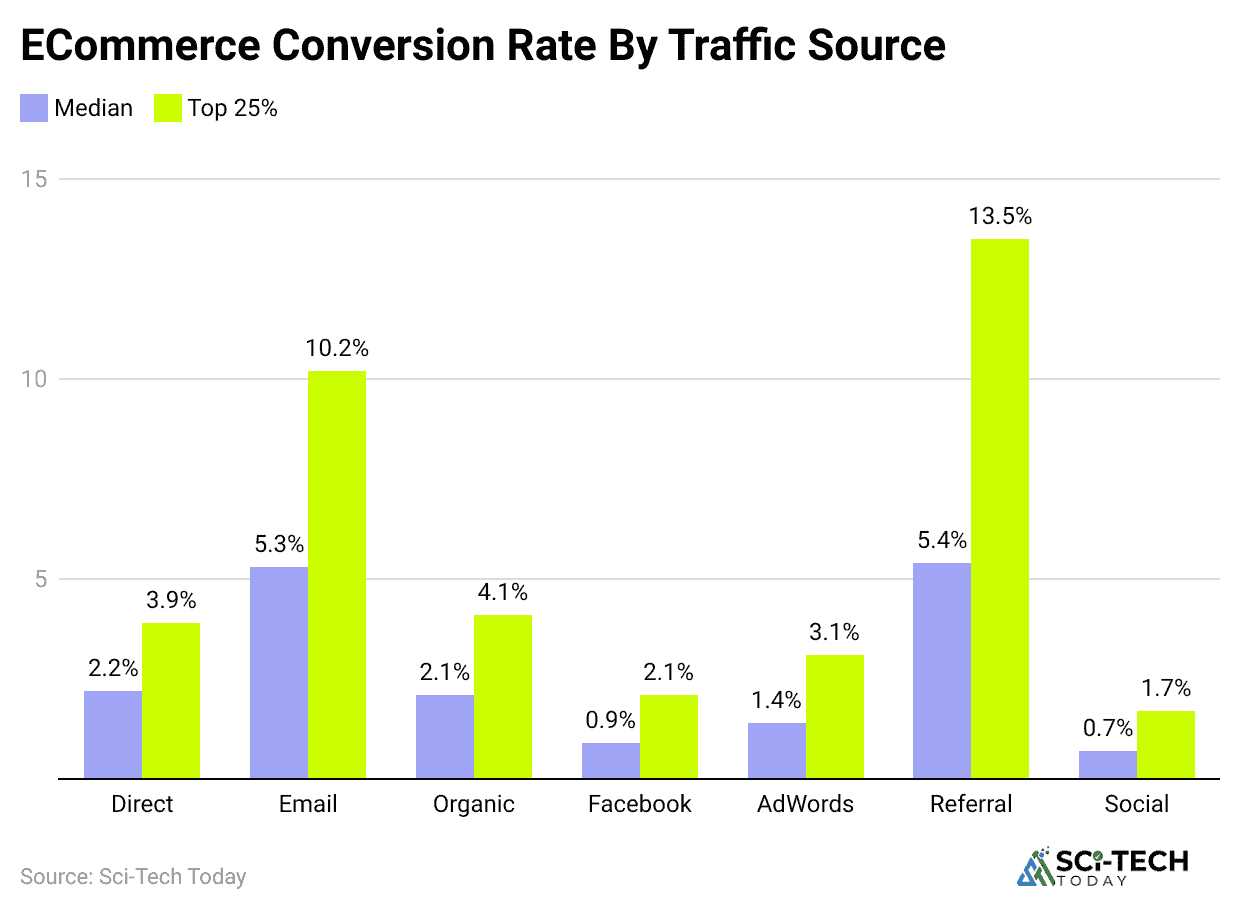
The Impact of Traffic Source
 (Reference: getshogun.com)
- Direct Traffic visitors, who type your URL directly or use a bookmark, consistently demonstrate the highest conversion intent, often yielding an average conversion rate of 3.3% or more.
- Paid Search (PPC) is a close second, with conversion rates averaging around 3.2%, thanks to its power to target users who are actively searching with high commercial intent and ready to transact.
- Organic Leads generated from content marketing strategies are reported to have an exceptional conversion rate of 53% when converting into a sales-qualified lead.
- Email Marketing continues to be one of the most effective channels, with campaigns often seeing a conversion rate of up to 17.75% based on click-through rates.
- Social Media platforms typically show the lowest conversion rate of all channels, averaging a modest 1.5% to 1.6%.
- Facebook Ads, however, punch above the general social media average, achieving a strong average conversion rate of 9.21% across various industries.
- Conversion rates from Referral Traffic tend to average around 2.9%, performing solidly as the traffic often comes from a trusted, relevant source that has pre-qualified the visitor’s intent.
- Pages ranking number one in Google’s organic search results typically capture an outstanding 34% or higher of the total clicks.
| Direct Traffic | 3.3% |
| Paid Search (PPC) | 3.2% |
| Email Campaigns | 2.6% to 3.2% (to sell) |
| Social Media | 1.5% |
Website Experience and User Journey
 (Source: gustdebacker.com)
- A website loading in two seconds or less is essential, as this speed threshold can deliver a conversion rate that is 15% higher on mobile devices compared to slower sites.
- A page load time delay of even one second increases the probability of a visitor bouncing by 32%, and if the load time reaches six seconds.
- High-quality images and visual content are not a luxury; 50% of online shoppers cite images as the crucial factor when they are deciding what product to buy from a listing.
- Embedding relevant videos on landing pages has a dramatically positive effect on performance, with a documented potential to increase conversion rates by an average of 86%.
- Long-form landing pages, when structured correctly with clear intent and a CTA, have been shown to increase lead generation by a massive 220% compared to their shorter counterparts.
- The strategic removal of the standard navigation bar from a dedicated landing page can be a powerful tactic.
- Implementing live chat functionality on a website can significantly enhance customer engagement, with data indicating the potential to boost overall revenue by up to 40% while improving conversion rates by 48%.
- The effectiveness of Exit Pop-ups is consistently proven, as implementing them can typically lead to an additional 2% to 5% increase in conversion rates by offering one final incentive before the visitor leaves the site completely.
| 1-Second Load Delay | -7% Conversion Drop |
| Video on Landing Page | +86% Increase |
| Removing Nav Bar on LP | Doubles Conversion Rate |
| Long-Form Pages | +220% Lead Increase |
Form and Call-to-Action (CTA)
 (Reference: enterpriseappstoday.com)
- The industry average for landing page conversion rate is a modest 2.35%, highlighting that a vast majority of users who are interested enough to click through still don’t complete the intended action.
- Forms that are streamlined to include only three fields consistently achieve the highest conversion rates, reaching up to 25% success, compared to the 15% rate seen on forms with six or more fields.
- Despite this knowledge, the average number of fields found on web forms remains high at 11, proving a major area of opportunity; reducing this number to just four can often lead to a 120% increase in conversions.
- Adding a simple yet highly requested element like a telephone number field to a lead form can be detrimental to conversion rates, typically causing a measurable decrease of 5%.
- Personalized CTAs, buttons that change based on a user’s previous history or segmentation, are an incredibly powerful tool, delivering a 42% higher conversion rate than generic, static CTAs.
- Simple color psychology can have a numeric impact: one famous study showed that changing a CTA button to the color red can improve conversions by as much as 21% compared to other colors.
- Strategically placing the Click-Through Rate (CTR) element just above the fold on a page can significantly increase engagement, with studies showing a resulting conversion rate increase of 317%.
- Only about 45% of visitors who land on a page that is exclusively dedicated to housing a conversion form complete the action.
| Form Field Count | 3 fields yield up to 25% CVR |
| Personalized CTAs | +42% Higher CVR |
| Asking for a Phone Number | -5% Drop in CVR |
| CTA Color | Red can see +21% CVR |
CRO on Content and SEO
 (Source: wordstream.com)
- Articles with a minimum length of 3,000 words have a documented tendency to double the final conversion rates compared to shorter articles.
- Incorporating clickable CTAs directly within the flow of a blog post can dramatically improve lead capture, boosting conversion rates from that piece of content by up to 121%.
- Using question-based titles for content tends to drive stronger initial engagement, receiving approximately 15% more clicks than standard titles.
- Blog posts that are structured with a high number of lists, placed every 500 words or so, generate significantly higher traffic, with reports showing they attract 70% more overall visits.
- The subtle optimization of blog titles for length, specifically those between 40 and 50 characters, can lead to an 8.5 times higher click-through rate compared to titles outside of this range.
- The average conversion rate for a blog post visit to a lead remains relatively low, generally ranging from 1% to 3%.
- For B2B marketing, inbound strategies built on quality content can boost an average website’s overall conversion rates by a healthy margin of 6% to 12%.
- A key metric for content success is Average Time on Page (ATOP): websites with a higher ATOP tend to have lower bounce rates and higher conversion rates.
| 3,000+ Word Articles | Doubles CVR |
| CTAs in Blog Body | +121% CVR Increase |
| Question-Based Titles | +15% More Clicks |
| Blog Visit to Lead Rate | 1% to 3% |
Challenges and Barriers
 (Source: vwo.com)
- A significant 82% of marketing professionals openly admit they find the systematic tracking and testing of conversion rates to be a task that is either moderately or highly challenging.
- Securing “buy-in” from senior leadership and other key decision-makers within the organization remains one of the two primary challenges cited by marketers in a post-pandemic optimization landscape.
- The lack of internal expertise is a major limiting factor, with nearly 75% of businesses reporting that they struggle to find the right talent or internal resources to effectively execute their CRO strategy.
- Implementing website personalization, a strategy proven to increase conversions, is considered to be either somewhat or very difficult to execute by 79% of all marketers surveyed.
- Customer Lifetime Value (CLV), a metric that should inform all CRO decisions, is currently not a primary metric for a majority of companies.
- Over 40% of visitors will abandon a website entirely if it takes more than three seconds to load.
- An overwhelming 85% of marketers acknowledge that their company is not making a sufficient effort to properly re-engage customers who are hard-to-reach or who have shown initial interest but dropped off prematurely.
- The problem of cart abandonment is pervasive in e-commerce, with an average rate of 69.8%.
| Tracking and Testing Difficulty | 82% |
| Finding CRO Talent | 75% |
| Personalization Difficulty | 79% |
| Cart Abandonment Rate | 70% |
Conclusion
Overall, these latest Conversion Rate Optimization Statistics give us a clear picture: the vast majority of businesses are underperforming, and this digital ecosystem is a place of impatience.
The most successful companies, those achieving conversion rates exceeding 11%, are the ones that treat Conversion Rate Optimization as a continuous, well-funded, and deeply integrated thing, not just an occasional website audit. They understand that every one-second delay, every unnecessary form field, and every generic CTA represents a quantifiable loss of revenue.
What part of your conversion funnel do you think is currently causing the biggest drop-off based on these statistics? Let us know. Thanks for staying up till the end. I hope you guys like this piece of the article.
