








Introduction
SQL Statistics: Sales-qualified leads (SQLs) are where marketing interest turns into real sales intent. For 2026, benchmarks are better viewed as a range rather than a single universal conversion rate, as Public B2B reporting often shows MQL-to-SQL moving from 13% to 26%, while SQL-to-opportunity is often reported in the 25% to 62% range. These results vary by industry, channel, how strict the qualification is, and how teams define each stage.
That spread is not a mistake, as it mostly comes from different SQL definitions. Teams should therefore use external statistics as directional benchmarks, then compare their own numbers using consistent cohorts.
Top Picks
- Based on setup and funnel rules, MQL-to-SQL is commonly in the 13% to 26% band.
- SQL-to-opportunity is often 25% to 62%, while for SaaS, one common figure sits near 40% to 48%.
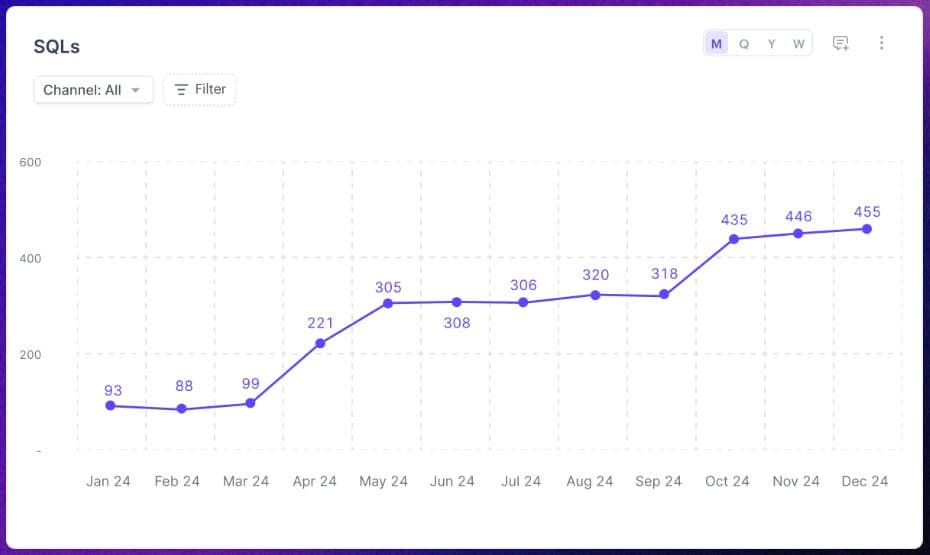
- SQL volume went from 93 in January 2024 to 455 in December, up by about 389%.
- First Page Sage lists MQL-to-SQL at 51% for SEO, 30% for webinars, and 26% for PPC in B2B SaaS.
- Lifecycle figures often show 50% to 60% of SQLs moving to opportunities, and 20% to 30% of opportunities become customers.
- Across the full path, lead-to-customer conversion is usually about 1% to 3%.
- HVAC shows the top SQL-to-closed-won rate at 29%, and Biotech shows 11% in the industry set.
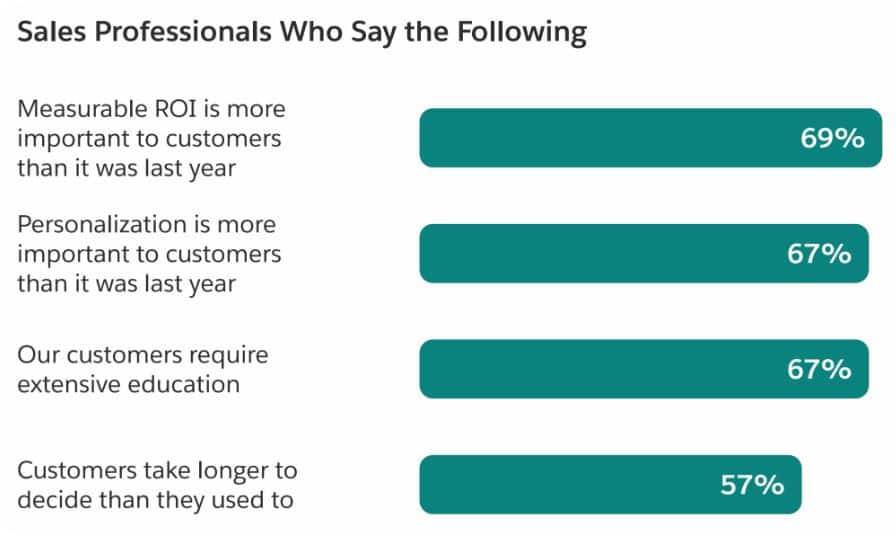
- Salesforce says 69% of sales pros believe measurable ROI matters more to customers than the previous year.
- 57% of sales professionals say buyers take longer to make purchasing decisions.
- CPSQL guidance is directional, around $100 to $400 for organic SEO and content, and for outbound SDR programs, it is often $1,000 to $5,000.
What is an SQL?
- A lead is a person, or in many cases a person tied to a business, who may want to buy from you and who shows this interest when they take an action with your company.
- For example, they might sign up for your newsletter, download a guide or whitepaper, or request product details using a form on your site.
- To be clear, a lead is usually not the very first step, at which a person interacts with your business.
- The first stage in the pipeline, representing the first step, is often a person who lands on your website.
- People in that early phase are often called visitors, who simply may just read what is on the page or scroll through a social post, but do not do much more beyond that.
- A lead is different, as it gives you more than attention share details such as their name, role or title, company, email, and similar information.
- As leads continue interacting with your business, they can move through your sales stages, categorized based on how likely they are to buy.
- SQLs sit in the top tier of the sales pipeline. These are prospects who show strong intent to purchase, and they also fit your ideal customer profile. In simple terms, they meet the right conditions.
- At this point, they have moved past basic marketing actions and have also been checked and reviewed by the sales team as a strong chance to become customers.
Sales Qualified Lead (SQL) Growth in 2024
(Source: drivetrain.ai)
- The chart points to a steady rise in Sales Qualified Leads during 2024.
- According to TechTarget, an SQL is a lead that has been checked and marked as ready for sales, based on intent signals and qualification rules.
- In January, there were 93 SQLs; February slipped a bit to 88; March bounced back to 99, and April jumped to 221, which is a big step up.
- May added more, hitting 305, as June stayed high at 308, and July was close with 306.
- In August, the count moved up again to 320, while September eased slightly to 318.
- The sharpest jump came from September to October. SQLs went from 318 to 435, which adds 117 leads.
- After that, November rose to 446, and December finished at 455, the top number on the chart.
- Looking at it, the back half of the year seems to have produced more SQLs each month.
- Across the year, the total moved from 93 in January to 455 in December, an increase of 362 leads, or about 389%.
- The pattern is not smooth every month, but the climb after April keeps holding, with higher SQL counts over time.
MQL-to-SQL Conversion
- The MQL-to-SQL rate shows what share of marketing-qualified leads sales takes in as a real sales fit. HubSpot frames the formula like this:

- A 13% cross-industry figure keeps showing up in 2026 benchmark lists.
- One B2B set puts solid results around 15% and reports a typical span of 12% to 18%.
- Another Q1 2026 snapshot shows a 13% median and a 28% top quartile, indicating that the gap suggests better qualification and smoother handoff can lead to more than double the median.
- For instance, First Page Sage data for B2B SaaS reports 51% MQL-to-SQL for SEO-sourced leads.
- Webinar leads are listed at 30%. PPC leads come in at 26%.
- Those figures are higher than the broad cross-industry numbers, so use them as benchmarks for that specific SaaS funnel, and avoid treating them as a one-size-fits-all target.
SQL-to-Opportunity Conversion
- SQL-to-opportunity conversion measures whether sales qualification identifies accounts capable of entering a genuine buying process. The formula is:

- A 13% cross-industry rate appears frequently in 2026 benchmark compilations, while another B2B dataset is around 25% to 30%.
- Another set of compiled figures, which cites First Page Sage and Gartner, puts it nearer 50% to 62%. First Page Sage also has SaaS-focused numbers, and those sit in the middle range is roughly 40% to 48%.
- A lot of the mismatch comes down to how terms are defined. If an SQL just means the sales team took the lead, then a lower SQL-to-opportunity rate makes sense.
- On the other hand, if SQL requires full discovery and buying details that have been checked, then the conversion rate should be higher.
Sales Qualified Leads and Sales Rep Productivity
- A Sales Qualified Lead is a person who is past the Marketing Qualified Lead step. And shown clearer intent to buy.
- In B2B SaaS, that can look like booking a demo or starting a free trial, while in other kinds of businesses, it might be a request for a quote or a call to talk with the sales team.
- The main issue is not only finding these leads, but also moving fast enough while the sales team is juggling other duties.
(Source: salesforce.com)
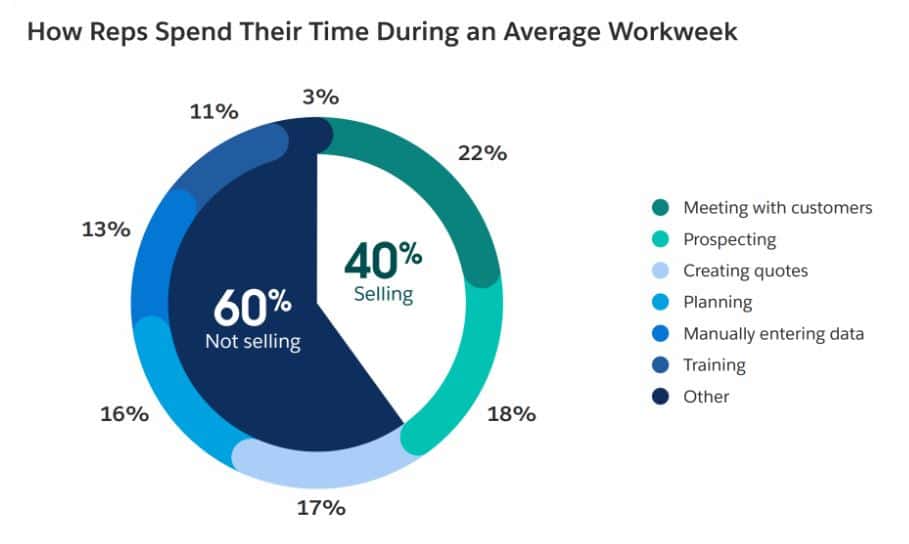
- The breakdown of that 60% is as follows: 22% go to meetings with customers, 18% go to reaching out and prospecting, 17% are spent making quotes, 16% is used for planning, 13% is time spent entering data by hand, 11% is training, and the remaining 3% falls under other tasks.
- A substantial share of representative time goes to admin work, planning, and outreach rather than direct selling.
- Tools that use AI can reduce repeated tasks, highlight buying signals, and help decide which leads to handle first.
- The goal is to help reps spot the right opportunities and act on them instead of generating more SQLs, while cutting down the time lost to manual work.
Sales Is Becoming More Demanding for Both Reps and Buyers
(Source: salesforce.com)
- Looking at the numbers in 2026, it seems the sales world has moved, and sales representatives now deal with tougher expectations, but they still have less time to do the job.
- The Salesforce State of Sales, 7th Edition points to several key points from sales staff and found that 69% say customers care more about clear return on investment than they did a year ago. In practice, this means buyers want calls that tie what is being sold to real business results.
- Next, 67% report that personalization matters more now, indicating people expect sales teams to know what they need, not just send the same message to everyone.
- Another 67% say their customers need a lot of education, which often means reps must walk buyers through how the solution works, why it fits, and why it could matter, before the buyer feels ready to act.
- Lastly, 57% of sales professionals say customers take longer to decide than they used to, as longer decision-making can require sales reps to maintain engagement for more time while continuing other responsibilities.
- Buyers want stronger evidence, better fit, and more explanation before they decide.
- For sales groups, that adds strain on time they already do not have, and the main issue is finding a workable balance between deeper conversations and the normal load of selling.
How Data Silos Create Hidden Sales Challenges
(Source: salesforce.com)
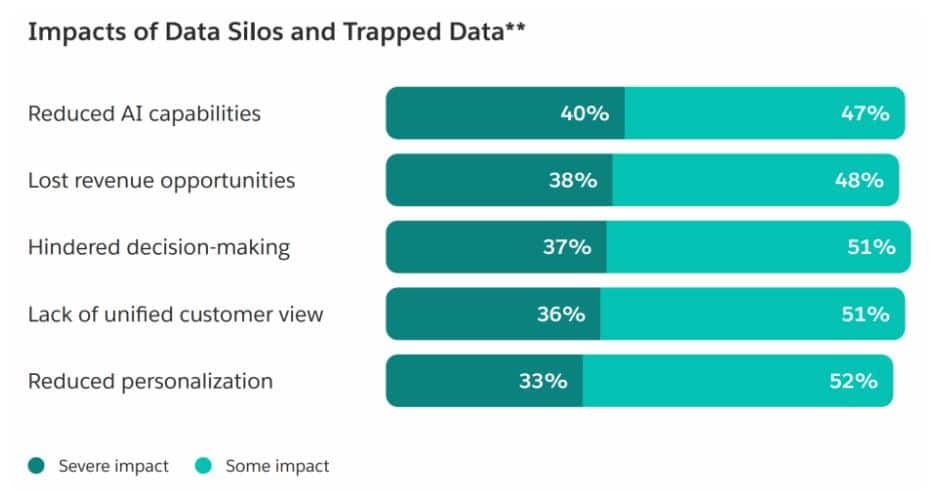
- The chart makes it clear that data silos are not just a tech problem, as they can affect multiple steps in the sales workflow.
- In the Salesforce State of Sales, 7th Edition, the report says trapped or cut-off data hits sales groups in two main ways: some effects are severe, and Others are moderate.
- About 33% say the impact is severe, and another 52% report some effect and suggest teams do not get full context about customers, so customizing conversations becomes harder.
- Roughly 36% call the impact severe, and about 51% say they feel some impact, making customer details harder to gather and view as one clear set of information.
- Decision-making also suffers, with 37% reporting a severe impact and 51% some impact.
- Revenue outcomes follow the same trend, as 38% say the effect is severe, while 48% report some impact.
- AI performance shows a close match: Around 40% report a severe drop in AI capabilities and 47% report some reduction.
- Overall, the numbers point to real everyday friction, which shows up in understanding customers, making choices, and using AI in a useful way.
- Salesforce also notes that sales teams rely on an average of eight tools, illustrating why keeping data linked matters as an operational concern.
Lifecycle Conversion Benchmarks
| Stage Transition | Benchmark Conversion Rate |
| Visitor to Lead | 2-5% |
| Lead to MQL | 15-25% |
| MQL to SAL | 70-85% |
| SAL to SQL | 15-20% |
| MQL to SQL (overall) | 13% average |
| SQL to Opportunity | 50-60% |
| Opportunity to Customer | 20-30% |
| Lead to Customer (overall) | 1-3% |
(Source: upliftgtm.com)
- Lifecycle benchmarks show where potential buyers stop moving through the steps. In the data given, Visitor to Lead runs at about 2 to 5 %, followed by Lead to MQL landing near 15 to 25 %.
- When someone reaches MQL, 70 to 85 % move on to SAL, while 15 to 20 % of SALs turn into SQLs.
- On average, MQL to SQL is around 13 %, which gives a simple reference point for how qualification is working.
- Later stages follow a similar pattern, as Half to 60 % of SQLs become opportunities, and 20 to 30 % of opportunities turn into customers.
- If you combine the whole path, the overall Lead-to-Customer rate is about 1 to 3 %. These results also explain a key risk. If you look at only one step, you can miss where the real problems are.
- Conversion varies based on industry, deal size, and how sales is run. A product-led company with a free trial may see a very different funnel than an enterprise firm selling six-figure deals.
- One more note from the benchmark suggests that if MQL to SQL falls under 10 %, it can point to qualification that is too wide; if it rises above 25 %, it can point to criteria that are too strict.
- Teams should watch their own history over time and can check what changed, instead of leaning only on outside averages.
SQL to Closed By Industry
| Industry | SQL to Closed Won Rate |
| Addiction Treatment | 21% |
| Aerospace & Aviation | 18% |
| Automotive | 20% |
| B2B SaaS | 12% |
| Biotech | 11% |
| Business Insurance | 19% |
| Construction | 16% |
| Cybersecurity | 12% |
| Engineering | 14% |
| Environmental Services | 13% |
| Financial Services | 16% |
| Fintech | 14% |
| Healthcare | 13% |
| Heavy Equipment | 20% |
| Hotels & Resorts | 21% |
| HVAC | 29% |
| Industrial IOT | 16% |
| IT & Managed Services | 20% |
| Legal Services | 19% |
| Manufacturing | 13% |
| Oil & Gas | 12% |
| Pharmaceutical | 19% |
| Real Estate | 14% |
| Software Development | 15% |
| Solar | 13% |
| Staffing & Recruiting | 16% |
| Transportation & Logistics | 14% |
(Source: firstpagesage.com)
Cost Per SQL (CPSQL) Benchmarks by Channel
| Acquisition channel | Directional 2026 CPSQL | Evidence and interpretation |
| Organic SEO and content | $100–$400; $200–$500 is a practical mature-program planning band | Here is a rough SaaS benchmark; it assumes an MQL cost between $40 and $180. It also assumes about 51% of MQLs turn into SQLs. |
| Organic, fully loaded FPS-derived scenario | About $784 | This version is worked out from three inputs. It uses $164 organic CPL. It uses 41% lead-to-MQL. It uses 51% MQL-to-SQL.It is a math scenario, not a posted CPSQL number from First Page Sage. |
| Google Ads / paid search | $900–$2,500 | Next is a specialized SaaS benchmark for 2026. The cost is higher when keyword intent is stronger, but also higher when you aim at larger accounts. |
| PPC, fully loaded FPS-derived scenario | About $3,312 | That 2026 version is based on $310 paid CPL. It uses 36% lead-to-MQL and 26% MQL-to-SQL. |
| Outbound SDR | $1,000–$5,000 | In the specialized benchmark, MQL cost is $350 to $950. The MQL-to-SQL rate is 15% to 25%. |
| LinkedIn paid acquisition | Commonly above SEO and potentially above $1,000 at the SQL stage | For lead-level costs, you might see $75 to $200 before qualification losses are counted. In SaaS, the MQL-to-SQL rate is closer to 30%. |
| Webinars | Usually mid-range, highly dependent on attendance quality | Another reported range puts lead-level costs at about $45 to $120, and MQL-to-SQL at about 39%. |
| Events and trade shows | Frequently among the highest-cost channels | A different lead-level view shows about $200 to $600 before qualification, and cites a three-year average ROI of 16% for trade shows, per First Page Sage. |
Conclusion
The performance of SQL in 2026 is inconsistent because there is a variance in how organizations define the qualification and funnel stages. The MQL-to-SQL benchmark ranges between 13% and 26%, and the SQL-to-opportunity conversion may vary by anything from 25% to 62%. B2B SaaS channel differences are also apparent; for instance, SEO accounts for the highest MQL-to-SQL conversion rate of 51%, while PPC grows the conversion rate to only 26%.
The lifecycle benchmarks show around 50%–60% of SQLs convert into opportunities, and roughly 20%–30% of opportunities convert into customers. Buyer expectations also put extra pressure on salespeople, as reported by 69% of them, who say there is more emphasis put on measurable ROI.
In terms of analysis, it must be noted that maintaining consistent definitions, keeping cohort tracking, and response time, as well as the metrics of downstream revenue, are important.
FAQ
Benchmarks put MQL-to-SQL at roughly 13% to 26%.
Published ranges run from 25% to 62%. For SaaS, the figures are often around 40% to 48%.
SEO leads hit 51% MQL-to-SQL conversion in the First Page Sage benchmark that was cited.
The lifecycle benchmark suggests 50% to 60% of SQLs become opportunities.
The supplied industry data ranges from 11% in Biotech to 29% in HVAC.


