






Introduction
Qualified Lead Statistics: Qualified leads live where marketing stops being just activity and starts turning into real revenue opportunities. In 2026, the line is harder to hold. Low-cost form submissions can flood the pipeline and still not create real opportunities for sales. Good qualification means the lead matches the right customer profile, shows clear buying intent you can measure, has data that is actually usable, and gets a fast response rather than relying on downloads or email opens alone. More B2B teams are shifting away from fixed scoring models to clear, high-intent steps instead, while delays in follow-up keep hurting conversion rates.
The article below breaks down what to track for MQLs, SQLs, accepted leads, predictive scoring, and how the funnel affects pipeline quality and customer acquisition results.
Featured Selection
- Lead-to-SQL conversion is about 37% on average, with the median around 36%.
- SQL-to-opportunity conversion runs near 41% on average, with the median around 40%.
- Enterprise Software and SaaS shows the top CPQL at $447 for each qualified lead.
- Retail technology lands at $147 CPQL, while direct-to-consumer retail is lower, at $54.
- Across 26 industries in the benchmark, CPQL spans from $54 to $447.
- Enterprise firms average $628 CPQL, while Startups and solo operators average $58.
- Larger businesses show $437 CPQL, compared to small businesses show $173.
- On channels, LinkedIn Ads average $387 CPQL, while Paid search averages $312.
- Customer referrals are the cheapest channel at $31 CPQL, while SEO averages $54.
- CPQL changes with sales cycle length to $43 when the cycle is under two weeks, and jumps to $562 when the cycle goes past 12 months.
- Deals over $500K with 12+ month cycles average $562 CPQL.
- Conventional MQL scoring went from 55% of orgs in 2023 to 25% in 2025.
- Use of explicit high-intent actions increased from 19% in 2023 to 30% in 2025.
- Conversion rates decline eightfold after five minutes, while only 0.1% of leads receive engagement within that window.
- 57.1% of first sales-call attempts occur more than one week after lead creation.
Lead-to-Sales Qualified Lead Conversion
(Source: hubspotusercontent-na1.net)
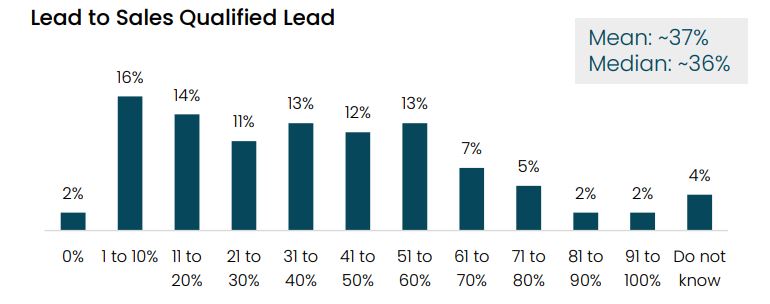
- The chart highlights a broad spread of lead-to-SQL conversion results, with the average sitting near 37% and the median around 36%, suggesting that companies are not all running the same level of sales qualification well.
- Most respondents fall in the low bands, as one group, 16%, lists 1%–10%, another 14% reports 11%–20%, while 11% shows 21%–30%.
- Middle ranges make up the next chunk; conversion rates of 31%–40% account for 13%, followed by 12% reporting 41%–50%, and another 13% also fall in 51%–60%.
- On the higher side, 7% report 61%–70%, while 5% reach 71%–80%.
- Small groups show 81%–90% at 2% and 91%–100% at 2%, while 4% do not know their conversion rate.
- The median near 36% matters here; it shows that half of the results are below that number and half are above, while the mean near 37% is close, so the center of the data lines up.
- Gartner has shared B2B funnel findings that show conversion can change a lot across funnel steps and company types.
- Other benchmark sources also point out that MQL to SQL outcomes depend on how teams define qualification and on the business setup.
Sales Qualified Leads to Opportunities Statistics
(Source: hubspotusercontent-na1.net)
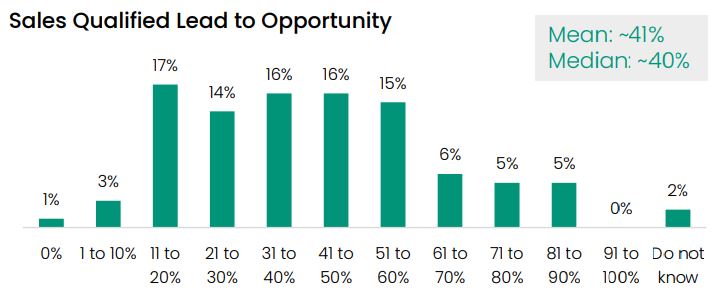
- The chart shows how often a Sales Qualified Lead turns into an opportunity.
- The average value is about 41%, while the median is near 40%, so most results land close to the middle.
- A big chunk is between 11% and 60%, split by range: 17% for 11–20%, 14% for 21–30%, 16% for 31–40%, 16% for 41–50%, and 15% for 51–60%.
- At the low end, 1% report 0%, while another 3% report 1–10%.
- On the high end, 6% are in 61–70%. 5% are in 71–80%, and 5% are in 81–90%. No one reports 91–100%. Also, 2% choose “Do not know.”
- The above figures are spread out rather than clustering at one point, but the 40% to 41% area is the best quick reference.
- For context, the RevOps Report lists SQL-to-opportunity benchmarks near 40%, although benchmarks can change based on business model and how each team defines the metric.
Average Cost Per Qualified Lead by Industry in 2026
| Industry | Average CPQL | Typical Range |
| Enterprise Software/SaaS | $447 | $320-$625 |
| Healthcare Technology | $412 | $285-$580 |
| Financial Services (B2B) | $389 | $275-$520 |
| Cybersecurity | $376 | $290-$495 |
| Manufacturing (Industrial) | $341 | $245-$460 |
| Legal Services | $328 | $215-$465 |
| Commercial Real Estate | $315 | $220-$430 |
| Consulting Services | $298 | $185-$425 |
| Marketing Technology | $287 | $195-$395 |
| HR Technology | $264 | $180-$370 |
| Telecommunications (B2B) | $251 | $165-$350 |
| Engineering Services | $239 | $170-$325 |
| Logistics & Supply Chain | $227 | $155-$310 |
| Construction Services | $214 | $145-$295 |
| Education Technology | $198 | $125-$285 |
| Accounting & Finance Services | $186 | $120-$265 |
| Insurance (B2B) | $173 | $110-$245 |
| Hospitality Technology | $159 | $95-$235 |
| Retail Technology | $147 | $85-$220 |
| E-commerce Software | $134 | $80-$195 |
| Fitness & Wellness (B2C) | $118 | $65-$180 |
| Consumer Services | $97 | $55-$155 |
| Food & Beverage | $83 | $45-$135 |
| Travel & Tourism | $76 | $40-$125 |
| Entertainment | $68 | $35-$110 |
| Retail (Direct-to-Consumer) | $54 | $25-$95 |
(Source: focus-digital.co)
- The 2026 CPQL benchmarks vary a lot between 26 industries, which spread seems tied to sales complexity, deal size, who the buyer is, and how long it takes to close.
- In the dataset here, CPQL values run from $54 up to $447, while Distribb also lists a 2026 overall mean near $198, with range by industry going from $31 for referrals up to $447 for enterprise software leads.
- Enterprise Software and SaaS sit at the top with an average of $447, and the band runs from $320 to $625.
- Next are Healthcare Technology at $412, with $285 to $580; B2B Financial Services comes in at $389, from $275 to $520, while Cybersecurity follows at $376, from $290 to $495.
- Other high-cost areas include Manufacturing at $341, from $245 to $460; Legal at $328, from $215 to $465; Commercial Real Estate at $315, from $220 to $430; Consulting at $298, from $185 to $425; and Marketing Technology at $287, from $195 to $395.
- In the middle, HR Technology is $264, between $180 and $370. Telecommunications is $251, between $165 and $350. Engineering is $239, between $170 and $325. Logistics is $227, between $155 and $310. Construction is $214, between $145 and $295. EdTech is $198, between $125 to $285. Accounting and Finance is $186, from $120 to $265.
- Lower CPQL values include B2B Insurance at $173, from $110 to $245; Hospitality Technology is $159, from $95 to $235; Retail Technology is $147, from $85 to $220; E-commerce Software is $134, from $80 to $195; and Fitness and Wellness is $118, from $65 to $180.
- Consumer Services is $97, from $55 to $155; Food and Beverage is $83, from $45 to $135; Travel and Tourism is $76, from $40 to $125; Entertainment is $68, from $35 to $110; and Direct-to-Consumer Retail is $54, from $25 to $95.
- The above numbers are used as benchmarks, not as universal goals, because CPQL definitions and the way studies count and calculate it are not always the same.
Average Cost Per Qualified Lead by Company Size
| Company Size | Employee Count | Average CPQL | Target Audience |
| Enterprise | 5,000+ | $628 | C-suite, VPs, multiple stakeholders |
| Large Business | 1,000-4,999 | $437 | Directors, Senior Managers, VPs |
| Mid-Market | 250-999 | $284 | Managers, Directors |
| Small Business | 50-249 | $173 | Business Owners, Department Heads |
| Micro Business | 10-49 | $96 | Owners, Solo Decision-Makers |
| Startups/Solopreneurs | 1-9 | $58 | Founders, Individual Practitioners |
(Source: focus-digital.co)
- Company size lines up with CPQL in 2026. Focus Digital’s 2026 report says enterprises with 5,000 or more workers post an average CPQL of $628.
- The next tier is large firms with 1,000 to 4,999 employees at $437, and Mid-market companies with 250 to 999 employees come in at $284.
- Small businesses in the 50 to 249 range average $173, and Micro businesses with 10 to 49 employees average $96.
- In bigger organizations, there may be C-suite involvement and several stakeholders to convince, but in smaller setups, the path to the owner or one direct decision-maker can be shorter.
- Sopro’s B2B benchmark lists average CPL values of $348 for firms with 1,000+ employees, with 1,000+ employees, $212 for 201–1,000 employees, $180 for 51–200 employees, and $146 for 2–50 employees.
- CPQL needs to be matched to the right peer set and use comparable company size and similar deal complexity, but do not treat CPQL as a single standard for everyone.
Average Cost Per Qualified Lead by Marketing Channel
| Marketing Channel | Average CPQL | Best For | Time to ROI |
| LinkedIn Ads | $387 | B2B, Enterprise targeting | 3-6 months |
| Paid Search (Google Ads) | $312 | High-intent searches | 1-3 months |
| Display Advertising | $289 | Brand awareness, retargeting | 6-12 months |
| Facebook/Instagram Ads | $247 | B2C, SMB targeting | 2-4 months |
| Industry Events/Trade Shows | $231 | Networking, relationship building | 3-9 months |
| Direct Mail | $218 | Account-based marketing | 2-5 months |
| Webinars | $186 | Thought leadership, education | 2-4 months |
| Content Syndication | $173 | Lead volume, awareness | 3-6 months |
| YouTube Ads | $154 | Video-first audiences | 4-8 months |
| Podcast Advertising | $142 | Niche audiences | 4-8 months |
| Email Marketing (Purchased Lists) | $128 | Quick lead generation | 1-2 months |
| Partner/Referral Programs | $87 | Warm introductions | 1-3 months |
| Organic Social Media | $73 | Community building | 6-12 months |
| SEO/Organic Search | $54 | Long-term sustainable growth | 6-18 months |
| Customer Referrals | $31 | Existing customer leverage | Immediate-3 months |
(Source: focus-digital.co)
- Lead gen channels do not all perform the same reach different CPQL results. Understanding channel efficiency helps marketers optimize budget allocation and identify opportunities for improvement.
- Paid options such as LinkedIn and Google Ads often bring in leads fast, but cost is usually higher, while organic routes like SEO and referrals can come with cheaper CPQL, but tend to take more time before growth shows up.
- Most teams do best when they run more than one channel, can get quick wins and still build a steady pipeline over time.
Average Cost Per Qualified Lead by Sales Cycle Length
| Sales Cycle Length | Average Deal Value | Average CPQL | Example Industries |
| 12+ months | $500K+ | $562 | Enterprise software, industrial equipment |
| 9-12 months | $250K-$500K | $428 | Complex B2B solutions, consulting |
| 6-9 months | $100K-$250K | $337 | Mid-market software, professional services |
| 3-6 months | $25K-$100K | $219 | Small business software, specialized services |
| 1-3 months | $5K-$25K | $142 | Standard SaaS, business services |
| 2-4 weeks | $1K-$5K | $87 | Simple software, basic services |
| Under 2 weeks | Under $1K | $43 | Consumer products, low-touch services |
(Source: focus-digital.co)
- There is a distinct relationship between the length of the sales cycle and the Cost Per Qualified Lead (CPQL), as the longer the sales cycle, the more costly it is to create a qualified lead.
- For example, the CPQL for deals costing between $1000 and $5000 over a 2–4 week sales cycle is $87, whereas deals costing less than $1000 over a sales cycle of less than 2 weeks have a CPQL of only $43.
- The CPQL over a sales cycle lasting between 1–3 months increases to $142 for deals costing between $5000 and $25000 while for sales cycles lasting between 3–6 months and 6–9 months, the value rises to $219 and $337, respectively.
- B2B sales cycles lasting between 9–12 months show a CPQL of $428 for deals costing between $250000 and $500000 and for sales cycles of 12 months and longer, the CPQL is $562 for deals worth over $500000.
- From the above results, it is evident to know that because of the increased nurturing of leads, their costs become higher.
The Shift to Intent-Based Qualification (BANT vs. Signal-Based Scoring)
| Qualification dimension | Traditional BANT | Static point scoring | Signal-based predictive scoring |
| Primary question | Do we know if the prospect has money, the power to decide, a real need, and a time frame? | Has this contact already earned enough points from past signals? | Based on what we see right now, will this person or account likely move forward? |
| Best application | Sales discovery and checking that the opportunity is real. | Early focus for marketing, using a few simple rules. | Ongoing review of accounts, routing them, and picking the next step. |
| Main data | Verified discovery details from the seller. | Company profile facts plus standalone engagement moments. | First-party behavior, third-party intent, CRM history, product activity, and account-level engagement. |
| Treatment of time | This process notes the prospect’s own time frame. | Sometimes older actions still matter, but only if they have enough weight. | We score with a focus on what is happening now, including how often it happens, how quickly it moves, and the order of events. |
| Buying-group visibility | Often starts with people you already talk to. | It usually checks each contact on its own. | Sometimes it adds up actions from different people tied to the same account. |
| Principal strength | In some cases, it finds the real buyers only after a lot of study is done. | It uses automation that is clear and costs less than expected. | Detects changing purchase propensity before every qualification fact is known. |
| Principal weakness | Could spot clients only upon serious mention. | Can mistake engagement activities for real intention to buy. | Relies upon quality of information, identity resolution, model governance, and explainability. |
| Appropriate SQL trigger | Confirmed discovery criteria. | Permanent quantitative threshold. | Good fit and intention followed by confirmation by sales or a highly qualified event. |
| Recommended success metric | Progression of opportunities and ratio of wins. | MQL approval and adherence to the threshold. | Incremental growth of accepted leads, pipeline, sales, and quality assessment speed. |
The Impact of AI on Lead Qualification Speed
- Artificial Intelligence is accelerating the process of lead qualification through its software agents, predictive scores, account enrichment, and automatic routing.
- InsideSales conducted a study that observed the pattern of more than 55 million sales transactions, 5.7 million inbound leads, and over 400 different companies, with conclusions stating that conversions dropped by a factor of eight after five minutes.
- AI can evaluate potential buyers’ actions such as queries about price points, application of products, requests for demos, responses to emails, and number of visits to their websites.
- According to Norwest’s B2B benchmarks, the traditional techniques have dropped from 55% in 2023 to 25% by 2025, while the number of companies that depend on high-intent behavior has grown from 19% to 30%.
- Almost one-fourth of people surveyed stated that they combine engagement with the coincidence of MQL criteria with the target persona they have in mind.
- The objective of AI is to improve the quality of leads rather than merely increasing the number of leads.
- For better results, marketing professionals should measure the following parameters such as speed of response, acceptance of MQLs, conversion of MQLs to SQLs and SQLs to opportunities, the KPIs per qualified lead, competition rate, revenue, and both false and true positives and negatives.
Conclusion
To sum up, the efficiency of qualified leads in 2026 depends on the ability of organizations to combine their qualification activities with the cost, time, and intent. The average lead conversion to SQL is around 37%, while SQL conversion to opportunity is about 41%. CPQL varies greatly from 31 dollars for customer referrals to 628 dollars for corporations.
The longer the sales cycle is, the more qualification costs it incurs, which may reach 562 dollars in the case the cycle lasts over 12 months. Recent research shows that conventional scoring has lost its relevance. Hence, it is essential to combine acceptance, the cost of a qualified lead, and false and true positives and negatives.
FAQ
The average lead-to-SQL conversion rate stands at around 37%, with the median being about 36%.
SQL opportunity conversion rate is approximately 41%, with the median being about 40%.
CPQL is lowest for customer referrals at $31 per qualified lead.
CPQL rises from $43 for sales cycles of under two weeks to $562 for cycles exceeding 12 months.
Old-style MQL scoring dropped from 55% to 25% in 2023, while explicit high-intent actions went up from 19% to 30%.