









Introduction
MQL Statistics: MQLs are still a key demand-gen metric in 2026, but quality matters more than getting lots of leads. In many B2B settings, people often use a 13% MQL-to-SQL benchmark, indicating about 1 out of 8 MQLs turns into a sales qualification. Stronger teams do better, while they tend to focus on their ICP more tightly, better behavior scoring, and smoother sales and marketing handoffs.
This article will give you an overview of MQL statistics and their benchmark conversion rate in 2026.
Featured Selection
- A 13% MQL-to-SQL rate is common, while the top programs can reach about 28%.
- At 13%, you need around 769 MQLs to reach 100 SQLs. At 28%, it is closer to 357.
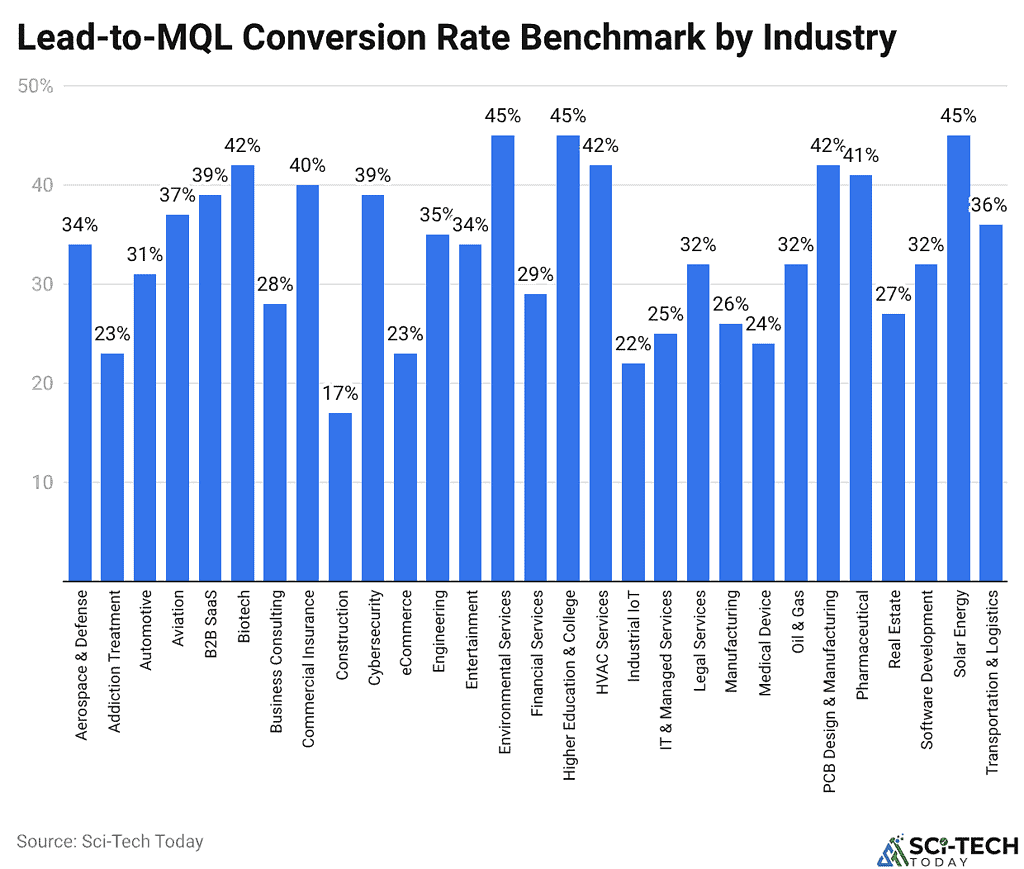
- Environmental Services, Higher Education, and Solar Energy show the best lead-to-MQL rate at 45%.
- Construction is the lowest in the dataset at 17%; client referrals rank highest for lead-to-MQL conversion at 56%, and Executive Events follow at 54%.
- Lead-to-MQL benchmark across industries and channels is 31%.
- In one common finding, 68% of organizations do not share funnel stage definitions between marketing and sales.
- When teams track pipeline velocity weekly, they report 34% revenue growth. Irregular tracking is linked to 11% revenue growth.
- Leads reached within five minutes have a 32% close rate. After 24+ hours, the close rate drops to 12%.
- Effective lead scoring is linked with 26% higher lead conversion. It also ties to 50% higher annual revenue. Costs per lead are reported as 25% lower.
What is an MQL?
- A marketing-qualified lead is someone marketing thinks has a better-than-average chance to buy. Most of the time, qualification comes from a mix of signals.
- Fit: This can include company size, industry, region, role, seniority, tech tools, the use case, or other traits from an ideal-customer profile.
- Engagement: This is based on things they do, like grabbing a piece of content, joining a webinar, opening and clicking nurture messages, coming back to the website, or asking for more details.
- Intent: Higher-value activity, visits to product pages, pricing pages, demo pages, comparison pages, implementation pages, or customer stories.
- Buying-stage proof: These signals suggest they have moved past general reading and into real evaluation.
- An MQL does not mean they are automatically ready to talk with sales, leading to passing a cutoff that marketing set, and either deserves deeper nurturing or should be routed to sales under an agreed service-level agreement (SLA).
- An SQL has been checked more closely by sales and is treated as a real active chance to win a deal.
MQL Funnel Math for 2026 Planning
- A business wants 100 SQLs each quarter. It gets 13% of MQLs to turn into SQLs, generating approximately 769 MQLs:

- If the company lifts the MQL-to-SQL rate to 28%, the math changes. With the same 100 SQL goal, it would need around 357 MQLs:

- So the gain is roughly 412 fewer MQLs. It illustrates why refining lead review and qualification often adds more pipeline than just spending more at the top.
- A stronger planning approach starts work backwards from revenue:

- If a company’s target is $1 million in new revenue. Assume the average deal is $50,000, a 25% SQL-to-win rate, and a 13% MQL-to-SQL rate; it would need:
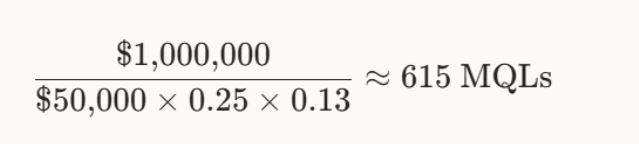
- To achieve $1,000,000 in revenue at $50,000 per deal means 20 closed-won deals. At a 25% SQL-to-win rate, the company needs 80 SQLs ($20 / 0.25$). Then, with a 13% MQL-to-SQL rate, the needed MQL count is about 615 ($80 / 0.13$).
Lead-to-MQL Conversion Rate Benchmarks by Industry
(Reference: firstpagesage.com)
- Conversion rates from lead to MQL are not the same across industries, as data indicate that one lead plan can look strong in one field and weaker in another.
- In this benchmark set, three areas top the list, with Environmental Services at 45%, Higher Education & College also at 45%, and Solar Energy third at 45%.
- Biotech reached 42%, HVAC Services and PCB Design & Manufacturing are tied at 42%, and Pharmaceutical sits at 41%.
- A larger group falls in the 35% to 40% band, with Commercial Insurance reaching 40%, while B2B SaaS and Cybersecurity each come in at 39%.
- Aviation is at 37%, Transportation & Logistics is 36%, Engineering lands at 35%, while Aerospace & Defense and Entertainment both show 34%.
- The numbers move down further. Legal Services and Oil & Gas are each 32%, Software Development is also at 32%, and Automotive is 31%.
- Financial Services drops to 29%, Business Consulting is 28%, and Real Estate is 27%.
- The lowest results show up later, with Manufacturing at 26%, IT & Managed Services at 25%, Medical Device at 24%, and Addiction Treatment and eCommerce are both 23%.
- Industrial IoT is 22%, while Construction is the lowest at 17%.
- The above facts suggest that industry context seems to drive how well raw leads turn into qualified prospects.
Lead-to-MQL Conversion Rate by Marketing Channel
(Reference: firstpagesage.com)
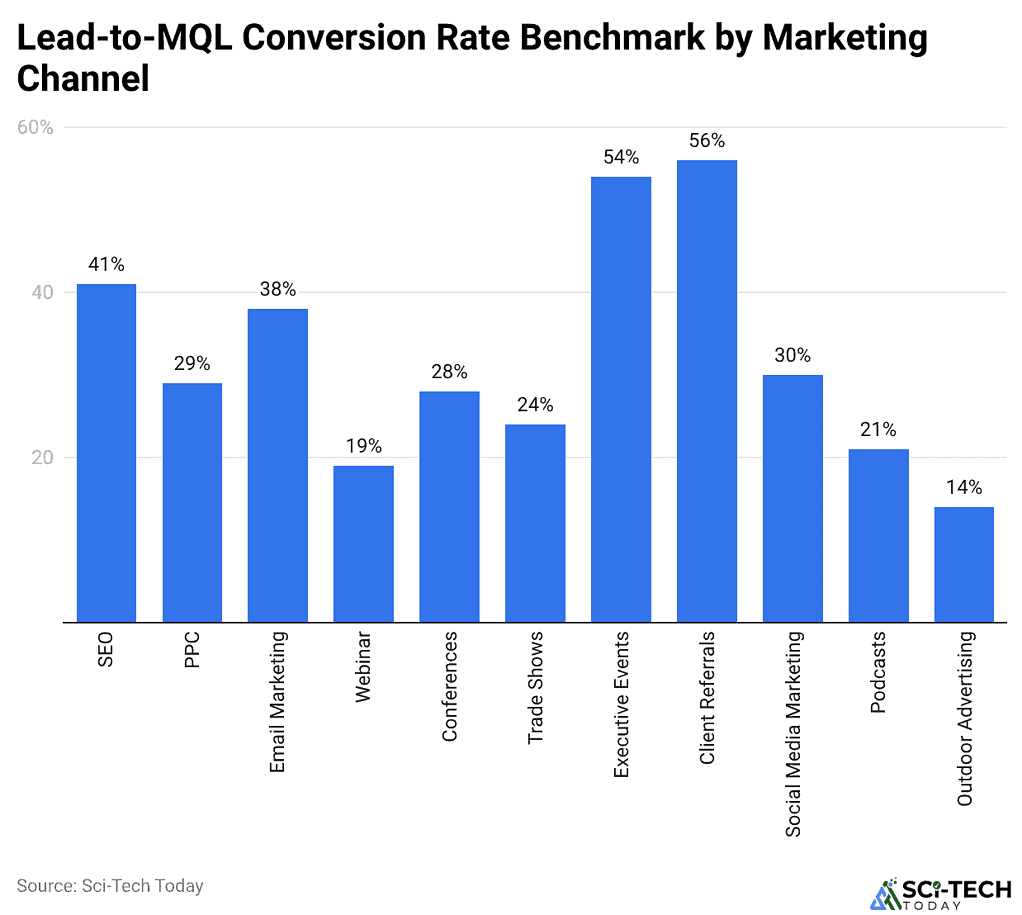
- According to the First Page Sage 2025 benchmark report, based on 10 years of agency client records, change a lot from one channel to another when you look at lead-to-MQL conversion.
- Client referrals sit at 56%, followed by executive events come next at 54%, indicating that leads from trusted and in-person situations tend to qualify well.
- SEO reaches 41% of leads turning into MQLs, while Email marketing lands at 38%.
- Other channels fall in the middle, as Social media marketing is 30%. PPC is 29%, Conferences are 28%, and trade shows are 24%.
- Lower results show up in Podcasts at 21%, Webinars at 19%, and Outdoor ads are lowest at 14%.
- Across industries and channels, the overall mark is 31%. That gives a baseline for comparing results.
- The above outcomes are a reminder to judge channel performance by lead quality too, not only by how many leads show up.
- First Page Sage also says its pool is about 70% B2B, so these benchmarks should guide decisions, but they should not be treated as a one-size-fits-all rule.
Marketing and Sales Alignment Statistics
- Keeping marketing and sales on the same track is still tough for many B2B companies. According to a benchmark using Forrester Research data, 68% of organizations do not use shared definitions for funnel stages across both teams.
- When there are no common labels, the hand-off becomes fuzzy, and marketers can read terms like MQL, SQL, or opportunity in different ways, which makes it harder to compare results in a steady way.
- Some reports link organisation with weak marketing and sales alignment to a loss of 10% or more of annual revenue, indicating the cause is often inefficient work and missed chances. So this is not just an internal messaging problem; It can show up in revenue efficiency.
- A historical SiriusDecisions study, now part of Forrester, points to measurable differences: teams that are aligned see 24% faster revenue growth than teams that are not aligned.
- They also report 36% higher customer retention, suggesting coordination can affect the relationship after the first conversion, not just the first lead.
- For ABM efforts, shared landing pages that connect to CRM and analytics tools can help both groups rely on the same data.
- The main point is simple: use clear funnel stages, keep the data consistent, and agree on the hand-off rules, which gives a better base for judging lead quality and revenue results.
Continuous Improvement Through Pipeline Tracking and CRM Integration
- Tracking lead flow more often can help teams react faster. The benchmark suggests a clear split: firms that check pipeline speed every week reach 34% revenue growth, compared with those that check only now and then sit at 11%. The difference highlights the value of consistently monitoring how fast deals move through the funnel and spotting delays sooner.
- Weekly check-ins also give teams a chance to try small fixes and can test changes before the delays grow into bigger issues.
- There is also the CRM angle. When teams work from the same CRM view, they convert over 30% of MQLs. When teams run separate systems, the conversion rate is about 13%.
- That difference implies that when marketing and sales can see the same pipeline details, it is harder for data to go missing. It also tends to make handoffs smoother.
- On the operations side, some automation can save time, and teams can move from account lists to ready campaign pages without relying on engineering support for each small update.
Why Are MQLs Converting at Lower Rates in 2026?
- MQL-to-SQL rates might seem lower in 2026, is mainly because the old MQL setup is not tracking the whole buying path anymore.
- Many buyers now spend time with AI assistants, talk in peer groups, and read content through channels that do not show up clearly in web forms.
- So some buyers show up as MQLs very soon, while others only reach you after they have already picked a few vendor options.
- In both cases, fewer prospects stay in the middle part of the funnel, where classic nurturing usually works best.
- Another factor is how MQL count and intent line up. When teams sometimes try to keep MQL volume up by widening who qualifies, the conversion rate can fall simply because the pool can include more people with weaker intent.
- MQL-to-SQL conversion rate drops should therefore be read alongside SQL volume: a lower rate with rising SQL numbers can indicate broader top-of-funnel coverage, while a lower rate combined with declining SQL volume deserves closer attention.
- A third shift is that some strong leads skip the MQL step. Some GTM motions use signals to move straight to sales, such as visits to pricing pages, bumps in hiring, and technology-stack changes to identify accounts for direct sales engagement.
- As more As GTM engineering becomes more common, you can see MQL-to-SQL rates decline, while the qualified pipeline may grow, because the best prospects are sent to sales right away, rather than captured as MQLs in the same way.
MQLs vs. PQLs (Product-Qualified Leads) in SaaS
| Dimension | MQL | PQL |
| Qualification basis | Marketing engagement (content, email, forms) | Verified in-product usage and value |
| Conversion to paid / next stage | <5–10% (13% MQL→SQL) | 20–30% (median ~25%) |
| 2026 median conversion | 19% (MQL→SQL) | 32% (PQL→paid) |
| Relative conversion advantage | Baseline | 5–6x higher |
| ProductLed survey (600+ firms) | 9% free-to-paid median | 25–30%, up to 39% at $5–10K ACV |
| Top-quartile / best-in-class PQL | — | 45%+ / 55%+ |
| Customer acquisition cost (motion) | $5,000–$50,000 (sales-led) | $100–$500 (product-led) |
| Revenue growth (motion) | 21% YoY (sales-led) | 50% YoY (product-led) |
| Adoption among B2B SaaS (2026) | Traditional default | 58% now run a PLG motion |
How to Improve MQL-to-SQL Conversion Rate
- A Harvard Business Review study, titled The Short Life of Online Sales Leads, reviewed 2,241 U.S. firms and looked at 1.25 million leads.
- Companies that reached out within one hour found that the lead was about 7 times more likely to qualify than if they waited another hour; when companies waited 24 hours or more, the gap grew to more than 60 times, while only 37% of teams replied within the first hour. About 23% never replied at all. On average, replies took 42 hours.
- Optifai’s newer data across 939 B2B companies shows the same pattern, indicating reply time was 47 hours, and Leads that were contacted within five minutes had a 32% close rate, compared with those contacted after 24 hours or later had a 12% close rate- about 2.6 times higher when the first touch was fast.
- After that, the next task is simple to state: there is a need for a clear MQL definition, a sales SLA that spells out the qualification rules, and coverage of reply time, lead volume, and what to do with rejection feedback. Then lead scoring can match firm details with what the lead does.
- Aberdeen research indicates that scoring can bring 26% higher lead conversion, and also links it to 50% higher annual revenue, while further claims 25% lower cost per lead for those groups.
- The material cites Forrester research that reports 50% more sales-ready leads at 33% lower cost, while nurtured leads can drive 47% larger purchases.
- In the end, marketers should track conversion by source, by ICP, by product, and by deal size rather than relying on a single benchmark.
Conclusion
MQL results in 2026 depend more on how well leads are screened than on how many are generated. What matters most is fit, quick action, and clear handoffs. Many marketers cite a baseline MQL-to-SQL rate of about 13%, while the best quarter is closer to 28%, indicating the big gap. Channel quality also varies, with referrals converting best at 56% lead-to-MQL, compared to webinars are much lower at 19%. Meanwhile, 68% of organizations lack shared funnel-stage definitions, creating measurement and handoff challenges, which makes reporting messy and slows handoffs between groups.
Sales follows up in five minutes; the close rate is 32%, versus 12% after 24 hours. Better scoring, CRM visibility, tracking pipeline steps, and nurturing leads and qualification work tend to improve, and revenue outcomes follow.
FAQ
The usual benchmark is 13%. Top performers reach 28%.
Client referrals top the list at 56%. Executive Events come next at 54%.
In the dataset, Construction is last at 17%.
With contact within five minutes, the close rate is 32%. After 24 hours, it is 12%.
Effective scoring links to 26% higher lead conversion, 50% higher annual revenue, and 25% lower cost per lead.


