








Introduction
Email Open Rate Statistics: While email open rates continue to be a commonly accepted industry practice, they no longer accurately indicate how many people are actually reading their emails. As for plans for the year 2026, MailerLite has reported an overall median open rate of 43.46%, while Klaviyo publishes its benchmarks of 31% for campaigns and 32.2% for automated flows. As these are from different provider populations, they should not be averaged out to come up with a single universal industry average.
One important distinction should be made here: Apple’s Mail Privacy Protection. Due to image loading, the email gets opened, but nobody actually reads it. In this article, various statistics are analyzed, highlighting their trends in 2026.
Major Takeaways
- MailerLite reports a median email open rate of 43.46% while Klaviyo indicates 31% for campaigns and 32.2% for automated flows.
- The communications sector leads the industry with the highest opening rate at 65.14%, while the non-profit organizations take second place with 54.54%.
- On the contrary, Technology & High Tech fails with a 7.40% click-through rate, but Legal Services leads in click-to-open rates with 25.63%.
- The welcome emails usually achieve an open rate of 35%-50%, which signifies a high engagement level of new subscribers.
- Abandoned cart emails have 40% to 55% performance in terms of open rate, while back-in-stock alerts have higher open rates of 45% to 60%.
- Shipping confirmation emails are the winner in the ranking with open rates of 55% to 65%.
- Promotional campaigns usually work at a rate of 20% to 30%, which is much lower than newsletter campaigns of 30% to 40%.
- On average, Email marketing takes US$1 from the budget and returns US$36, with predictions for 2026 reaching US$45.
- A good conversion rate for email marketing is 2% to 3%, whereas the conversion rate for B2C companies reaches 2.8% and B2B companies reach 2.4%.
- Google advises keeping spam complaint rates below 0.1%. Complaint rates above 0.3% will hurt deliverability.
What Makes a Good Email Open Rate?
- A good email open rate is around 20–25%. This is the rate at which users open emails in your campaigns and is a good baseline.
- Open rates can indicate good marketing efforts, especially when coupled with higher engagement levels and better conversion metrics.
- You cannot rely on improving open rates by simply coming up with clever email subject lines.
- Clear and compelling messages will convince your customers to open your emails. Make sure the message is valuable and to the point.
- The first few words of the subject line will often be the only ones to entice the user to click to open. So, keep subject lines brief.
- The optimal email open rates will most often occur at a shorter email subject length, usually less than ten words.
- Good marketing emails depend on a clean and current email list. As subscribers’ email addresses go stale, so do the engagement numbers.
- Email marketing is only as effective as the list you have built and maintain, as you need to segment your list so you send emails that matter to that specific audience. Send relevant emails based on what users want and have done in the past.
- With the benchmark being between 20-25%, there is more room for improvement.
- With more targeted messages, clear communication, segmentation, list maintenance, and most of all, regular testing, email engagement can be even higher.
Email Open Rate and CTR Benchmarks
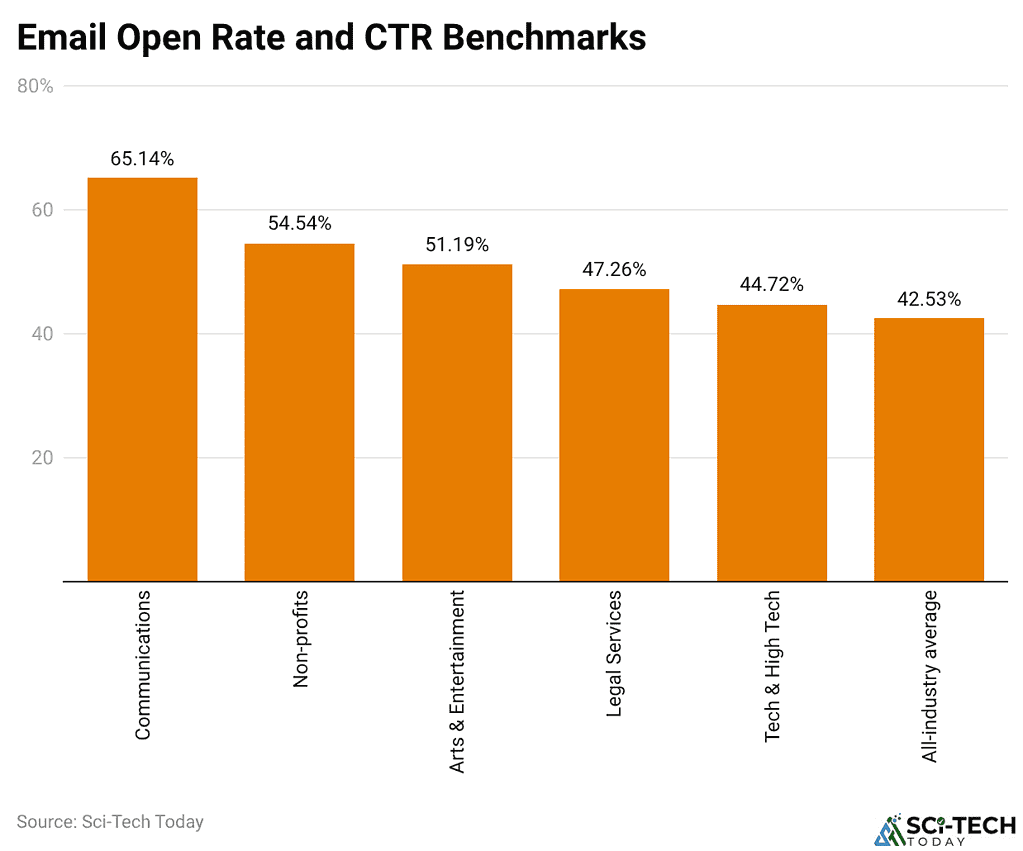
- There are different industries, and consequently different email benchmarks. GetResponse’s 2017 industry report compares 18 industries, covering metrics such as email open rates, CTR, and CTOR.
- For example, Communications holds the highest open rates with 65.14%, and Legal Services has the highest CTR with 12.11% and the highest CTOR with 25.63%.
- Non-profits have open rates just behind Communications at 54.54%, and Arts and Entertainment have open rates at 51.19%.
- Open rates for the other categories in the report fall between 39% and 44%, including Technology and High Tech (44.72%), Health Care (43.95%), Real Estate (42.71%), Retail (41.77%), Education (41.33%), Publishing (39.89%), and Automotive (39.69%). Agencies fall at 39.26% for open rates.
- Other categories have lower open rates, including Restaurants and Food (38.52%), Health and Beauty (38.16%), Sports and Activities (37.28%), Financial Services (34.70%), Travel (32.83%), and Internet Marketing (32.62%).
- CTR shows a different trend. Publishing and Automotive report 5.76%, and Sports and Activities record 6.87%. Following this, Financial Services report 5.34% CTR.
- Remaining industries range between 4.16% and 2.14%, including Arts and Entertainment (4.16%), Real Estate (3.51%), Internet Marketing (3.18%), Education (3.17%), Health Care (3.08%), Travel (2.52%), Restaurants and Food (2.44%), and Health and Beauty (2.14%). Technology and High Tech (7.40%) and Non-profits (6.70%) round out the top.
- CTOR highlights varying subscriber engagement levels, including Sports and Activities (18.43%), Financial Services (15.40%), Automotive (14.51%), and Publishing (14.43%).
- GetResponse’s findings demonstrate that high open rates do not automatically translate into more clicks.
- Marketers should evaluate all three metrics to understand how effectively their emails attract attention and encourage action.
Average Email Open Rates by Email Type
| Email type | Typical open rate |
| Promotional campaigns | 20-30% |
| Newsletters | 30-40% |
| Welcome emails | 35-50% |
| Abandoned cart | 40-55% |
| Back-in-stock | 45-60% |
| Re-engagement | 25-35% |
| Shipping confirmations | 55-65% |
- The timing and purpose of an email can heavily influence its open rates. Combining stats across campaigns like promotions, newsletters, and email automation can be key to any email analysis.
- Some campaigns or industries don’t always drive engagement as strongly as the email type.
- Engagement for emails that rely on subscriber purchase intent or interest usually falls between 35% and 50% for welcome emails, and 40% and 55% for cart abandonment emails, and Welcome emails can even go as high as 60%.
- Transaction emails, such as shipping notifications, perform best at 55% to 65% since the email is a welcome update the customer has likely requested.
- Newsletter engagement usually falls in the 30%–40% range, but that is dependent on content relevance.
- Engagement for promotional emails can fall even lower, typically at 20%–30%, while Email re-engagement can fall anywhere between 25%–35%.
- Engagement for an email can vary based on the intent and the goal of the campaign. Email marketers can see an email with a 30% open rate as a great success if it was sent with the goal of re-engaging old, dormant subscribers.
Email Conversion Rate and ROI Statistics
- Email marketing is a very effective tool for businesses to drive sales and convert their customers. This is primarily because email lists are “owned” channels.
- Customers who have signed up to receive marketing emails are a lot more likely to engage with that marketing content than customers who have not. Also, it’s easier to guide the user towards a call to action when marketing via email compared to social media marketing.
- There is a general consensus within the industry that email marketing yields approximately 3,600% – 3,800% return on investment.
- When examining the business value of email marketing, email lists really excel when the emails sent result in conversions.
- An email conversion rate of around 2%-3% across the board for most industries is considered a success.
- However, email lists tend to be different depending on the business type, so email campaigns sent by B2C companies have a conversion rate of around 2.8%, compared to the email campaigns sent by B2B companies, which is around 2.4%.
- Email lists tend to lose their value the most when marketing emails are sent repeatedly without customers subscribing to the email lists in a new way, such as by providing email signups via lead magnets or using a marketing website signups feature, or when the marketing emails sent aren’t lifecycle emails.
- Marketing email lists sent without automation, such as welcome emails, emails sent after the user abandons their shopping cart, or emails sent to customers that haven’t been active in a long time, also tend to lose their value quickly.
- Using marketing personalization that aligns marketing offers with users who have signed up for marketing lists and who have browsed and clicked links within those marketing lists can also significantly improve the value of marketing email lists.
- In order to see what email marketing really means for their business, marketing lists need to have some metrics in place to monitor the amount of revenue generated per email sent and the cost incurred to drive email conversions, in order to get a clearer picture of email list overall business value.
- In marketing emails sent, the metrics that should matter the most should be email marketing impact, or revenue that can be traced to those marketing emails, and the emails’ contribution to business growth, not just the volume of marketing emails sent.
Email Deliverability and Sender Reputation Statistics
- There are more factors to email deliverability than just authentication. You must consider authentication in addition to cleaning your email lists and sending quality content, all while maintaining good relationships with the domains.
- Most email providers like Gmail, Yahoo, and Microsoft even admit that good email authentication is no substitute for good email practices that may cause a domain reputation to drop and even send emails to the junk or spam folder.
- For the email sender, it’s best to analyze your domain reputation through metrics like email spam complaints.
- Google says that once your spam rate reaches 0.3%, email deliverability to your users’ inboxes starts to significantly decrease.
- Yahoo also says their email sender reputation should be a low 0.3% spam rate.
- For example, if you send 10,000 email messages, only 10 email spam complaints equal a 0.1% spam rate, but 30 email complaints equal a 0.3% spam rate.
- For instance, Gmail will not send email for your organization unless you have authentication and you meet the requirements to send bulk email.
- Additionally, you are expected to follow Gmail’s rules for mass mail, and you should at least meet the SPF, DKIM, and DMARC requirements. The lowest policy for DMARC that Google accepts is p=none.
- For high-volume Outlook mail senders, Microsoft will not deliver your message, giving an error code of 550 5.7.515, if you do not follow authentication requirements as of May 5, 2025.
- Additionally, not sending the correct unsubscribe links or information hurts your domain reputation. Most email clients require a way to let the user unsubscribe, with some taking up to two days.
- Gmail also advises not to use email marketing with unsubscribes in the body.
- You also want to consider that DMARC keys need to be 1024 bits long, with a strong recommendation of using 2048 bits for longer lengths.
- Google Postmaster Tools and Yahoo’s Complaint Feedback Loop can both highlight a sender’s reputation issues.
- Other steps to protecting long-term inbox placement include increasing your sending volumes, configuring your DNS settings properly, and keeping your lists clean.
How to Measure Email Performance Beyond Opens
- Simply relying on open rates is not the best way to determine whether or not your email campaigns are performing well.
- Open rates measure how many people trigger the open signal. This is tricky due to Apple’s MPP and people’s inability to block the open.
- Therefore, open rates should be overlooked in favor of unique click rates to see who has genuinely opened your email.
- Bots should be factored into this analysis to make sure you get a clearer picture of who genuinely clicked on your link.
- There is another way to measure engagement that takes both clicks and recorded opens into account, known as Click-To-Open-Rate (CTOR).
- However, open rates can also be recorded automatically, and this is how open tracking can actually work. If this is the case, an open rate increase with a stagnant click rate would cause CTOR to decrease, even though engagement has remained the same.
- The most effective way to track engagement is via email metrics such as purchase rates and enquiry rates. This tracks engagement with actual business metrics.
- There is value in tracking unsubscribes, especially if there is an issue with the content of the email, how often they are sent, or who they are targeted towards.
- With email engagement comes interest in your products, browsing your products on your website, or placing orders.
- Klaviyo suggests tracking the engagement of an email via these metrics instead of only tracking engagement via opens.
Conclusion
Email open rates are still a valuable metric for determining the visibility of campaigns, but they are not a reliable indicator of subscriber engagement. In 2026, benchmarks differ greatly between sectors, types of emails, and the marketing platforms being used, making it vital to consider the context when analyzing results. Furthermore, Mail Privacy Protection from Apple compromises the reliability of figures given the use of automated tracking signals.
Thus, marketers should merge the open rates with CTRs, conversions, revenue, and rates of unsubscribing in order to get a fair assessment of campaigns. Proper authentication, clean subscriber lists, and low levels of complaints about spam help increase deliverability and sustainability of email marketing.
FAQ
A typical open rate falls within the range of 20-25%, whereas MailerLite indicated a median open rate of 43.46%. Performance will depend on the industry, the type of email, and the method of measurement.
According to GetResponse, there are varying results among industries, with the open rate being 32.62% in Internet Marketing and 65.14% in Communications.
Shipping confirmation emails are notably the most opened ones. These emails usually have an opening percentage between 55%-65% followed by “back-in-stock” emails with an opening rate of 45%-60%.
With Mail Privacy Protection, everybody’s emails are read by Apple’s system, thus giving incorrect information regarding opens.
Marketers need to monitor the uniqueness of clicks as well as the click-through rate, the conversion rate, revenue, cancellations, and complaints regarding spam.