








The Starting Line
Smart Traffic Camera Statistics: Smart traffic cameras are modern cameras that watch roads and help manage traffic in real time. They use clear images, artificial intelligence, and connected networks. Normal cameras only record video. Smart cameras can do much more. They can count vehicles, spot traffic jams, read number plates, and report rule violations or accidents as they happen. Cities and transport authorities use this data to set traffic signal timing, keep traffic moving, and plan for safer roads.
More people are adopting these cameras for a few reasons. Cities are growing fast, more people own vehicles, and governments are investing in smart city programs. Better video analysis, faster data networks, and cloud computing are also making the cameras more accurate and quicker to respond.
This report shares key statistics on how widely these cameras are used, what they are used for, and how the technology is improving. It gives a clear picture of how smart traffic cameras are changing road management.
Eye Picked by the Editor
- The smart traffic camera market is USD 18.7 billion in 2026, projected to reach USD 49.3 billion by 2033.
- San Francisco reported 84% less excessive speeding after 18 months, over 42,000 fewer daily instances.
- New York City’s 600 red-light camera intersections show over 80% less red-light running since installation.
- IIHS counted 392 US communities with speed-camera programs and 360 with red-light camera programs in November 2026.
- Flock reported over 120,000 license-plate cameras across 6,000 communities, while Pew mapped 109,577 cameras.
- West Midlands’ two-week camera trial flagged 17,225 potential seatbelt and 1,920 potential phone offences; no enforcement followed.
- Verra Mobility finalized NYC’s 5-year, USD 998 million traffic-camera contract in February 2026, up 34%.
- Hanoi added 2,460 AI cameras in July 2026; a pilot reported 98.6% daytime enforcement acceptance rates.
- A 10-millisecond radar-camera sync error produces 0.64 m displacement at 230 km/h, Stellarview reports.
Speed Enforcement Camera Statistics
- In November 2026, IIHS counted 392 U.S. communities operating speed-camera programs.
- San Francisco reported 84% less excessive speeding in October 2026, over 42,000 fewer daily instances.
- By October 2026, 63% of San Francisco notice recipients had received no second notice.
- Oakland’s 2026 evaluation recorded 70% fewer vehicles speeding 11+ mph over the limit across 18 locations.
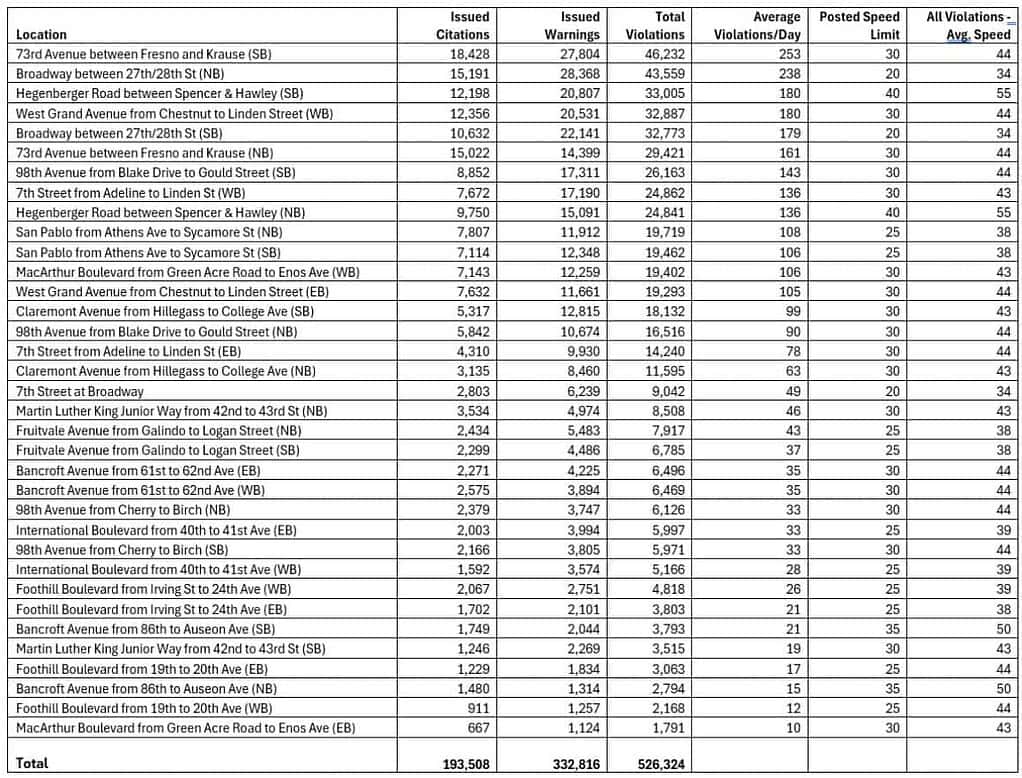
- Through July 15, 2026, Oakland issued 193,508 citations and 332,816 warnings.
Warnings and violations by camera, 1/14/26 – 7/15/26
- Through March 2026, Philadelphia’s Broad Street recorded 67% fewer speeding violations following camera installation in September 2025.
- New York City issued 3,908,976 school-zone speed-camera violations during fiscal year 2026.
- New York City’s fiscal-year 2026 school-zone speed-camera fines issued totaled USD 195,448,800.
Red-Light Camera Statistics
| Location | Reporting period | Statistic | Numeric data |
| United States | November 2026 | Communities operating red-light camera programs | 360 communities |
| New York City | October 21, 2026 | Intersections equipped with red-light cameras; statutory coverage limit reached | 600 intersections |
| New York City | Fiscal year 2026 | Increase in red-light camera violations, attributed to camera expansion | 42% increase |
| New York City | Reported October 2026; change since installation | Reduction in red-light running at camera locations | Over 80% decrease |
| New York City | Reported October 2026; change since installation | Reduction in rear-end collision injuries at camera intersections | Nearly 60% decrease |
| New York City | Reported October 2026; change since installation | Reduction in T-bone crash injuries at camera intersections | 70% decrease |
| New York City | Reported October 2026 | Share of red-light camera violations involving vehicles registered outside the city | Approximately 39% |
| Winter Park, Florida | July 2025–June 2026 | Red-light camera violations issued and paid | Over 25,000 issued; 18,443 paid |
| Winter Park, Florida | July 2025–June 2026 | Revenue generated from red-light camera violations, split between city and state | Over USD 3 million |
| Orlando, Florida | July 2025–June 2026 | Red-light camera notices recorded and revenue collected | Over 60,000 notices; approximately USD 7 million |
Automatic Number Plate Recognition Camera Statistics
- Flock reported over 120,000 license-plate cameras across 6,000 communities in August 2026.
- Pew’s September 2026 analysis identified 109,577 mapped Flock cameras.
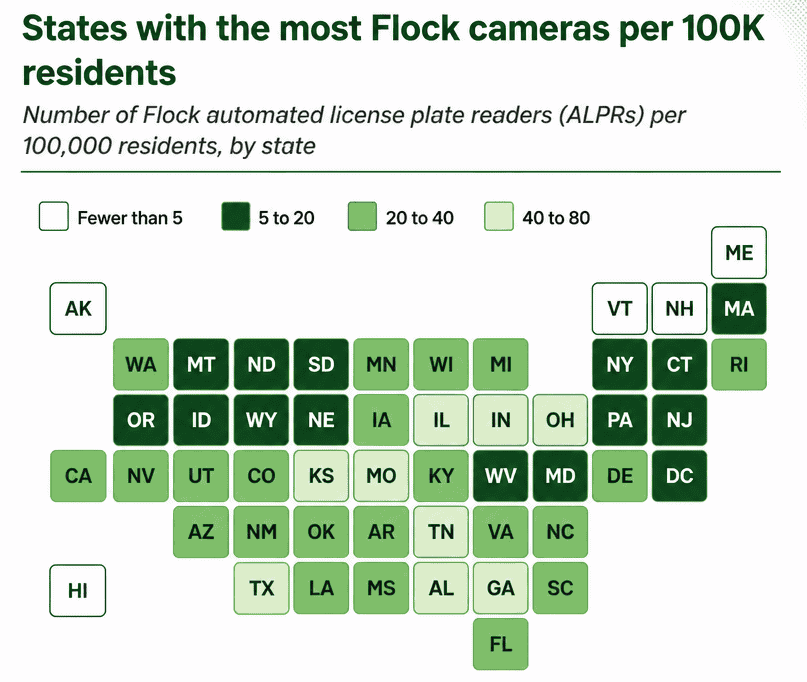
- Approximately 80% of mapped Flock cameras were concentrated in urban areas, according to November 2026 reporting.
- Atlanta and Houston metropolitan areas each contained over 4,000 mapped Flock cameras.
- Los Angeles, Chicago, and Dallas–Fort Worth metropolitan areas each exceeded 3,000 mapped Flock cameras in November 2026 reporting.
- Pew’s transparency-portal dataset covered 1,517 agencies with active public portals as of September 21, 2026.
- Huntsville’s 29 Flock cameras supported 506 searches during the preceding 30 days, reported November 13, 2026.
- Manchester voted in November 2026 to discontinue 18 readers: 17 stationary cameras and 1 mobile camera.
- Lowell had 37 automated plate-reader cameras with 30-day data retention, according to November 12, 2026 reporting.
Smart Traffic Camera Installation Requirements
- With built-in infrared, the installer plans a 4 m mount, 20 to 50 m distance, and 90 km/h maximum.
- Mount: The installer keeps the viewing angle within 30 degrees and plate tilt within 5 degrees, away from direct sunlight.
- Connect: The installer uses RJ45 Ethernet with PoE+ power, finds the camera, and assigns its IP address.
- Secure: The installer creates admin login details over HTTPS and changes passwords at least once every year.
- Focus: The installer zooms until single-row plates are at least 130 pixels wide and two-row plates are at least 70 pixels.
- Configure: The installer turns on recognition, selects the region, and sets detection areas; 1 area can detect both directions.
- Integrate: The installer sets event delivery through TCP or HTTP POST and tests the connection before turning on integration.
- Commission: The installer checks low-light recognition, sets SD storage for up to 100,000 events, and backs up settings.
Smart Traffic Camera Market Growth
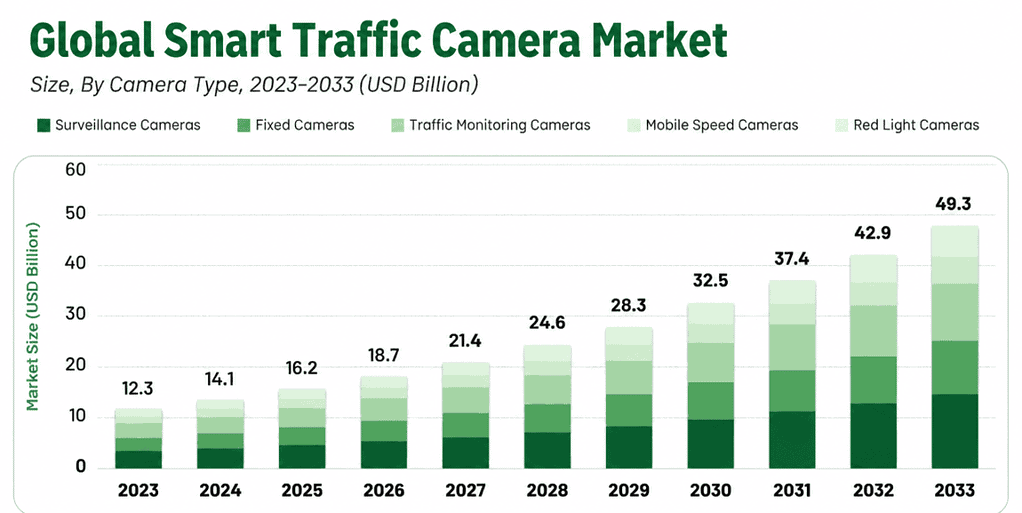
- The global smart traffic camera market is projected to grow from USD 16.2 billion in 2025 to USD 49.3 billion in 2033, at a compound annual growth rate (CAGR) of 14.9% from 2023-2033.
- The market is estimated at USD 18.7 billion in 2026.
- Market value is projected to rise to USD 49.3 billion in 2033, showing larger annual increases toward the end of the forecast period.
Smart Traffic Cameras in Smart City Projects
| City | Date / period | Smart traffic camera project and numeric details |
| San Fernando, Philippines | October 2026 | Almost 200 high-resolution pan–tilt–zoom cameras supported smart traffic management and emergency response. |
| Hanoi, Vietnam | 2026 pilot | Deployed 21 AI cameras; reported law-enforcement acceptance rates reached 98.6% during daytime and 98.1% at night. |
| Hanoi, Vietnam | July 2026 | Added 2,460 cameras, including 1,107 for violations, 960 for traffic-flow measurement, and 30 for speeding. |
| Catania, Italy | April 2026 | Approximately 100 cameras supported AI-powered parking monitoring, urban surveillance, and enforcement. |
| Jaipur, India | July 2026 | Planned AI cameras at 253 of 423 major intersections for enforcement and adaptive traffic signals. |
| Gurugram, India | November 2026 | Tender specified 57 camera-based vehicle detectors, 692 traffic-signal heads, and 228 pedestrian-signal heads. |
| Campeche, Mexico | November 2026 | Vendor reported 34 optimized intersections, 7 green waves, 20% higher traffic volume, and 15% shorter waits. |
| San Rafael, United States | Fiscal year 2026–27 | Proposed up to USD 134,758.25 for 5 traffic cameras, software, and AI traffic-engineering functionality. |
| Mumbai, India | November 2026 | Proposed AI cameras capable of reading number plates above 300 km/h and detecting multiple traffic violations. |
Mobile Phone Detection Camera Statistics
- West Midlands’ March 2026 camera trial flagged 1,920 potential mobile-phone offences across two locations within two weeks.
- Birmingham’s Ladywood cameras flagged 1,163 potential mobile-phone offences during the March 2026 trial; Wolverhampton’s Fallings Park cameras flagged 757.
- Human reviewers checked 8,024 images to assess camera accuracy in the West Midlands trial, reported in October 2026.
- NSW recorded 6,751 camera-detected mobile-phone infringements in October 2026, its lowest monthly total since the technology’s introduction.
- NSW announced in February 2026 that 10 portable mobile-phone and seatbelt detection cameras could monitor traffic in both directions.
- Sussex’s first seven camera-operating days recorded 110 mobile-phone offences and 17 combined phone-and-seatbelt offences, according to September 2026 reporting.
Seatbelt Detection Camera Statistics
- Birmingham’s Ladywood cameras flagged 11,144 potential seatbelt offences during the two-week March 2026 trial.
- Wolverhampton’s Fallings Park cameras flagged 6,081 potential seatbelt offences during the same March 2026 trial.
- Combined, both West Midlands locations flagged 17,225 potential seatbelt offences over two weeks in March 2026.
- Human operators checked 8,024 images to assess the West Midlands seatbelt-and-phone camera system’s accuracy, authorities reported in October 2026.
- West Midlands’ March 2026 camera trial resulted in zero follow-up enforcement actions; detections assessed potential offending rather than established violations.
- Sussex cameras recorded 620 suspected seatbelt offences during their first operational week in April 2026.
- Sussex’s first operational week in April 2026 also identified 17 suspected instances combining mobile-phone and seatbelt offences.
- West Sussex cameras detected 1,823 seatbelt offences across four weeks, from April 13 to May 10, 2026.
- West Sussex’s April–May 2026 deployment recorded 2,294 offences overall, including seatbelt, mobile-phone, and vehicle-control violations at one location.
Camera Sensor Fusion in Traffic Enforcement
| System / manufacturer | Documentation date | Feature | Numeric specifications |
| Hikvision radar–camera system | March 2026 | Imaging and radar detection | 12 MP imaging; 4112 × 3072 resolution; 100 m radar detection range |
| Hikvision radar–camera system | 2026 | Speed measurement and lane coverage | 10–320 km/h measurement range; ±2 km/h accuracy; up to 3 lanes |
| Hikvision radar–camera system | 2026 | Target detection and radar frequency | Up to 32 targets; 24.05–24.25 GHz radar frequency |
| Stellarview radar–camera system | November 2026 | Radar tracking and capture zone | 4D radar; up to 128 vehicles tracked; 60 m capture zone |
| Stellarview radar–camera system | November 2026 | Camera capture and frame interval | 60 FPS; 16.7 milliseconds between successive frames |
| Stellarview radar–camera system | November 2026 | Synchronization-error example | 10-millisecond timing error produces 0.64 m displacement at 230 km/h |
| Stellarview radar–camera system | November 2026 | Reported NATRAX-certified detection limits | Radar-based detection up to 230 km/h; vision-based detection up to 180 km/h |
5G, Fiber, and V2X Connectivity for Camera Streaming
- June 2026 research integrated camera streaming, fiber-connected roadside units, and 5G; it evaluated vehicle cameras.
- The 2026 testbed’s fiber-linked roadside units operated at 5.9 GHz, supporting C-V2X specifications in 3GPP Releases 14 and 15.
- Its 12-megapixel camera streamed video through roadside infrastructure or 5G directly to edge computing, demonstrating complementary transmission paths.
- The 2026 study cited typical 5G latency of 18–20 milliseconds; camera-to-display measurements predominantly reached 150–160 milliseconds.
- Its conclusion reported 162–178 milliseconds end-to-end latency, including approximately 2–18 milliseconds of network overhead; these results are testbed-specific.
- January 2026 European 5G corridor guidance covered 6 service categories, drawing lessons from 31 projects undertaken during 2022–2025.
Recent Smart Traffic Camera Events
- In October 2026, Jenoptik announced over 200 number-plate recognition cameras across approximately 125 Lithuanian sites, with installation scheduled within 12 months.
- In October 2026, New York City completed red-light camera deployment at 600 intersections; officials reported over 80% less red-light running at camera locations.
- In October 2026, San Francisco reported 84% less excessive speeding across 33 camera locations after 18 months, representing over 42,000 fewer daily speeding events.
- In September 2026, British Columbia announced replacement of 140 intersection cameras by spring 2027, with Jenoptik providing maintenance for up to 10 years.
- In March 2026, Dahua showcased Spotter Ultra’s 8-lane, 24/7 traffic enforcement and iPatrol’s 360° monitoring, alongside Xinghan 2.0 and VRF2.0 technology.
- In February 2026, Verra Mobility finalized NYC’s 5-year, USD 998 million traffic-camera contract, up 34%, with a further 5-year extension option.
- In December 2025, Western Australia reported over 31,855 first-month camera infringements, including 12,288 phone-use, 10,285 seatbelt, and 9,282 speeding offences.
- In July 2025, Hikvision launched AI traffic cameras, claiming 75% fewer false alarms for seatbelt and phone-use detection and 60% fewer incident false alarms.
The Bottom Line
Smart traffic cameras are expanding quickly, from speed and red-light enforcement to plate recognition, phone and seatbelt detection, and AI-based signal control. Cities report large drops in speeding and red-light running, and major contracts and deployments show strong momentum.
At the same time, privacy debates, data retention rules, and false-positive concerns are shaping how programs grow. Authorities that pair accurate technology with transparent policies, clear data limits, and human review will earn the public trust these systems need.
FAQ
A smart traffic camera is a roadside camera that uses computer vision and sensors to detect vehicles, pedestrians, and traffic conditions in real time. It can count traffic, measure speed, and help manage signals or send alerts about incidents.
The cameras capture video that is processed by onboard or networked software, often using machine learning models to identify vehicle types, lane occupancy, and movement patterns. The results are sent to traffic management centers, where engineers can adjust signal timing or respond to congestion and accidents.
Some are, such as cameras that detect speeding, red-light violations, or bus lane misuse. Many others are used only for traffic monitoring and planning, and they typically don’t identify individual drivers. Rules on enforcement vary by city and country.
Privacy concerns are common, so many systems anonymize data by blurring faces and license plates or by processing images at the device and storing only counts or speeds. Responsible deployments include clear data retention limits, access controls, and public disclosure of how footage is used.
They can reduce congestion, shorten emergency response times, improve signal coordination, and support safer roads by identifying high-risk intersections. Cities also use the data to guide infrastructure investments and long-term transportation planning.
Accuracy depends on camera placement, lighting, weather, software quality, and calibration. Modern systems often perform well in typical conditions, but agencies usually validate results against manual counts or radar before relying on them for enforcement.

Sources