
Key Highlights
- Global blockchain users are estimated at 560 to 861 million by 2025, representing about 6.8% to 10.5% of the world population.
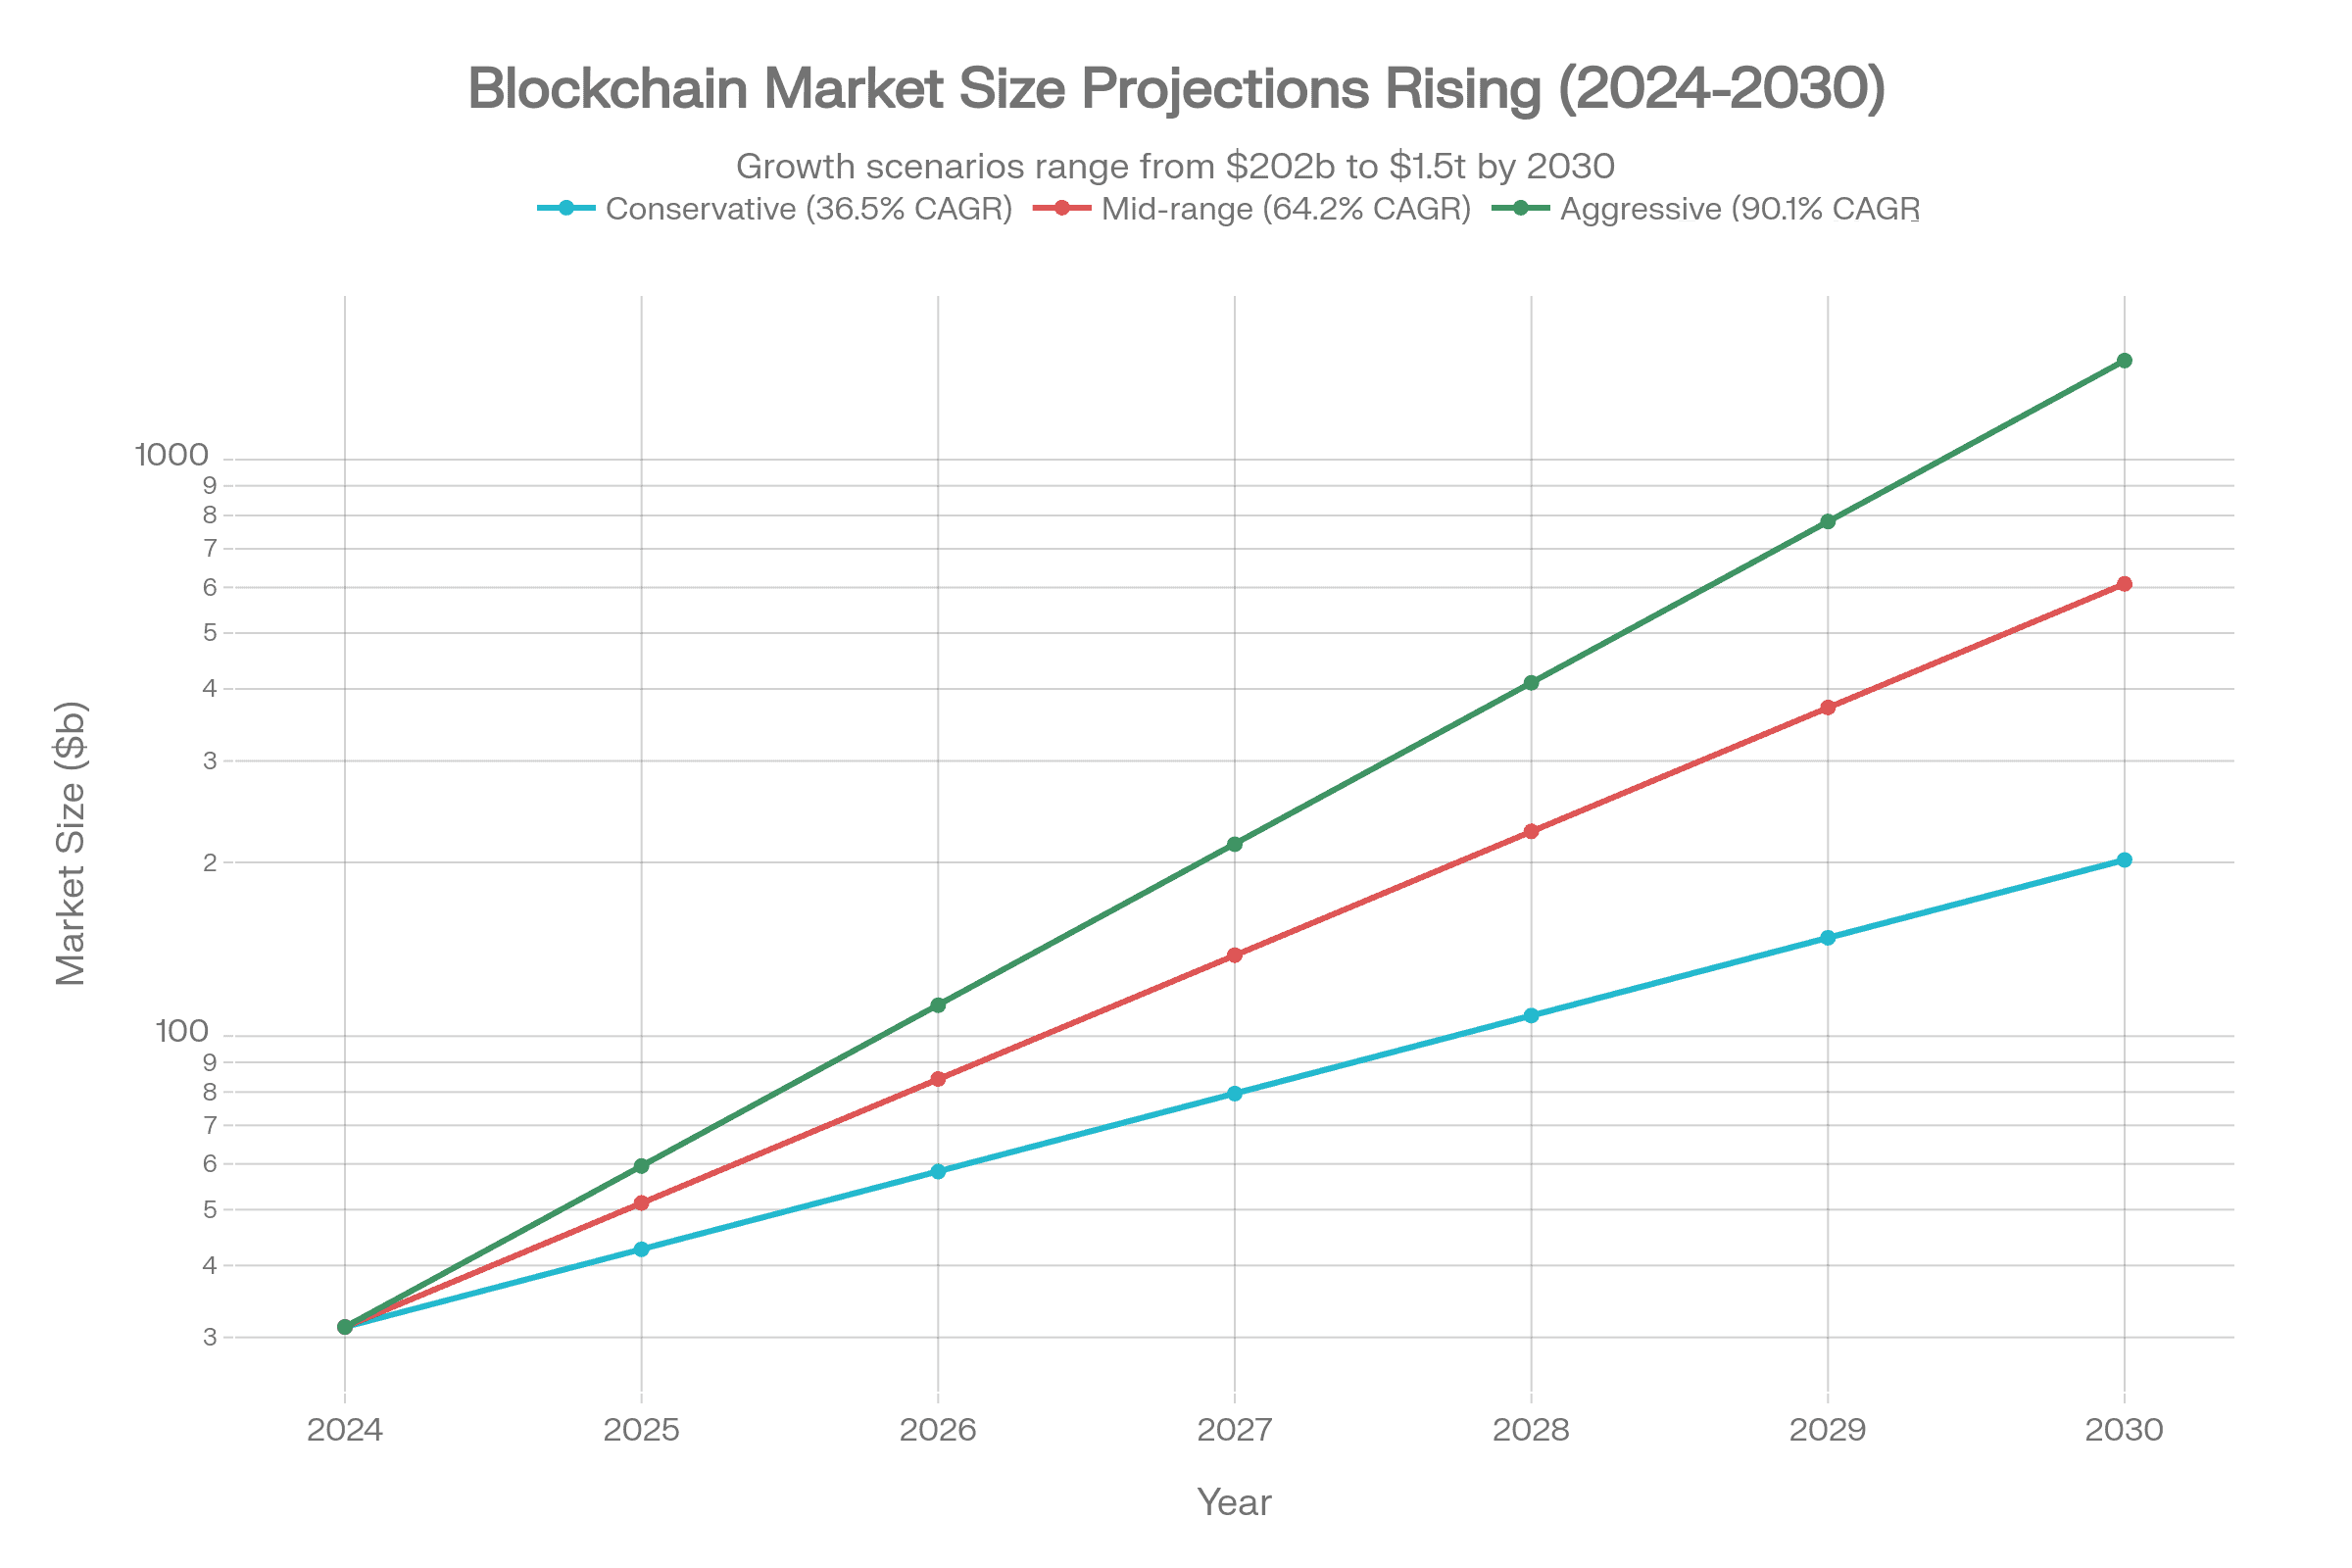
- The blockchain market size is estimated at USD 31.18 to 47.96 billion in 2025, and projections indicate expansion to roughly USD 577 to 1,431 billion by 2030.
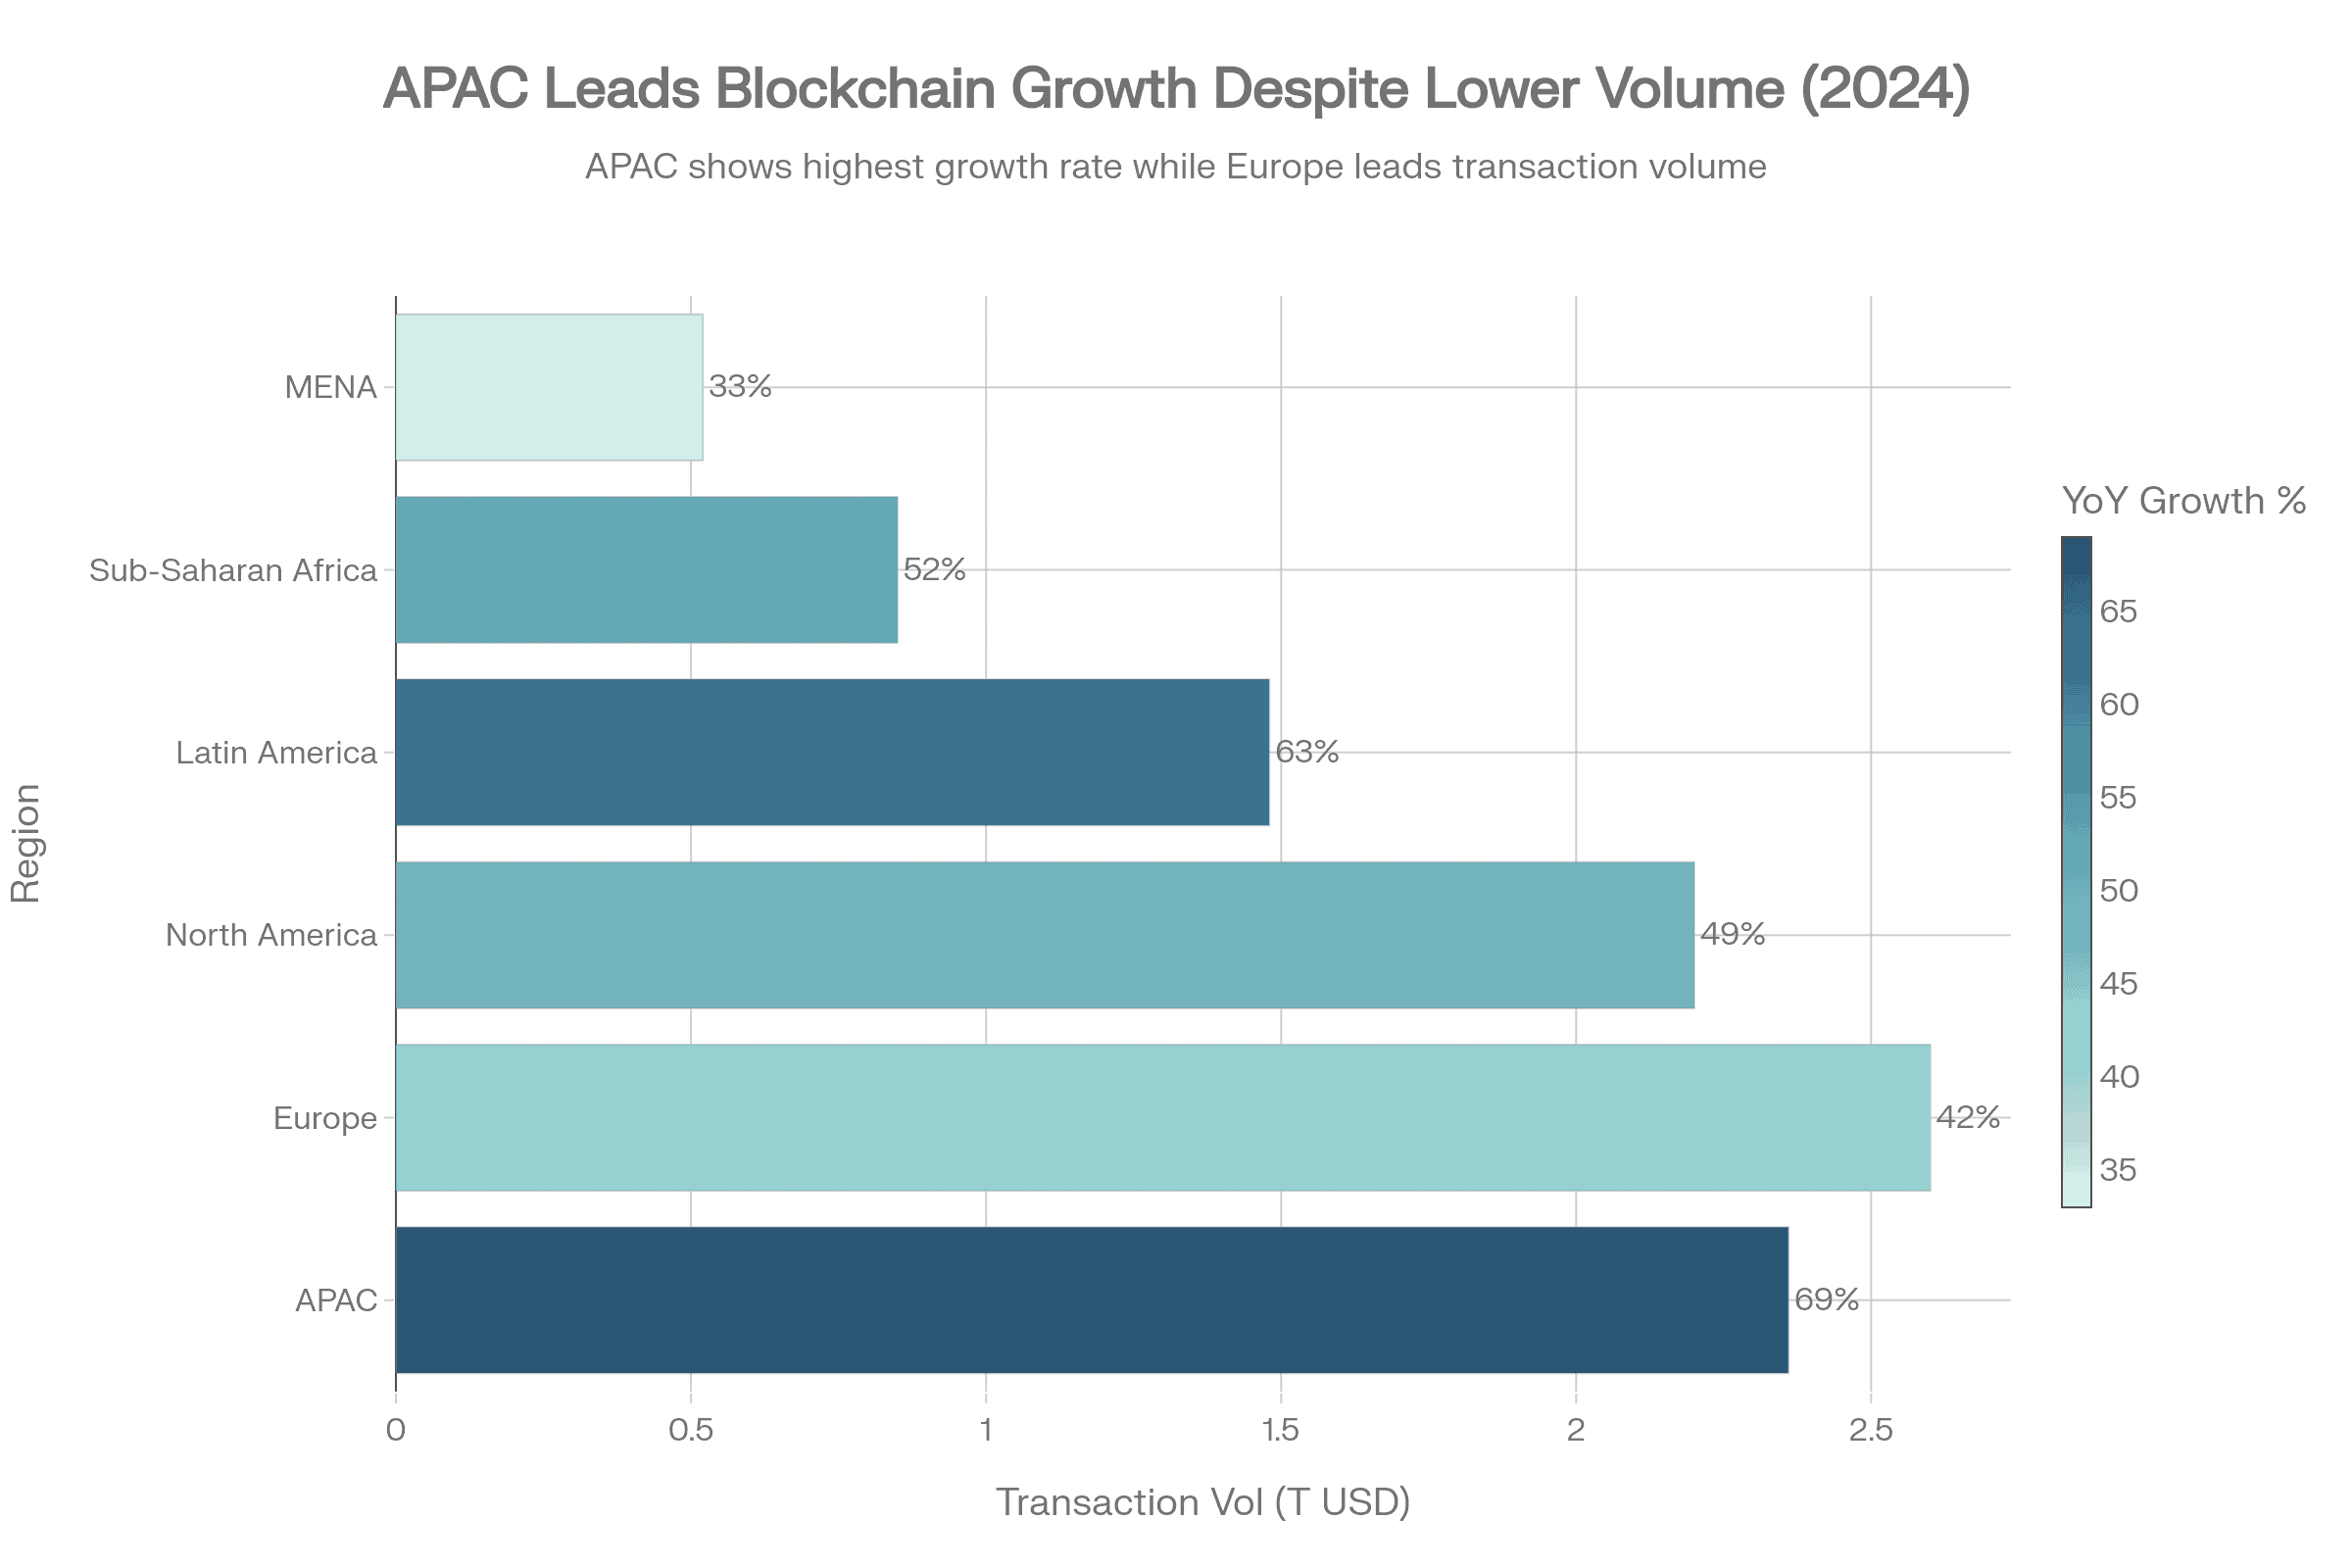
- Transaction growth in APAC is reported at 69% year over year, with transaction volume rising from USD 1.4 trillion to USD 2.36 trillion, positioning the region as the fastest growing.
- Stablecoins reached a record USD 4 trillion in transaction volume, reflecting an 83% year over year increase.
- In the United States, crypto ownership is reported at 30% of adults or around 70.4 million, up from 27% in 2024.
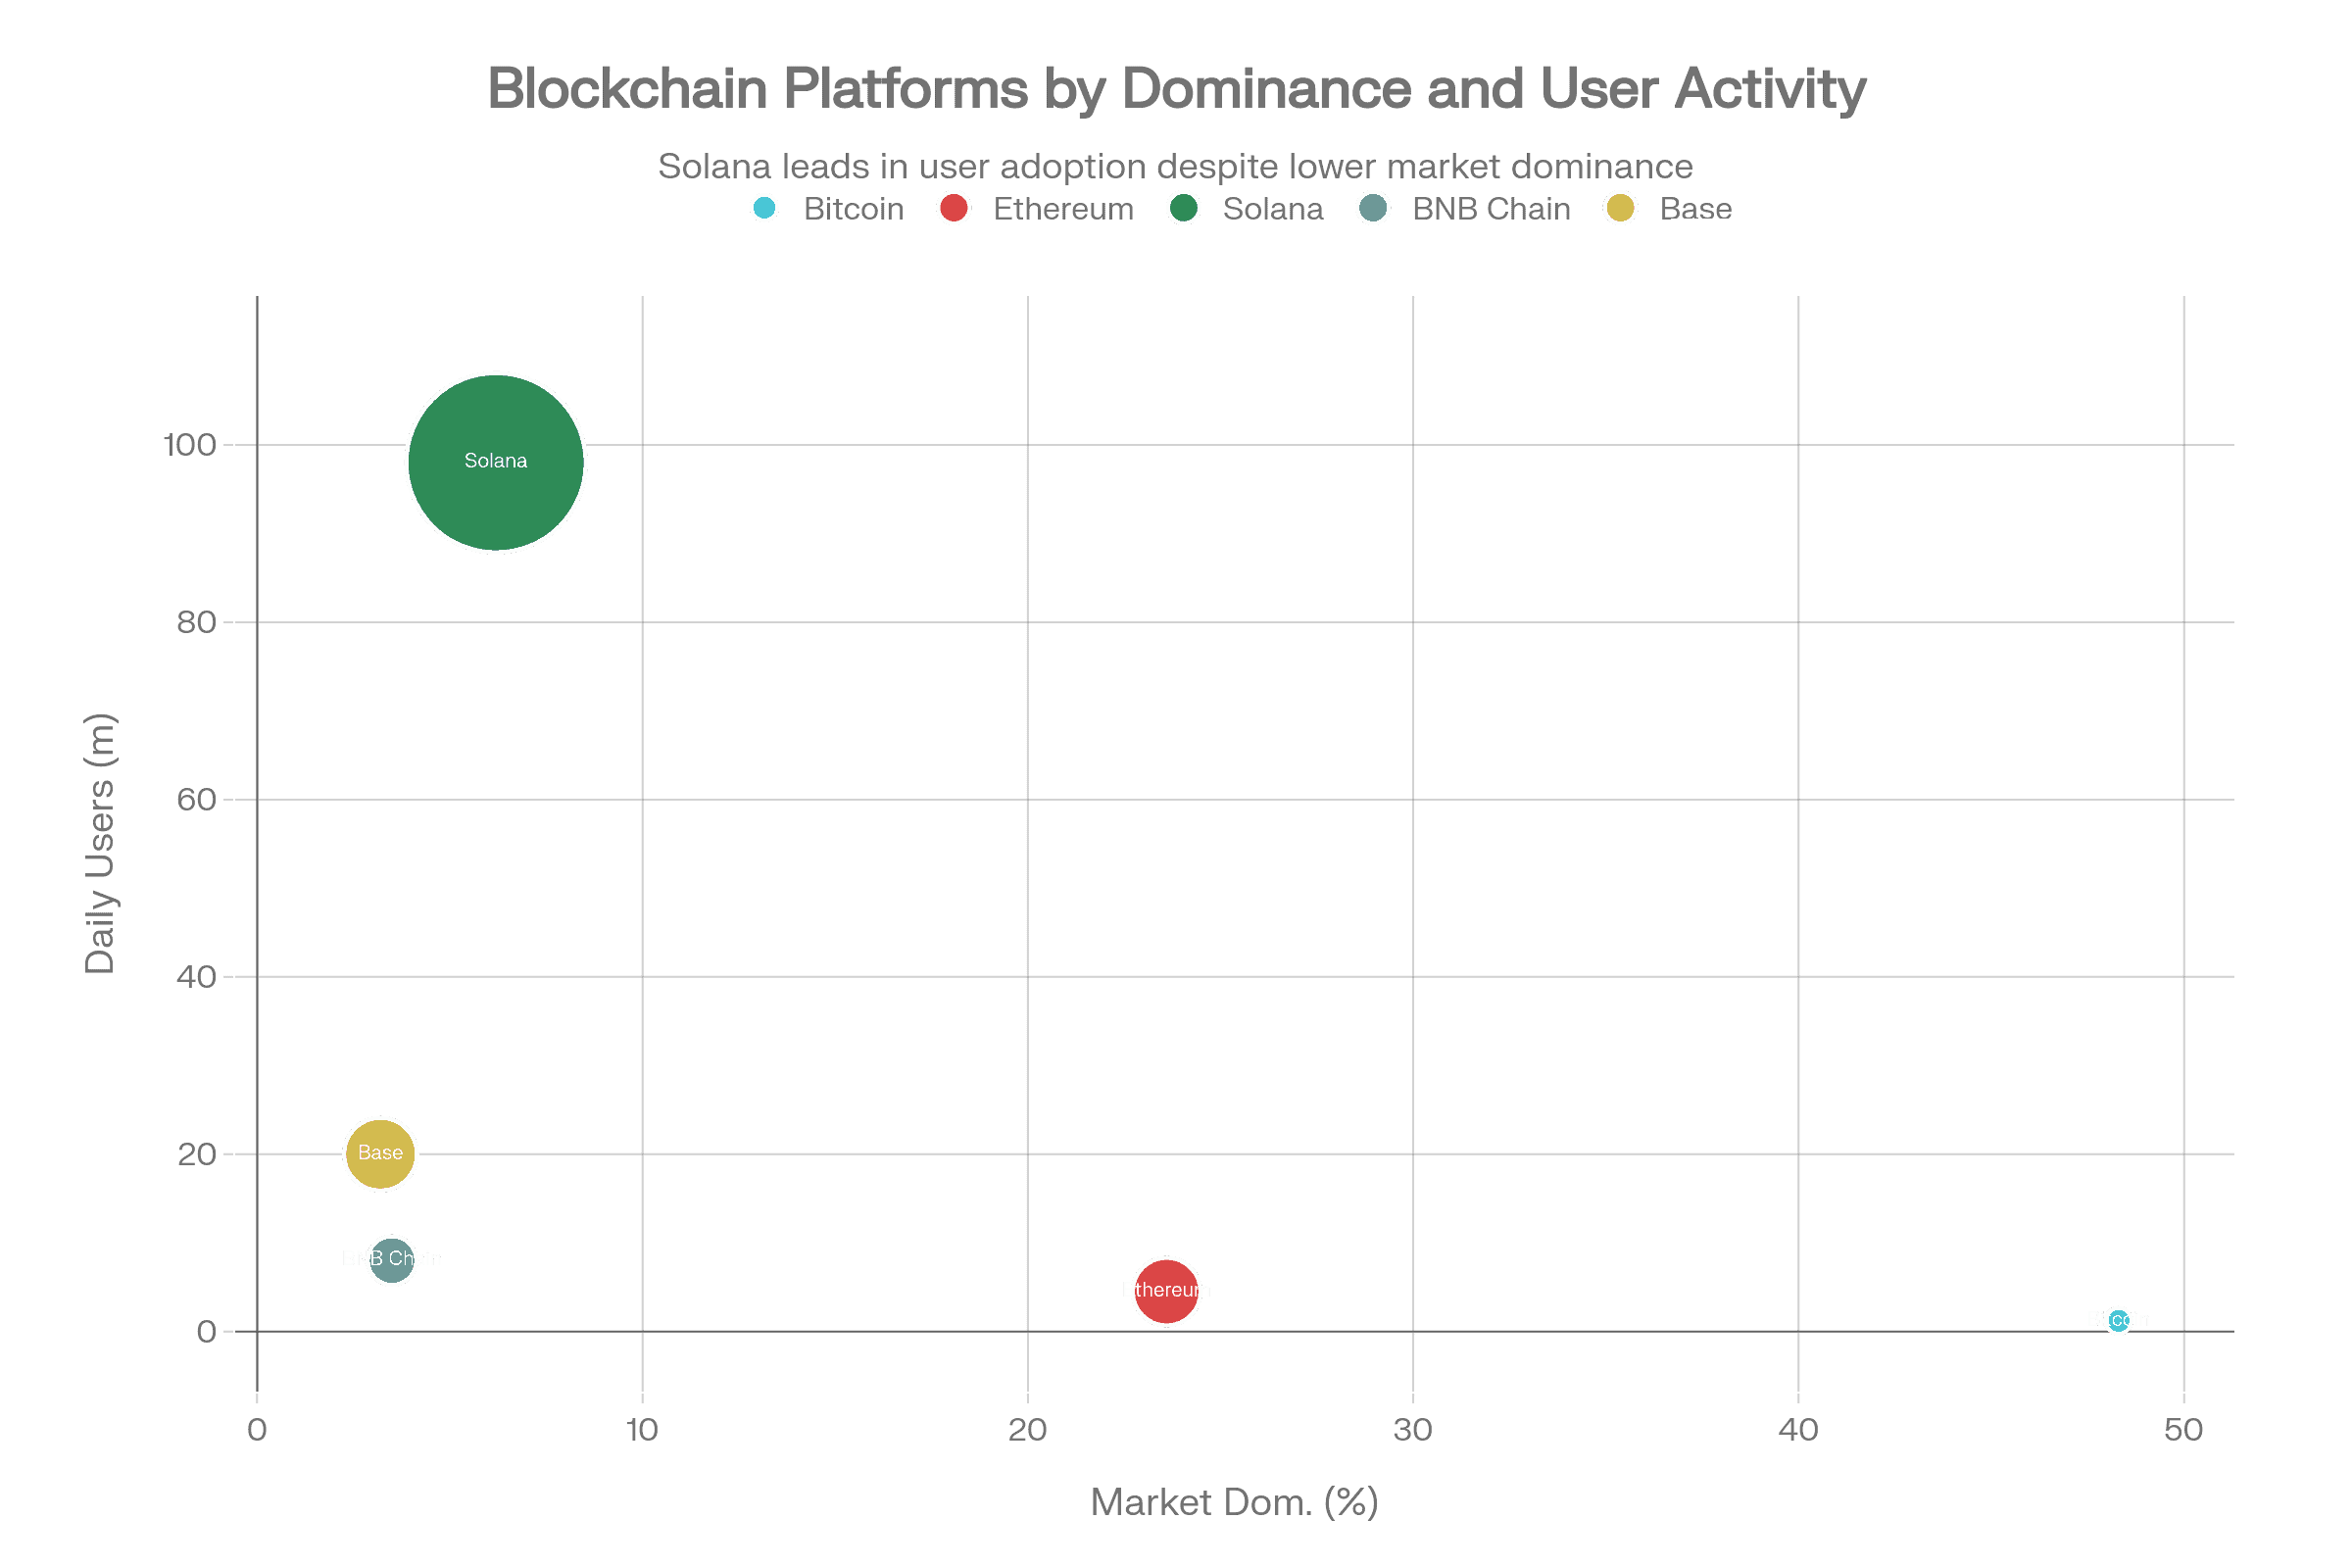
- Solana is reported to lead by user activity with 98 million monthly active users, while Bitcoin is reported to hold 48.3% market dominance.
- The healthcare blockchain market is expected to grow from USD 5.5 billion to USD 43.37 billion over 2025 to 2030, representing a projected 52.5% CAGR.
- Venture capital investment is reported to have rebounded to USD 4.9 billion in Q1 2025, across 446 deals.
Blockchain Market Size and Growth Trajectory
The global blockchain market has entered a period of unprecedented expansion. Valued at $31.28 billion in 2024, the market is projected to reach $31.18–$47.96 billion in 2025, depending on the research methodology employed. By 2030, consensus forecasts diverge significantly: conservative estimates place the market at $577.36 billion (36.5% CAGR), while aggressive projections suggest a climb to $1,431.54 billion (90.1% CAGR).
adoption and merchant acceptance expand in emerging markets.This wide variance reflects the nascent but rapidly maturing nature of blockchain adoption. Research from Precedence Research indicates that the fintech blockchain sector alone—a subset of the broader technology—is forecast to expand from $0.48 trillion in 2024 to $21.59 trillion by 2034, representing a 46.31% CAGR. Such explosive growth signals fundamental shifts in how institutions and consumers manage transactions, data, and digital identity.
The blockchain in retail sector demonstrates even steeper growth curves, with valuations rising from $2.92 billion (2024) to $5.43 billion (2025) and projections to reach $63.51 billion by 2029 at an 84.9% CAGR. Supply chain applications—a critical enterprise use case—are similarly accelerating, with the market expanding from $1.17 billion (2024) to $33.25 billion (2033) at a 39.7% CAGR.
| Market Segment | 2024–2025 Size | 2030 Projection | CAGR |
| General Blockchain | $31.18–$47.96B | $577.36B | 36.5%–64.2% |
| FinTech Blockchain | $0.48T | $21.59T (2034) | 46.31% |
| Supply Chain Blockchain | $1.17B | $33.25B (2033) | 39.70% |
| Retail Blockchain | $5.43B | $63.51B (2029) | 84.90% |
| Healthcare Blockchain | $5.5B | $43.37B (2030) | 52.50% |
Diverse growth rates across segments indicate that blockchain adoption is not uniform. Retail, fintech, and supply chain sectors are capturing the majority of early institutional investment, while consumer adoption remains concentrated in specific geographies and demographics. This segmented growth suggests that blockchain’s “killer applications” are emerging in B2B and B2C2B models rather than as a consumer-facing technology in developed markets.
User and Adoption Statistics
Total Users and Wallet Ownership
The blockchain ecosystem has achieved remarkable penetration within a relatively short timeframe. As of 2025, approximately 560–861 million people globally use blockchain or cryptocurrency services, representing 6.8%–10.5% of the world’s population. This figure is projected to accelerate, with many analysts expecting 1 billion+ users by 2027 as mobile adoption and merchant acceptance expand in emerging markets.
Active blockchain wallets number between 83–85 million globally, though this metric masks substantial variation in wallet activity and value. Bitcoin-specific wallet counts exceed 200 million, reflecting the proliferation of custodial accounts, dormant addresses, and multi-wallet user behavior. Coinbase, one of the largest centralized exchanges, reports serving over 56 million users, effectively positioning it as one of the world’s largest financial services platforms by account base—larger than Charles Schwab.
Demographic Breakdown: Age
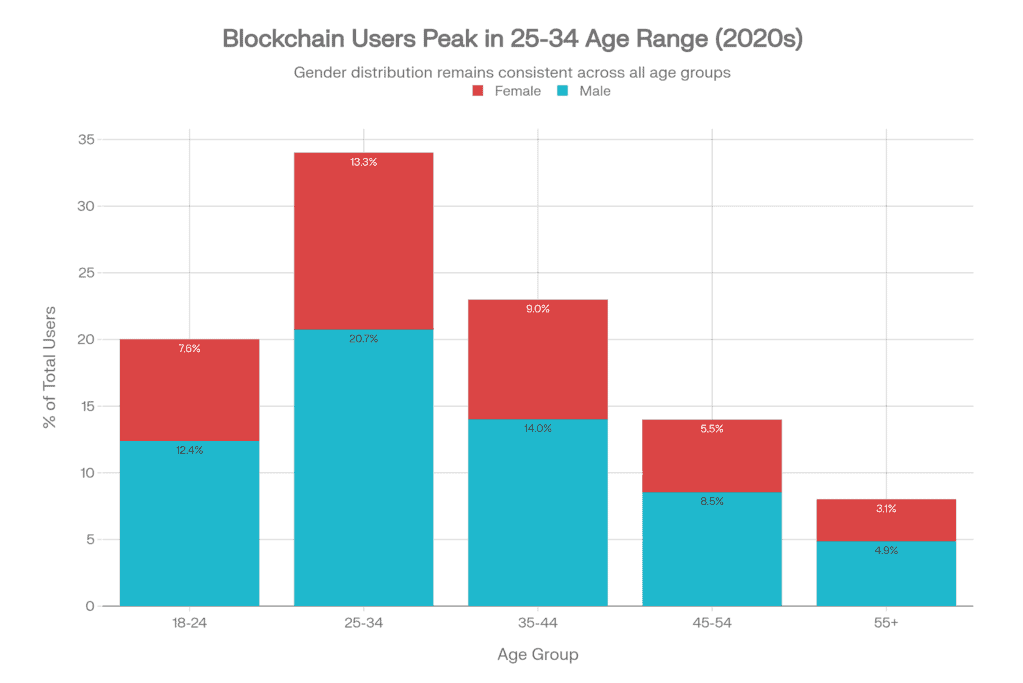
Blockchain adoption shows a pronounced age skew toward younger, digitally native cohorts. The 25–34 age group dominates globally, accounting for 31–34% of all blockchain users. This demographic advantage reflects both higher comfort with decentralized technologies and greater risk tolerance in alternative investments. The 18–24 age segment accounts for 20% of users, indicating strong early adoption among Gen Z.
Older demographics remain significantly underrepresented but growing. The 45–54 age bracket accounts for 14% of users, while individuals 55 and older account for only 8%. However, recent data reveals accelerating adoption among older cohorts: the 50–64 age group in Nordic countries saw its ownership rate more than double, marking the highest relative growth of any age segment in that region.
Gender Distribution and the Emerging Female Participation Gap
Global gender distribution remains heavily skewed toward males, with men representing 61% of all blockchain/cryptocurrency users and women comprising 39%. This gap reflects systemic barriers including lower financial technology literacy, reduced representation of female role models and thought leaders, and cultural factors affecting risk-taking behavior in alternative investments.
However, critical inflection points are emerging. Among the 18–24 age cohort, the gender gap narrows dramatically to just 2%, indicating a potential generational shift. In the United States, women now represent 44% of new wallet registrations, suggesting that targeted education and improved user experience design are successfully attracting female participants. This trend is critical for long-term ecosystem growth, as inclusive adoption patterns correlate with regulatory acceptance and mainstream adoption.
Why This Matters: The concentration of users in the 25–44 age range and the male-dominated demographic profile present both opportunities and risks. The opportunity lies in converting 45%+ of adults aged 45+, thereby addressing the female participation gap and potentially doubling the addressable market. The risk is that a disproportionately young, male user base may not align with mainstream consumer expectations, regulatory requirements, or risk profiles of institutional capital.
Regional Adoption Patterns and Growth Acceleration
Asia-Pacific: The Engine of Adoption
Asia-Pacific has emerged as the global epicenter of blockchain adoption, with transaction volume surging 69% year-over-year to reach $2.36 trillion in the 12 months ending June 2025. This represents an acceleration from the prior year’s 27% growth, signaling both expanded user participation and institutional adoption.
India leads this regional surge, claiming the #1 position in the Chainalysis Global Adoption Index. The nation’s large, young, tech-fluent population; thriving developer ecosystem; and emerging institutional investor class have created ideal conditions for crypto adoption. India’s position is reinforced by a rising middle class, growing financial literacy, and frustration with legacy banking infrastructure. Pakistan ranks #3 globally, buoyed by government initiatives including the establishment of the Pakistan Crypto Council (March 2025) and plans for a dedicated virtual assets regulatory authority. Vietnam, ranking #4, benefits from rapid e-commerce penetration and mobile-first populations.
South Asia collectively achieved 80% growth between January and July 2025, reaching approximately $300 billion in transaction volume—a staggering acceleration that reflects both retail participation and institutional capital flows.
North America and Europe: Institutional Consolidation
While APAC leads growth rates, North America and Europe continue to dominate in absolute transaction volumes, receiving $2.2 trillion and $2.6 trillion respectively in the past 12 months. These regions reflect institutional adoption patterns rather than grassroots participation.
In North America, U.S. crypto activity surged by approximately 50% between January and July 2025, cementing its status as the largest crypto market globally in absolute transaction volume. This surge was catalyzed by regulatory clarity improvements, including the approval of spot Bitcoin ETFs and clearer institutional frameworks that legitimized participation across traditional financial channels. The U.S. blockchain technology market alone is projected to reach $14.26 billion by 2026, reflecting both enterprise adoption and retail participation.
North America captured 43.80% of the global blockchain market share in 2025, maintaining its lead despite slowing relative growth rates. Europe, while growing at a more modest 42% YoY, achieved this growth from a high base, underscoring sustained institutional activity and expanding consumer participation.
Latin America and Sub-Saharan Africa: Emerging Markets Gaining Traction
Latin America experienced 63% YoY adoption growth, reflecting rising adoption across both retail and institutional segments. Brazil’s central bank is actively testing ETH-based tokenized real estate markets, signaling government-backed blockchain exploration.
Sub-Saharan Africa achieved 52% adoption growth, driven primarily by remittance use cases and everyday payment applications. With limited legacy banking infrastructure and high remittance corridors, blockchain offers direct utility for underbanked populations.
| Region | Transaction Volume (2025) | YoY Growth Rate | Key Driver |
| APAC | $2.36T | 69% | Retail participation, institutional capital |
| Europe | $2.6T | 42% | Institutional adoption, regulatory clarity |
| North America | $2.2T | 49% | ETF approvals, regulatory momentum |
| Latin America | ~$1.48T | 63% | Remittances, inflation hedging |
| Sub-Saharan Africa | ~$0.85T | 52% | Remittances, payments |
| MENA | ~$0.52T | 33% | Institutional interest, regulatory caution |
Regional divergence between growth rates (fastest in emerging markets) and transaction volumes (largest in developed markets) indicates that blockchain adoption is bifurcating. Emerging markets are driving volume growth through grassroots participation and payment use cases, while developed markets are consolidating institutional adoption and regulatory frameworks. This suggests that the next 2–3 years will determine whether emerging market adoption translates into sustained growth or remains concentrated in specific use cases.
Cryptocurrency Ownership in the United States: A Shifting Landscape
The United States presents a particularly instructive case of rapid mainstream adoption. 30% of American adults, or approximately 70.4 million people, now own cryptocurrency, up from 27% in 2024. This represents a stabilization after a correction from the 2021–2022 peak of 33%.
The demographic profile of U.S. crypto owners reveals important patterns:
- Millennials and Gen X dominate: One-third of owners are between 30–44 years old, representing peak earning years with disposable income for alternative investments.
- Gender skew: Men comprise roughly two-thirds of owners, though the gap is narrowing among younger cohorts.
- Age distribution: Only 17% of owners are age 60 and over, reflecting the technology’s generational appeal.
- Investment conviction: 53% of ever-owners report net gains on their investments, while only 21% experienced net losses—a powerful reinforcement signal for continued participation.
Among current owners, 61% plan to increase their crypto holdings in 2026, signaling strong conviction and continued capital deployment. In contrast, only 6% of non-owners plan to enter the market in 2026, indicating a stark divide between believers and skeptics.
Asset Preferences and Investment Priorities
Among those planning cryptocurrency acquisition in 2026, preferences remain concentrated:
- Bitcoin (BTC): 59% plan to buy or increase holdings
- Ethereum (ETH): 49% express acquisition intent
- Solana (SOL): 18% represent emerging interest
- Dogecoin (DOGE): 17% reflect continued retail appeal
This concentration on Bitcoin and Ethereum—which together account for ~70% of market capitalization—suggests that institutional and retail capital alike view these assets as foundational to blockchain infrastructure rather than speculative alternatives.
Stablecoin Adoption
Stablecoins have emerged as a critical adoption driver, fundamentally altering how blockchain is used in commerce and institutional settings. In 2025, stablecoins achieved unprecedented transaction volumes of $4+ trillion (January–July 2025), representing an 83% increase compared to the same period in 2024.
Stablecoins now represent 30% of all on-chain crypto transaction volume, a dramatic shift from prior years where they were marginal to total activity. This suggests a fundamental change: users and institutions are increasingly utilizing blockchain infrastructure not for speculative asset exposure but for transaction settlement, cross-border payments, and treasury management—functions historically reserved for SWIFT, ACH, and wire transfers.
By end of 2026, industry analysts project stablecoin circulation will reach $1 trillion, a 3.3x increase from current levels. This projection, while aggressive, reflects the clear utility thesis: stablecoins solve real problems in cross-border commerce and reduce settlement times from days to minutes.
Why This Matters: Stablecoin adoption is the leading indicator that blockchain is transitioning from a speculative asset class to critical financial infrastructure. The shift of $4 trillion in annual volume to stablecoins—a volume comparable to the total daily transaction value in the traditional foreign exchange market—suggests that blockchain’s utility in commerce and settlements is now proven. This foundation de-risks further institutional adoption in supply chain finance, trade finance, and remittances.
Enterprise and Sectoral Adoption
Financial Services: The Vanguard of Adoption
The financial services industry remains the dominant sector for blockchain deployment. More than 60% of banks are testing distributed ledger technology to accelerate settlements, reduce fraud, and automate compliance. This widespread pilot activity indicates that blockchain infrastructure is transitioning from theoretical exploration to practical implementation.
The fintech blockchain market is projected to grow from $0.48 trillion (2024) to $21.59 trillion (2034) at a 46.31% CAGR, making it the single largest vertical for blockchain capital allocation. This growth reflects the convergence of traditional finance with crypto infrastructure, the rise of decentralized finance (DeFi) protocols, and the legitimization of digital assets through regulatory frameworks.
Healthcare: Rapid Adoption with Immense Opportunity
Healthcare represents one of the most promising blockchain verticals. 39% of healthcare organizations already have blockchain solutions in production or pilot use, primarily for clinical data exchange and fraud prevention. The healthcare blockchain market is forecast to grow from $5.5 billion (2025) to $43.37 billion (2030), representing a 52.5% CAGR.
The business case is compelling: blockchain implementation could save the healthcare industry $100–150 billion annually by 2025 by reducing costs associated with data breaches, IT operations, duplicative procedures, and fraud. For individual healthcare providers, the ROI justification centres on reducing administrative overhead, improving interoperability, and enhancing compliance with HIPAA and other data protection regulations.
Supply Chain and Logistics: From Pilot to Production
Supply chain adoption represents a critical inflection point. 46% of North American supply chain firms have already integrated blockchain solutions or plan to adopt them. The sector demonstrates consistent adoption momentum: blockchain adoption in supply chain and logistics increased 32% in 2023 and has continued accelerating into 2025.
The business justification is straightforward: blockchain enables end-to-end traceability, reduces counterfeiting, ensures ethical sourcing, and automates payment workflows through smart contracts. Blockchain-based supply chain finance is set to generate $24.7 billion in transaction volume in 2025, with projections to double by 2028.
In practice, 17 major logistics firms are collaborating on interoperable blockchain standards to enable seamless data exchange across global networks. This collaborative approach, previously common in ports and shipping consortiums, suggests that supply chain blockchain is moving beyond competitive advantage toward infrastructure standardization.
| Sector | Current Market Size | Projected 2030 Size | CAGR | Adoption Driver |
| FinTech Blockchain | $0.48T | $21.59T (2034) | 46.31% | Payments, settlements, DeFi |
| Healthcare | $5.5B | $43.37B (2030) | 52.50% | Data integrity, fraud prevention |
| Supply Chain | $1.17B | $33.25B (2033) | 39.70% | Traceability, automation |
| Retail | $5.43B | $63.51B (2029) | 84.90% | Loyalty, payments, inventory |
Enterprise adoption is concentrated in sectors with clear cost-reduction or efficiency benefits. Healthcare’s 39% adoption rate and supply chain’s 46% integration rate indicate that blockchain is transitioning from theoretical proof-of-concept to operational necessity. The lack of similar penetration in less-pain-sensitive sectors (e.g., general enterprise IT) suggests that ROI justification remains the primary barrier to further adoption.
Blockchain Platform Competitive Landscape
Bitcoin: Dominance by Market Capitalization
Bitcoin maintains overwhelming dominance by market capitalization, representing 48.3% of total crypto market value, with a market cap of $1.34 trillion as of 2025. This dominance reflects Bitcoin’s first-mover advantage, network effects, and institutional adoption following the approval of spot Bitcoin ETFs in 2024.
However, Bitcoin’s dominance by transaction metrics tells a different story. Bitcoin processes only 1.2 million daily active addresses (2025), compared to Ethereum’s 4.5 million. This divergence indicates that Bitcoin functions primarily as a store of value and settlement layer rather than as a platform for diverse applications.
Bitcoin’s daily transaction volume and fee-generating activity are substantially lower than competing platforms, reflecting its design philosophy as “digital gold” rather than a settlement or application platform. Nevertheless, over 19% of Bitcoin holders are long-term HODLers with coins unmoved for 5+ years, indicating strong conviction and reduced selling pressure.
Ethereum: Institutional-Grade Infrastructure
Ethereum captures the second-largest market capitalization at $658 billion (23.6% market share), up sharply from the prior year’s $490 billion. Daily active addresses reached 4.5 million in May 2025, reflecting robust ecosystem activity across DeFi, NFTs, and enterprise applications.
Ethereum’s competitive advantage rests on its programmability: the network enables smart contracts, decentralized applications (dApps), and diverse use cases that Bitcoin cannot support. Ethereum’s daily transaction volume surpassed $17.2 billion in Q1 2025, the fourth consecutive quarter outpacing Bitcoin.
The Ethereum ecosystem captured particular momentum through Layer 2 scaling solutions:
- Layer 2 wallet adoption jumped to 28 million users in 2025, primarily on Arbitrum and Base
- Ethereum Layer 2s collectively handled 37% of wallet activity in 2025, demonstrating successful scaling
- Base ecosystem captured 16.8% of global investor interest in 2024–2025, emerging as the second most-popular blockchain ecosystem and overtaking Ethereum Layer 1
Ethereum’s enterprise adoption is particularly pronounced in finance and healthcare, where its smart contract capabilities enable automated compliance workflows and data verification.
Solana: Usage Metrics Redefine Platform Leadership
Solana has emerged as the most-used blockchain by volume metrics, despite ranking third by market capitalization. Key 2025 metrics include:
- 98 million monthly active users (MAU)—approximately 5× Base’s MAU and vastly exceeding Bitcoin and Ethereum
- 34 billion transactions processed in 2025—roughly 18× BNB Chain’s transaction count
- $1.6 trillion trading volume—1.7× Ethereum’s volume
- $5 billion in application fees—2× Ethereum’s fees, indicating monetization success across the ecosystem
- $1.5 billion in protocol revenue—2.4× TRON’s revenue
This dramatic divergence between market capitalization ranking (lower) and usage metrics (leading) reflects a fundamental shift in how blockchain platforms are evaluated. Solana’s success is driven by speed (65,000 transactions per second), cost (minimal fees), and ecosystem momentum around meme coins and mobile-first applications.
The ecosystem has benefited particularly from Pump.fun, a meme coin generator that captured significant retail trading volume and brought younger demographics into the Solana ecosystem. Whether this usage translates to sustainable adoption or reflects temporary speculation remains an open question.
Emerging Platforms: Base, TON, and Sui
Three platforms have gained substantial mindshare and adoption:
- Base (Coinbase’s Layer 2): 16.8% of global investor interest, overtaking Ethereum Layer 1
- TON (Telegram ecosystem): 6.2% share, reflecting enterprise adoption through Telegram’s user base of 900+ million
- Sui (Move-based VM): 4.8% share, growing through developer tools and gaming applications
These platforms represent successful execution of platform-specific strategies: Base leverages Coinbase’s institutional credibility and user base; TON benefits from Telegram’s massive consumer reach; Sui differentiates through novel programming models.
| Platform | Market Cap (2025) | Market Share | Daily Active Users | Key Strength |
| Bitcoin | $1.34T | 48.30% | 1.2M | Store of value, settlement |
| Ethereum | $658B | 23.60% | 4.5M | Smart contracts, enterprise |
| Solana | ~$130B | 4.70% | 98M | Speed, low cost, user volume |
| BNB Chain | ~$85B | 3.10% | ~15M | DEX volume, gaming |
| Base | ~$20B | 0.70% | ~20M | Institutional access, layer 2 |
Why This Matters: The competitive landscape is undergoing fundamental restructuring. Market capitalization dominance (Bitcoin, Ethereum) no longer predicts user adoption (Solana leads by orders of magnitude). This divergence suggests that the market is revaluing platforms based on utility, transaction velocity, and ecosystem vitality rather than historical precedent. The success of Solana, Base, and TON indicates that users prioritize speed and cost over network effects and centralization risk.
Venture Capital Investment
Blockchain venture funding rebounded strongly in 2025 after a challenging 2024. Q1 2025 saw $4.9 billion invested across 446 deals, a 40% quarter-over-quarter increase. However, this figure was heavily influenced by a single transaction: MGX invested $2 billion into Binance, accounting for over 40% of Q1 capital and establishing a new record for single-deal crypto VC investment.
Q2 2025 saw normalization, with $1.97 billion invested across 378 deals (-59% QoQ, but only -20% QoQ excluding the Binance deal). This moderation reflects both seasonal venture patterns and increased scrutiny of blockchain business models.
Investment Stage Distribution
A significant shift has emerged in later-stage investment dominance:
- Q1 2025: Later-stage deals captured 65% of capital, the first time since Q3 2020 that later-stage exceeded early-stage
- Q2 2025: Later-stage remained dominant at 52% of capital
This shift reflects the maturation of the blockchain venture ecosystem: younger companies with unproven models struggle to raise capital, while established platforms with market traction and revenue streams attract institutional investment. The implication is that the “golden era” of pre-seed and seed-stage crypto investing may be concluding, replaced by a more disciplined, return-focused approach.
Investment by Category
In Q2 2025, capital allocation reflected pragmatic allocation:
- Mining: $300+ million (cloud-mining firm XY Miners)
- Privacy/Security: $200+ million
- Infrastructure: Significant allocation to foundational technologies
- Early-stage AI + Blockchain: Emerging category reflecting convergence trends
Why This Matters: Venture capital deployment patterns are a leading indicator of institutional confidence and expected ROI profiles. The shift toward later-stage deals, established platforms, and real-world use cases (mining, infrastructure, security) indicates that VCs are de-risking by backing proven business models. Early-stage founders should expect significantly higher bar for capital raises and increased emphasis on revenue traction.
Adoption Barriers
Despite remarkable growth, significant barriers persist:
Technical Barriers
- Scalability vs. Decentralization Tradeoff: Blockchain consensus mechanisms necessarily trade performance for security. Traditional databases process thousands to millions of transactions per second; most blockchains process 15–65 transactions per second (even with Layer 2 solutions)
- Integration Complexity: Implementing blockchain requires reengineering existing systems, creating high switching costs and implementation risk
- Immutability vs. Data Privacy: Blockchain’s immutability conflicts with GDPR “right to be forgotten” provisions, creating regulatory friction
Regulatory and Compliance Barriers
- Lack of Regulatory Clarity: Particularly in supply chain and retail applications, uncertainty around tax treatment, custody rules, and cross-border settlement inhibits enterprise adoption
- High Compliance Costs: Banks and financial institutions face substantial compliance burdens, raising adoption costs relative to legacy systems
Economic Barriers
- Implementation Costs: Blockchain infrastructure, training, and consulting costs remain high, particularly for mid-market enterprises
- Vendor Lock-in Risk: Many blockchain solutions are proprietary, creating concerns about long-term commitment and exit options
User Experience and Adoption Barriers
- Unstable Value: Cryptocurrency price volatility remains the top reason non-owners cite for avoiding participation
- Lack of Government/Bank Protection: Custody risk and missing insurance mechanisms deter conservative participants
- Cyber-Attack Risks: High-profile security incidents create persistent trust deficits
| Barrier | Severity | Affected Users | Timeline to Resolution |
| Scalability | High | Enterprise, retail | 2–3 years (Layer 2 maturation) |
| Regulatory clarity | High | Enterprise, institutional | 3–5 years (policy development) |
| Implementation costs | Medium | SMEs, startups | Ongoing (competition reducing costs) |
| User experience | Medium | Retail, non-technical | 1–2 years (abstraction layers) |
| Security perception | High | Institutional, risk-averse | Depends on incident frequency |
Barriers are transitioning from technical to economic and regulatory. The technical challenges (scalability, interoperability) are increasingly solvable through Layer 2 solutions and cross-chain bridges. The harder barriers—regulatory clarity, mainstream user experience, and risk perception—require systemic change and time.
User Perception and Future Expectations
Positive Indicators
User sentiment among current blockchain participants remains constructive:
- 53% of ever-owners report net gains on their crypto investments, creating a powerful reinforcement loop.
- 61% of current crypto owners plan to increase holdings in 2026, indicating conviction and capital deployment.
- Bitcoin has been accepted at over 39,000 merchants in Japan (2025), reflecting growing merchant adoption.
- Gen Z participation is accelerating, with young people (18–24) showing narrowed gender gaps and high technology comfort.
Negative Indicators
Barriers to broader adoption remain substantial:
- Only 6% of non-owners plan to enter the market in 2026—a stark contrast to the 61% of existing owners planning to increase participation.
- $2.17+ billion stolen from cryptocurrency services in H1 2025—exceeding the entire 2024 total and creating persistent trust deficits.
- The Bybit hack ($1.5 billion) demonstrated that even major exchanges face sophisticated threats, undercutting security narratives.
- Gender gap persists, with women citing lower confidence, fewer role models, and lower trust in fintech as reasons for non-participation.
- “Wrench attacks” and physical violence correlated with Bitcoin price movements, indicating that high-profile holders are targeted by criminals.
Qualitative Sentiment Themes
Among non-owners, the primary sentiment barriers are psychological rather than technical:
- Fear of Loss: Volatility and perceived instability dominate concerns.
- Lack of Trust: Missing institutional safeguards (FDIC insurance equivalent) create perceived asymmetry.
- Lack of Understanding: Complexity of blockchain concepts remains a cognitive barrier.
- Gender and Age Bias: Underrepresented cohorts cite role-model scarcity and exclusion.
Conclusion
Blockchain adoption has transitioned from niche experimentation to mainstream infrastructure. The 31.18 billion market in 2025 is projected to reach $577–$1,431 billion by 2030, driven by user growth (860 million → 2+ billion users), sectoral adoption (healthcare, supply chain, fintech), regional acceleration (APAC +69% YoY), and venture capital maturation.
The competitive landscape has fundamentally restructured: Solana leads in daily active users and transaction volume despite Bitcoin’s market dominance, reflecting a shift from valuation-based to usage-based metrics. Ethereum remains the enterprise-grade platform, while emerging chains (Base, TON, Sui) are capturing specific market segments through differentiated strategies.
