






Overview
Cancer Statistics: Cancer is one of the world’s biggest health challenges, affecting millions of people every year. It happens when abnormal cells grow out of control and spread to other parts of the body. Although cancer can develop in almost any organ, many cases can be prevented through healthy habits, regular screenings, and early diagnosis. Thanks to medical advances, treatments have become more effective, helping people live longer and healthier lives. Understanding the causes, warning signs, and treatment options is important for reducing the impact of this disease.
This article covers the latest cancer statistics, common types, risk factors, symptoms, prevention tips, diagnosis, treatment methods, and recent breakthroughs in cancer research.
Best Pick
- 2,114,850 new cancer cases and 626,140 cancer deaths are projected in the United States in 2026, equal to about 5,800 new diagnoses and 1,720 deaths every day.
- The U.S. 5-year relative survival rate for all cancers has reached a record 70% during 2015-2021, up from 49% in the mid-1970s.
- Since 1991, the U.S. cancer death rate has declined by 34%, preventing an estimated 4.8 million cancer deaths.
- Around 60% of all new cancer cases occur in adults aged 65 years and older, making age the strongest cancer risk factor.
- Lung cancer remains the world’s most common cancer, with 2.6 million new cases (13%) and 1.9 million deaths (19%) in 2024.
- Nearly 40% of global cancer cases are preventable. About 7.1 million new cases (37.8%) are linked to modifiable risk factors such as tobacco, alcohol, obesity, infections, and air pollution.
- Smoking remains the leading preventable cause of cancer, accounting for 15.1% of all new cancer cases worldwide and about 182,830 U.S. cancer deaths in 2026.
- Immunotherapy, CAR-T therapy, and targeted medicines continue to improve survival, increasing 5-year survival for distant-stage cancers from 17% to 35% and regional-stage cancers from 54% to 69%.
Types of Cancer Statistics
- Lung cancer is the most commonly diagnosed cancer as of today, with approximately 2.3 million new cases expected globally in 2024.
- Annually, the highest mortality rate accounts for 1.8 million deaths.
- On the other hand, in 2024, the 5-year survival rate for lung cancer is less than 20% due to late-stage diagnosis.
- Smoking remains the leading cause, though in recent years, cancer cases among non-smokers are increasing.
Furthermore, the table below analyzes other types of cancer cases, including incidence and mortality rates.
| Cancer Types | Incidence (Expected new cases) | Mortality Rate | Key Factors |
| Breast Cancer | 2.5 million | Despite high incidence rates, advancements in early detection and treatment have improved the 5-year survival rate to 90% in developed countries. | Genetic predisposition, hormone replacement therapy, and lifestyle. |
| Colorectal Cancer | 1.9 million | It will cause around 935,000 deaths by 2024. | Diets high in red and processed meats, low physical activity, and obesity. |
| Prostate Cancer | 1.4 million | The 5-year survival rate for prostate cancer is high at 98% | Age, family history, and ethnicity (higher rates in African American men) |
| Stomach Cancer | around 1 million | It is responsible for approximately 770,000 deaths annually, with a 5-year survival rate of about 32% due to late diagnosis. | Helicobacter pylori infection, diets high in salty and smoked foods, and smoking. |
| Liver Cancer | 900,000 | Eight hundred thirty thousand deaths with a 5-year survival rate of only 18%. | Hepatitis B and C infections, heavy alcohol consumption, and obesity contribute to liver cancer risk. |
| Cervical Cancer | 600,000 women | 300,000 deaths each year | Human papillomavirus (HPV) infection is the basic reason, and vaccination programs are key to prevention. |
| Pancreatic Cancer | 496,000 | This cancer has one of the lowest 5-year survival rates at around 10%, causing approximately 466,000 deaths in 2024. | Smoking, chronic pancreatitis, and family history. |
| Ovarian Cancer | 313,000 | 207,000 deaths, and 45% of 5-year survival rate. | Age, genetics (BRCA mutations), and reproductive history play crucial roles in risk. |
| Esophageal Cancer | 570,000 | 510,000 deaths and a 5-year survival rate of only 20%. | Tobacco use, alcohol consumption, and gastroesophageal reflux disease (GERD). |
Estimated Cancer Cases and Deaths
- The National Library of Medicine report estimates that in 2026 prostate (27.3%) and breast cancer (26.3%) lead in new cases.
- Meanwhile, lung cancer contributes the highest deaths (39.1%), indicating a significant mortality burden despite lower incidence.
| Cancer Type | Estimated New Cases | Estimated Deaths |
| Prostate | 333,830 | 36,320 |
| Female Breast | 321,910 | 42,140 |
| Lung & Bronchus | 229,410 | 124,990 |
| Colorectal | 158,850 | 55,230 |
| Melanoma | 112,000 | 8,510 |
| Pancreatic | 67,530 | 52,740 |
United States Estimated Number of New Cases for Selected Cancers by State, 2026
| State | All sites | Female breast | Colon & rectum | Leukemia | Lung & bronchus | Melanoma of the skin | Non-Hodgkin lymphoma | Prostate | Urinary bladder | Uterine cervix | Uterine corpus |
| Alabama | 30,710 | 4,900 | 2,690 | 870 | 9,460 | 1,450 | 1,460 | 3,700 | 1,540 | 170 | 910 |
| Alaska | 4,040 | 580 | 330 | 110 | 440 | 380 | 140 | 640 | 220 | 50 | 190 |
| Arizona | 26,440 | 4,580 | 2,430 | 820 | 7,810 | 1,940 | 1,690 | 3,530 | 1,250 | 210 | 1,230 |
| Arkansas | 15,200 | 2,770 | 1,360 | 450 | 4,570 | 840 | 840 | 1,860 | 760 | 110 | 530 |
| California | 206,500 | 34,770 | 16,650 | 6,380 | 26,670 | 12,710 | 8,310 | 30,890 | 7,650 | 1,450 | 10,840 |
| Colorado | 30,160 | 5,210 | 2,610 | 1,080 | 5,720 | 2,190 | 1,790 | 4,390 | 1,380 | 250 | 1,390 |
| Connecticut | 22,400 | 3,490 | 2,230 | 910 | 5,810 | 1,890 | 1,380 | 3,330 | 1,000 | 130 | 1,130 |
| Delaware | 4,810 | 740 | 520 | 200 | 1,380 | 370 | 360 | 690 | 280 | 50 | 260 |
| Dist. of Columbia | 3,190 | 520 | 290 | 140 | 670 | 190 | 200 | 410 | 130 | 40 | 260 |
| Florida | 133,100 | 24,700 | 12,580 | 5,260 | 18,570 | 10,370 | 7,100 | 23,090 | 7,600 | 1,200 | 4,390 |
| Georgia | 40,180 | 7,340 | 3,390 | 1,530 | 11,780 | 1,950 | 1,990 | 4,690 | 2,030 | 360 | 1,150 |
| Hawaii | 6,420 | 1,040 | 890 | 240 | 1,090 | 540 | 390 | 1,010 | 310 | 80 | 410 |
| Idaho | 8,420 | 1,400 | 840 | 330 | 2,060 | 860 | 580 | 1,230 | 510 | 90 | 430 |
| Illinois | 72,840 | 11,420 | 7,340 | 3,040 | 12,940 | 4,990 | 4,380 | 8,670 | 2,880 | 470 | 3,400 |
| Indiana | 27,440 | 4,630 | 2,670 | 1,060 | 9,090 | 2,070 | 1,700 | 3,320 | 1,190 | 240 | 1,130 |
| Iowa | 15,880 | 2,260 | 1,820 | 720 | 3,730 | 1,020 | 1,340 | 2,250 | 760 | 130 | 820 |
| Kansas | 14,470 | 2,220 | 1,630 | 580 | 3,480 | 980 | 840 | 2,150 | 660 | 120 | 690 |
| Kentucky | 21,840 | 3,460 | 2,560 | 870 | 6,960 | 1,160 | 1,310 | 2,900 | 1,140 | 150 | 670 |
| Louisiana | 19,940 | 4,220 | 1,590 | 830 | 6,430 | 950 | 900 | 2,500 | 1,120 | 210 | 720 |
| Maine | 8,980 | 1,260 | 1,090 | 400 | 2,900 | 970 | 760 | 1,250 | 620 | 80 | 430 |
| Maryland | 29,160 | 5,260 | 2,740 | 1,180 | 7,160 | 2,130 | 1,760 | 3,640 | 1,270 | 230 | 1,110 |
| Massachusetts | 35,680 | 5,670 | 3,360 | 1,470 | 7,620 | 2,780 | 2,240 | 4,380 | 1,430 | 200 | 1,630 |
| Michigan | 35,120 | 5,900 | 3,630 | 1,410 | 8,740 | 2,510 | 2,160 | 4,340 | 1,680 | 280 | 1,470 |
| Minnesota | 28,830 | 4,770 | 2,780 | 1,150 | 5,550 | 2,830 | 2,040 | 4,100 | 1,190 | 270 | 1,280 |
| Mississippi | 14,380 | 2,480 | 1,320 | 510 | 4,170 | 680 | 720 | 1,780 | 750 | 130 | 500 |
| Missouri | 26,170 | 3,990 | 2,610 | 960 | 7,240 | 2,000 | 1,760 | 3,350 | 1,240 | 220 | 980 |
| Montana | 7,810 | 1,180 | 830 | 330 | 2,020 | 890 | 620 | 1,050 | 460 | 80 | 380 |
| Nebraska | 10,810 | 1,770 | 1,050 | 420 | 2,460 | 980 | 820 | 1,560 | 600 | 110 | 570 |
| Nevada | 14,180 | 2,320 | 1,250 | 550 | 4,350 | 1,040 | 870 | 2,020 | 550 | 140 | 660 |
| New Hampshire | 8,510 | 1,390 | 1,010 | 380 | 2,280 | 930 | 680 | 1,290 | 480 | 90 | 430 |
| New Jersey | 35,160 | 6,560 | 3,790 | 1,500 | 7,970 | 2,780 | 2,260 | 4,370 | 1,440 | 260 | 1,640 |
| New Mexico | 10,610 | 1,580 | 970 | 430 | 2,700 | 890 | 600 | 1,290 | 440 | 110 | 420 |
| New York | 82,450 | 15,470 | 8,600 | 3,330 | 14,320 | 5,500 | 5,040 | 10,480 | 3,050 | 480 | 3,860 |
| North Carolina | 42,680 | 7,770 | 3,910 | 1,610 | 11,750 | 2,290 | 2,330 | 4,950 | 2,140 | 390 | 1,400 |
| North Dakota | 4,650 | 660 | 580 | 210 | 1,090 | 330 | 450 | 640 | 230 | 40 | 260 |
| Ohio | 44,090 | 7,030 | 4,840 | 1,690 | 10,930 | 3,140 | 2,600 | 5,260 | 2,040 | 350 | 1,720 |
| Oklahoma | 20,750 | 3,490 | 1,910 | 800 | 6,260 | 1,280 | 1,240 | 2,680 | 1,040 | 180 | 700 |
| Oregon | 23,460 | 3,600 | 2,120 | 890 | 5,760 | 2,310 | 1,900 | 3,460 | 1,120 | 240 | 1,190 |
| Pennsylvania | 49,760 | 8,260 | 5,340 | 2,090 | 11,370 | 3,350 | 2,810 | 5,730 | 2,500 | 360 | 1,970 |
| Rhode Island | 6,920 | 1,120 | 790 | 280 | 1,630 | 560 | 420 | 860 | 360 | 60 | 300 |
| South Carolina | 26,240 | 4,620 | 2,370 | 970 | 8,190 | 1,620 | 1,620 | 3,250 | 1,310 | 210 | 850 |
| South Dakota | 6,260 | 860 | 710 | 260 | 1,560 | 510 | 550 | 870 | 330 | 60 | 310 |
| Tennessee | 31,480 | 5,420 | 2,860 | 1,120 | 9,660 | 1,780 | 1,770 | 3,860 | 1,630 | 260 | 1,050 |
| Texas | 116,370 | 23,180 | 6,530 | 3,950 | 16,300 | 5,940 | 4,510 | 16,640 | 4,680 | 960 | 4,450 |
| Utah | 16,170 | 2,780 | 1,030 | 760 | 3,240 | 3,340 | 1,040 | 2,580 | 1,090 | 170 | 930 |
| Vermont | 4,370 | 710 | 510 | 190 | 1,260 | 500 | 340 | 620 | 230 | 40 | 210 |
| Virginia | 37,110 | 6,740 | 3,270 | 1,410 | 9,970 | 2,130 | 2,040 | 4,630 | 1,640 | 320 | 1,220 |
| Washington | 30,770 | 5,160 | 2,590 | 1,070 | 7,260 | 2,630 | 2,040 | 4,670 | 1,410 | 290 | 1,350 |
| West Virginia | 9,960 | 1,650 | 1,260 | 430 | 3,290 | 610 | 670 | 1,390 | 550 | 80 | 330 |
| Wisconsin | 26,540 | 4,180 | 3,150 | 1,080 | 6,930 | 2,190 | 1,910 | 3,500 | 1,320 | 260 | 1,210 |
| Wyoming | 3,610 | 520 | 410 | 140 | 900 | 390 | 270 | 530 | 180 | 30 | 160 |
| United States | 2,114,640 | 321,910 | 158,880 | 67,790 | 229,430 | 112,000 | 79,320 | 333,830 | 84,130 | 13,490 | 62,370 |
Death Rates, 2026
| State | All sites | Brain & other nervous system | Female breast | Colon & rectum | Leukemia | Liver & intrahepatic bile duct | Lung & bronchus | Non-Hodgkin lymphoma | Pancreas | Prostate | Urinary bladder |
| Alabama | 10,670 | 320 | 730 | 970 | 360 | 550 | 2,370 | 280 | 760 | 560 | 310 |
| Alaska | 1,140 | – | 60 | 90 | – | – | 210 | – | 80 | 70 | – |
| Arizona | 13,800 | 350 | 1,000 | 1,330 | 570 | 730 | 2,330 | 450 | 1,170 | 900 | 340 |
| Arkansas | 6,840 | 190 | 390 | 670 | 220 | 360 | 1,640 | 190 | 470 | 360 | 220 |
| California | 61,280 | 1,970 | 4,580 | 5,660 | 2,320 | 3,690 | 9,580 | 2,180 | 5,250 | 4,210 | 1,660 |
| Colorado | 8,740 | 310 | 710 | 790 | 390 | 450 | 1,340 | 290 | 750 | 670 | 260 |
| Connecticut | 6,760 | 230 | 420 | 490 | 270 | 340 | 1,240 | 220 | 600 | 430 | 220 |
| Delaware | 2,430 | 70 | 190 | 190 | 90 | 110 | 510 | 80 | 230 | 150 | 90 |
| District of Columbia | 820 | – | 80 | 80 | 30 | 40 | 150 | – | 70 | 70 | – |
| Florida | 50,010 | 1,470 | 3,360 | 4,240 | 2,000 | 2,200 | 9,990 | 1,560 | 4,280 | 2,970 | 1,630 |
| Georgia | 19,400 | 590 | 1,430 | 1,750 | 700 | 990 | 3,500 | 540 | 1,410 | 1,160 | 530 |
| Hawaii | 2,720 | 50 | 200 | 260 | 90 | 160 | 470 | 100 | 250 | 170 | 60 |
| Idaho | 3,510 | 130 | 250 | 310 | 150 | 190 | 580 | 90 | 300 | 240 | 90 |
| Illinois | 23,230 | 680 | 1,350 | 2,080 | 880 | 1,090 | 4,880 | 730 | 2,080 | 1,280 | 620 |
| Indiana | 14,230 | 390 | 900 | 1,260 | 520 | 560 | 3,430 | 450 | 1,090 | 740 | 400 |
| Iowa | 6,330 | 180 | 370 | 530 | 270 | 290 | 1,350 | 230 | 510 | 330 | 180 |
| Kansas | 5,700 | 190 | 370 | 510 | 250 | 250 | 1,250 | 220 | 450 | 290 | 150 |
| Kentucky | 10,510 | 270 | 640 | 970 | 370 | 500 | 2,870 | 310 | 760 | 450 | 310 |
| Louisiana | 9,360 | 250 | 560 | 870 | 330 | 580 | 2,080 | 260 | 750 | 450 | 220 |
| Maine | 3,560 | 100 | 200 | 260 | 120 | 130 | 800 | 120 | 280 | 220 | 130 |
| Maryland | 11,280 | 300 | 810 | 980 | 420 | 530 | 2,120 | 370 | 960 | 710 | 320 |
| Massachusetts | 12,470 | 410 | 710 | 840 | 460 | 650 | 2,510 | 410 | 1,200 | 710 | 330 |
| Michigan | 21,580 | 630 | 1,320 | 1,630 | 810 | 830 | 4,850 | 630 | 1,900 | 1,120 | 620 |
| Minnesota | 10,660 | 330 | 640 | 800 | 450 | 500 | 2,060 | 390 | 930 | 600 | 270 |
| Mississippi | 6,740 | 190 | 470 | 670 | 250 | 330 | 1,580 | 180 | 510 | 390 | 170 |
| Missouri | 13,470 | 380 | 970 | 1,280 | 490 | 650 | 3,320 | 420 | 1,060 | 720 | 380 |
| Montana | 2,310 | 90 | 140 | 200 | 80 | 120 | 420 | 70 | 190 | 160 | 70 |
| Nebraska | 3,680 | 130 | 260 | 340 | 160 | 170 | 810 | 120 | 320 | 200 | 140 |
| Nevada | 5,840 | 150 | 430 | 580 | 170 | 320 | 1,050 | 170 | 490 | 400 | 200 |
| New Hampshire | 3,050 | 110 | 180 | 190 | 90 | 140 | 630 | 100 | 270 | 180 | 110 |
| New Jersey | 15,150 | 400 | 1,160 | 1,330 | 570 | 690 | 2,890 | 470 | 1,430 | 770 | 470 |
| New Mexico | 3,970 | 120 | 280 | 360 | 170 | 170 | 590 | 120 | 290 | 270 | 110 |
| New York | 31,140 | 850 | 1,920 | 2,680 | 1,190 | 1,310 | 5,850 | 980 | 2,930 | 1,650 | 810 |
| North Carolina | 21,770 | 570 | 1,460 | 1,900 | 780 | 920 | 5,040 | 630 | 1,840 | 1,230 | 590 |
| North Dakota | 1,320 | – | 70 | 110 | 60 | 50 | 270 | – | 120 | 70 | – |
| Ohio | 24,590 | 640 | 1,580 | 2,020 | 950 | 1,050 | 5,550 | 790 | 2,130 | 1,350 | 750 |
| Oklahoma | 8,490 | 250 | 580 | 820 | 320 | 360 | 1,920 | 270 | 590 | 450 | 270 |
| Oregon | 8,840 | 270 | 580 | 670 | 350 | 450 | 1,610 | 310 | 710 | 590 | 300 |
| Pennsylvania | 27,630 | 820 | 1,770 | 2,240 | 1,060 | 1,260 | 5,870 | 900 | 2,420 | 1,440 | 850 |
| Rhode Island | 2,120 | 70 | 120 | 150 | 70 | 140 | 410 | 70 | 200 | 110 | 70 |
| South Carolina | 11,700 | 360 | 800 | 970 | 420 | 590 | 2,400 | 360 | 960 | 660 | 430 |
| South Dakota | 1,810 | – | 90 | 150 | 80 | 50 | 380 | 60 | 160 | 100 | – |
| Tennessee | 15,270 | 400 | 1,040 | 1,610 | 530 | 720 | 3,690 | 450 | 1,160 | 750 | 350 |
| Texas | 46,300 | 1,360 | 3,400 | 4,750 | 1,820 | 3,170 | 8,080 | 1,470 | 3,770 | 2,480 | 1,220 |
| Utah | 3,970 | 170 | 340 | 440 | 190 | 200 | 470 | 140 | 350 | 310 | 100 |
| Vermont | 1,520 | 50 | 90 | 130 | 50 | 50 | 300 | 50 | 130 | 100 | – |
| Virginia | 16,550 | 500 | 1,150 | 1,490 | 650 | 780 | 3,300 | 500 | 1,320 | 1,020 | 440 |
| Washington | 14,160 | 390 | 960 | 1,160 | 540 | 730 | 2,570 | 510 | 1,220 | 980 | 400 |
| West Virginia | 4,710 | 120 | 290 | 420 | 180 | 190 | 1,330 | 150 | 330 | 240 | 130 |
| Wisconsin | 11,840 | 360 | 670 | 880 | 560 | 550 | 2,310 | 410 | 1,200 | 790 | 320 |
| Wyoming | 1,160 | – | 80 | 130 | – | 50 | 210 | – | 110 | 70 | – |
| United States | 626,140 | 18,350 | 42,140 | 55,230 | 23,910 | 30,980 | 124,990 | 19,970 | – | – | – |
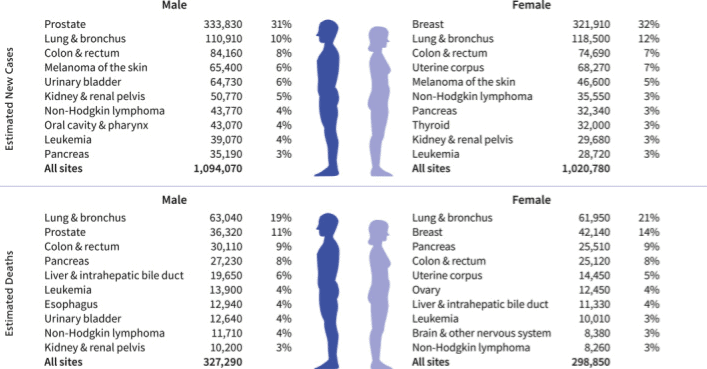
Estimated Cancer New Cases by Sex and Site, 2026
(Source: pubmed.ncbi.nlm.nih.gov)
| Cancer Site | Male Estimated New Cases | Male Percent | Female Estimated New Cases | Female Percent |
| Prostate | 333,830 | 31% | Breast | 321,910 |
| Lung & bronchus | 110,910 | 10% | Lung & bronchus | 118,500 |
| Colon & rectum | 84,160 | 8% | Colon & rectum | 83,330 |
| Melanoma of the skin | 65,400 | 6% | Uterine corpus | 65,950 |
| Urinary bladder | 62,420 | 6% | Melanoma of the skin | 52,030 |
| Kidney & renal pelvis | 49,830 | 5% | Non-Hodgkin lymphoma | 35,550 |
| Non-Hodgkin lymphoma | 40,430 | 4% | Pancreas | 32,560 |
| Oral cavity & pharynx | 40,250 | 4% | Thyroid | 31,910 |
| Leukemia | 39,070 | 4% | Kidney & renal pelvis | 29,680 |
| Pancreas | 35,190 | 3% | Leukemia | 28,720 |
| All sites | 1,094,070 | – | All sites | 1,020,780 |
Estimated Cancer Deaths by Sex and Site
| Cancer Site | Male Estimated Deaths | Male Percent | Female Estimated Deaths | Female Percent |
| Lung & bronchus | 63,040 | 19% | Lung & bronchus | 61,950 |
| Prostate | 36,320 | 11% | Breast | 42,140 |
| Colon & rectum | 28,290 | 9% | Pancreas | 23,830 |
| Pancreas | 27,230 | 8% | Colon & rectum | 25,120 |
| Liver & intrahepatic bile duct | 27,070 | 8% | Uterine corpus | 12,390 |
| Leukemia | 12,940 | 4% | Ovary | 12,810 |
| Esophagus | 13,020 | 4% | Liver & intrahepatic bile duct | 9,860 |
| Urinary bladder | 12,520 | 4% | Leukemia | 9,470 |
| Non-Hodgkin lymphoma | 11,710 | 4% | Brain & other nervous system | 8,280 |
| Kidney & renal pelvis | 10,240 | 3% | Non-Hodgkin lymphoma | 8,620 |
| All sites | 327,290 | – | All sites | 298,850 |
United States Cancer Cases by Age Group
- The American Cancer Society (ACS) estimates 2,114,850 new cancer cases and 626,140 cancer deaths in the United States in 2026.
- Older adults aged 65 years and above account for 60% of all new cancer diagnoses, making them the largest affected age group. Prostate, lung, and colorectal cancers are the most common cancers in this population.
- Adults aged 50-64 years represent 28% of all new cancer cases.
- Breast cancer is one of the leading cancers in this age group, with 17% of cases diagnosed before age 50.
- People under 50 years account for 12% of all cancer diagnoses. Although overall cancer risk is lower, several cancers develop earlier in life.
- Early-onset cancers vary by type. About 47% of cervical cancers and 45% of colorectal cancers are diagnosed before age 50, compared with only 1% of prostate cancers and 2% of lung cancers.
Cancer Treatment Advances and Immunotherapy Statistics
- The American Cancer Society (ACS) estimates 2.1 million new cancer cases and 626,000 cancer deaths in the United States in 2026.
- Cancer remains the second leading cause of death overall and the leading cause of death among men aged 60-79 and women aged 40-79.
- On average, the U.S. records about 5,800 new cancer cases and 1,720 cancer deaths every day.
- The 5-year relative survival rate for all cancers increased to 70% during 2015-2021, up from 49% in the mid-1970s.
Impact of Immunotherapy
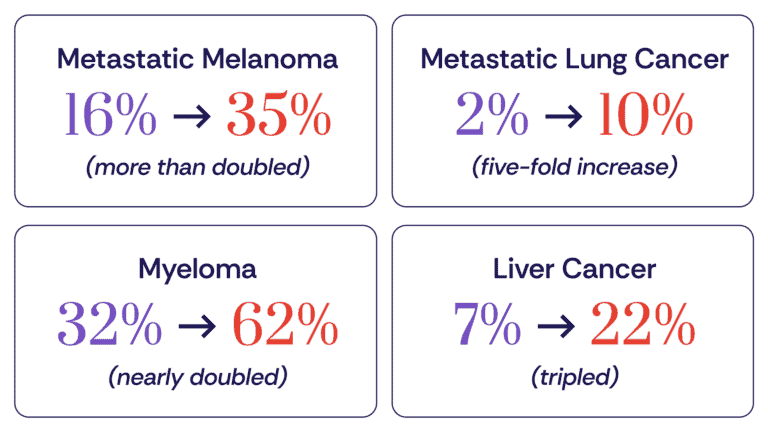
- Immunotherapy and targeted therapies have significantly improved survival for several advanced cancers, including metastatic melanoma, by helping the immune system recognize and attack cancer cells.
- From 1991 to 2023, the overall U.S. cancer death rate declined by 34%, preventing an estimated 4.8 million cancer deaths through better prevention, early detection, and improved treatments.
(Source: cancerresearch.org)
- Metastatic melanoma survival rose from 16% to 35%; metastatic lung cancer from 2% to 10%.
- Myeloma survival increased from 32% to 62%; liver cancer from 7% to 22%.
Ongoing Challenges
- According to cancerresearch.org, colorectal cancer incidence is increasing by 2.9% per year among people under 50, while the overall rate has declined by 0.9% per year because of screening.
- Breast cancer incidence has increased by 1% per year since 2013, with a faster rise of 1.4% per year in women under 50.
- Cancer death rates vary from 122 per 100,000 in Utah and Hawaii to 180 per 100,000 in Kentucky, a 48% difference.
- HPV vaccination coverage ranges from 38% in Mississippi to 84% in Rhode Island.
Health Disparities
- Black men have prostate cancer death rates 2-4 times higher than other racial groups.
- American Indian and Alaska Native populations experience 2 times higher mortality from kidney, liver, stomach, and cervical cancers.
- Black women have uterine cancer death rates 2 times higher than White women, while Asian, Black, and Hispanic patients remain less likely to receive recommended genetic testing for targeted therapies.
Global Cancer Risk Factors Statistics
- According to the WHO and IARC, 37%-40% of new cancer cases worldwide are linked to preventable risk factors.
- In 2022, about 7.1 million new cancer cases (37.8% of all cases) were associated with 30 modifiable causes, including tobacco, alcohol, high body mass index (BMI), physical inactivity, air pollution, ultraviolet (UV) radiation, and 9 cancer-causing infections.
Leading Preventable Risk Factors
- Tobacco use is the largest preventable cause of cancer, contributing to 15.1% of all new cancer cases globally.
- Cancer-causing infections, such as HPV, HBV, HCV, and Helicobacter pylori, account for 10%-10.2% of new cancer cases.
- Alcohol consumption contributes 3%-3.2% of global cancer cases.
- High BMI, low physical activity, and air pollution further increase cancer risk across many regions.
Differences by Sex
- Around 45% of new cancer cases in men are linked to modifiable risk factors, compared with 30% in women.
- In men, smoking accounts for about 23% of new cancer cases, followed by infections (9%) and alcohol (4%).
- In women, infections contribute 11% of new cancer cases, smoking 6%, and high BMI 3%.
U.S. Lifestyle Risk Factors
- The American Cancer Society (ACS) identifies tobacco use, excess body weight, unhealthy diet, physical inactivity, and alcohol consumption as the leading preventable cancer risks in the United States.
- Smoking prevalence declined from 42% in 1964 to 11% in 2023, yet smoking is expected to cause about 182,830 cancer deaths in 2026.
- Cigarette smoking is responsible for approximately 87% of lung cancers in men and 84% in women.
Infection and Environmental Risks
- HPV causes nearly all cervical cancers, while HBV, HCV, and Helicobacter pylori remain major causes of liver and stomach cancers.
- Outdoor and indoor air pollution, asbestos, industrial chemicals, and ionizing radiation continue to increase cancer risk, particularly in urban and industrial regions.
Cancer Treatment and Survival Advances Statistics
- Immunotherapy, CAR-T therapy, targeted medicines, earlier screening, and precision treatment continue to improve outcomes. However, colorectal cancer incidence is rising by 2.9% per year and breast cancer by 1.4% per year among people under 50.
- The World Health Organization (WHO) reports that global cancer cases continue to rise in 2026. Still, survival rates are improving in countries with better access to screening, early diagnosis, radiotherapy, and modern treatments.
- In the United States, the American Cancer Society (ACS) projects 2,114,850 new cancer cases and 626,140 cancer deaths in 2026, equal to about 5,800 new diagnoses and 1,720 deaths every day.
- Since 1991, the U.S. cancer death rate has fallen by 34%, preventing an estimated 4.8 million deaths, including 3,256,800 among men and 1,555,300 among women.
- The 5-year relative survival rate for all cancers improved from 49% in the mid-1970s to 70% during 2015-2021. Survival for regional-stage cancers increased from 54% to 69%, while distant-stage cancers improved from 17% to 35%.
Cancer Statistics By Prevention And Early Detection
- Around 40% of cancer cases are considered curable by changing lifestyle, such as quitting smoking, maintaining a healthy diet, and exercising regularly.
- In the U.S., mammography screening has led to a 30% reduction in breast cancer deaths since its implementation.
- Cancer Statistics also show that 70% of girls worldwide will receive the HPV vaccine by the age of 15, which will significantly decrease the incidence rate of cervical cancer in the coming decades.
By Economic Impacts
- As of 2024, the United States of America has faced the highest economic burden, as cancer-related costs will reach around USD 250 billion.
- This represents USD 180 billion in direct medical costs and USD 70 billion in lost productivity.
- Cancer Statistics further elaborates that the economic impact of cancer will be up to USD 200 billion in Europe, followed by Asia-Pacific (USD 150 billion).
Final remarks
Cancer is a serious disease, but many cases can be prevented or treated when found early. Healthy habits, regular checkups, and cancer screening help lower the risk and improve survival. New treatments and ongoing research are giving patients better care and more hope than ever before.
By spreading awareness, supporting research, and making healthcare easier to access, we can reduce the impact of cancer and help more people live longer, healthier lives.
FAQ
Cancer is caused by DNA mutations triggered by tobacco, unhealthy lifestyle, infections, radiation, harmful chemicals, aging, or inherited genetic changes.
Common symptoms of cancer include unexplained weight loss, persistent fatigue, lumps, unusual bleeding, and lasting pain or cough.
Include breast, lung, prostate, colorectal, skin, cervical, liver, and stomach cancers affecting millions worldwide.

Sources