





Opening
iPhone Vs. Android Statistics: Smartphones have become the epicenter of mobile telephony for about two decades now. While there are many mobile brands to choose from, users tend to select a phone with an iPhone or Android-based platform, which are very different. While Apple is the sole provider of iOS, Android has umpteen brands ranging from budget to premium segments for users looking for a holistic comparative advantage on iPhone vs Android.
Editor’s Verified Favourites
- According to iPhone vs. Android statistics, Android held a 72.77% market share in the global market as of 2025.
- HTC Dream was the world’s first Android phone, which was released in October 2008.
- The first iPhone was released in June 2007.
- iPhone holds an impressive 58.13% market share in the US as of 2025.
- Globally, there are 3.6 billion Android phones and roughly 1.5 billion iPhones.
- As of 2025, Apple is the largest smartphone vendor with a 20% global market share, shipping 247.8 million units and overtaking Samsung for the first time in 14 years.
- Based on iPhone vs. Android Statistics, Samsung is the second-largest vendor and the largest Android smartphone vendor, with a 19% global market share as of 2025.
- Apple App Store’s revenue is significantly higher, with USD 117 billion in revenue in comparison to the USD 49 billion revenue of the Google Play Store.
- Android has been consistently the best-selling mobile phone operating system since 2011.
- India is the largest Android market, with a share of 92.4% in 2025. In contrast, the US remains Apple’s most significant market, with approximately 33% of Apple’s revenue coming from the USA alone.
- As of 2025, there are approximately 45.9 million subscribers to Apple TV+.
iPhone Vs Android Market Share
- Android had a 72.77% global mobile operating-system market share as of January 2025.
- The market share of iPhones (iOS) in the US was 58.91% in 2025.
- There were still over 1 billion active iPhones and over 3 billion active Android smartphones in 2025; broader estimates place Android’s active user base at approximately 4.2 billion.
- In Q4 2025, Android devices comprised approximately 73% of global smartphone sales, while iOS accounted for about 27%.
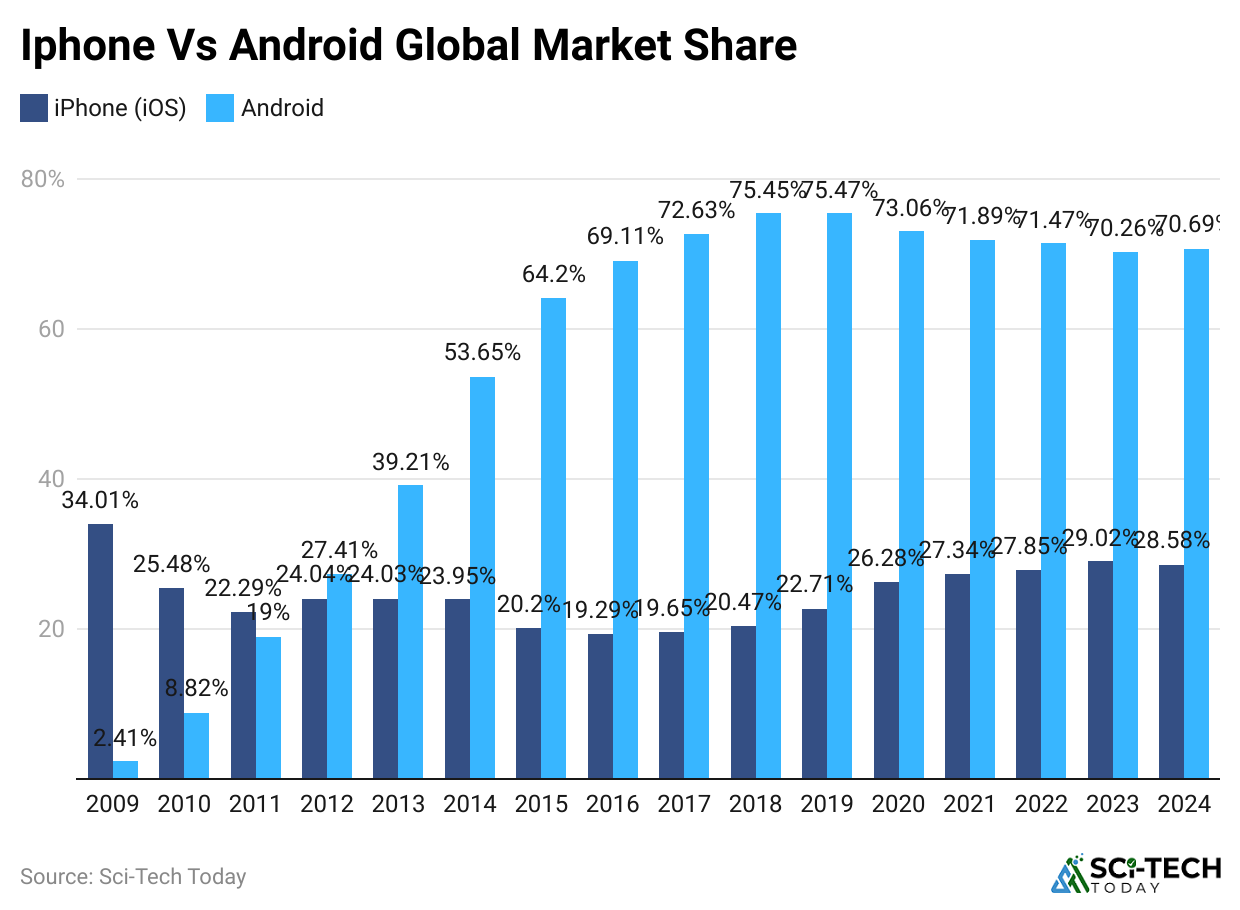
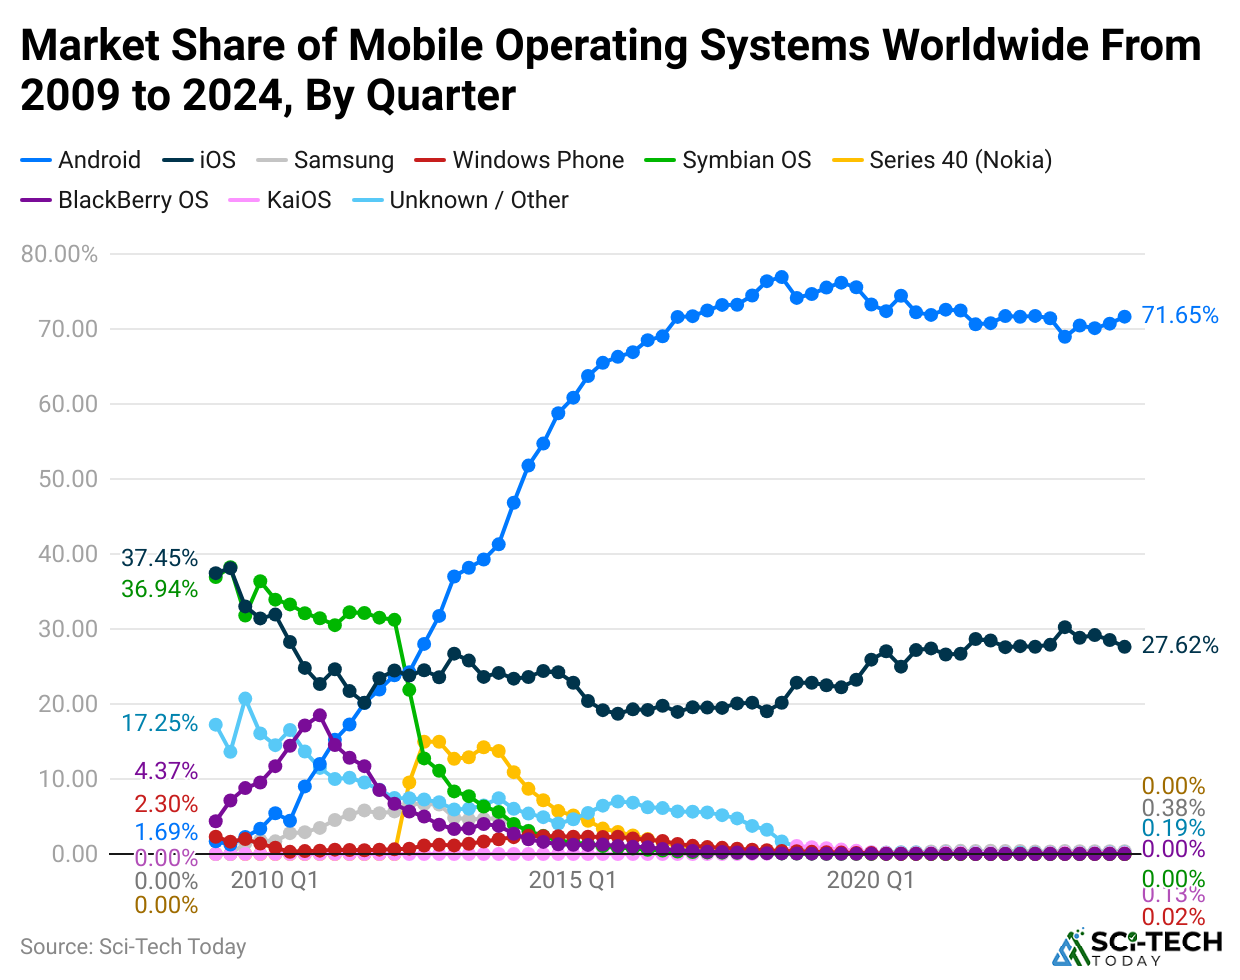
- As per the graph, iPhone was the dominant smartphone market until 2011.
- Since 2011, Android has remained at the top of the global market share and continued to lead in 2025, with approximately 72.77% worldwide market share, compared with 26.82% for iOS.
(Reference: backlinko.com)
Mobile Vendor Market Share Statistics
(Reference: statcounter.com)
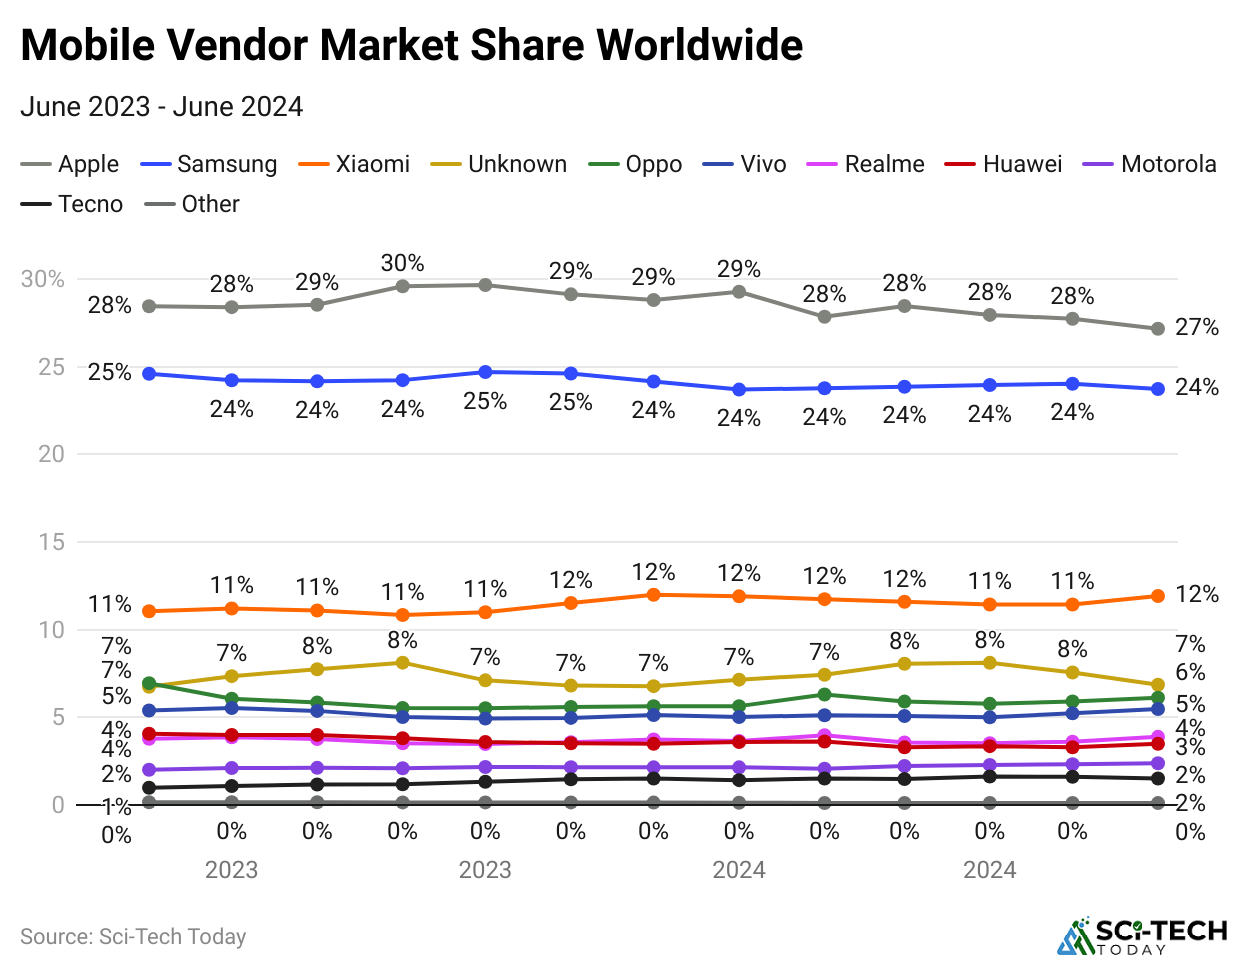
- According to iPhone vs. Android statistics, the iPhone was the largest smartphone vendor in 2025, with a 20% global market share.
- Samsung is the largest Android and 2nd second-largest Smartphone vendor, with 19% global market share in 2025.
- Xiaomi had the third-most significant market share of a smartphone vendor market share in 2025, at approximately 13%.
Mobile App Consumer Spending Statistics
(Reference: netguru.com)
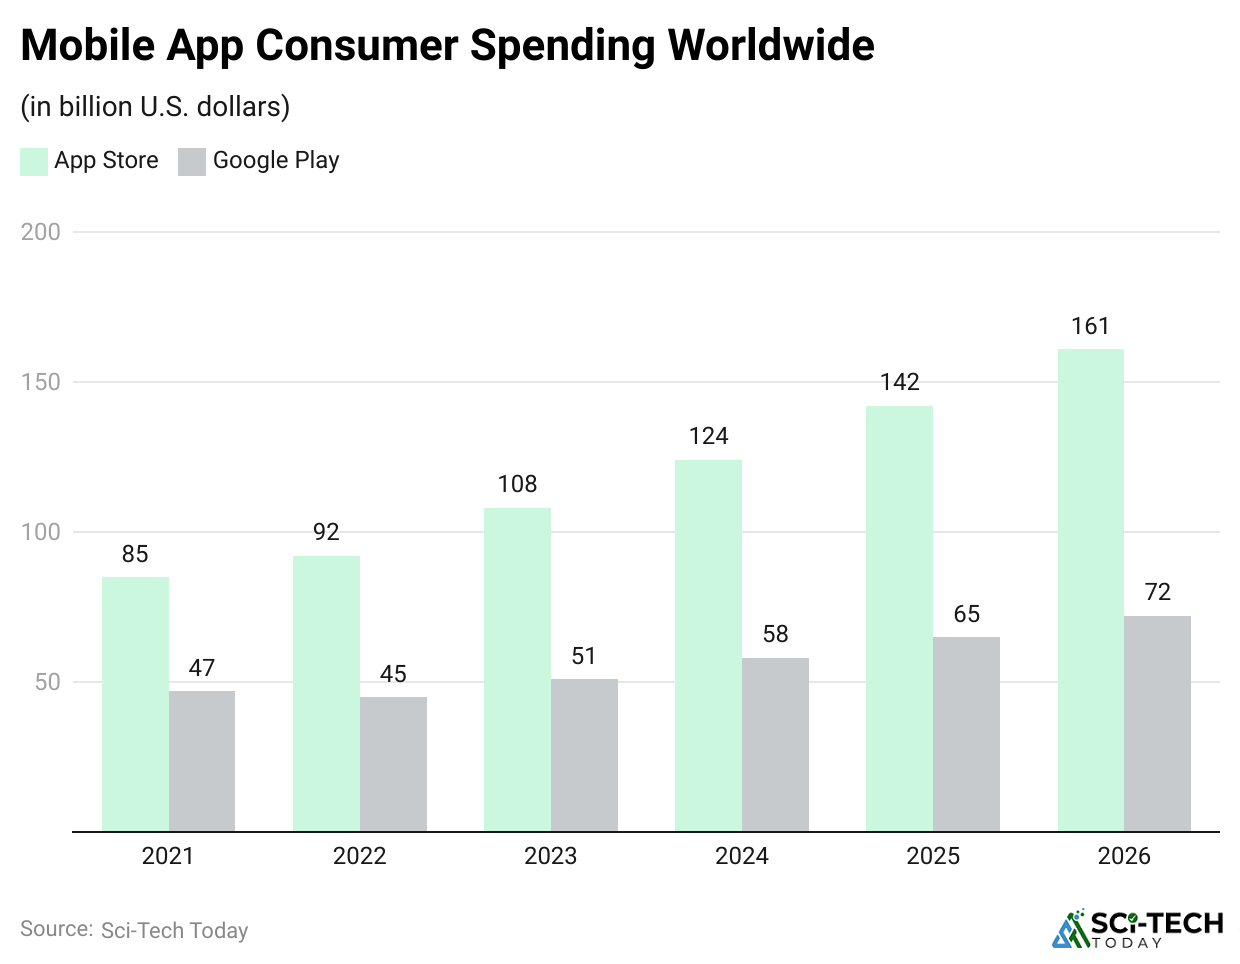
- Apple’s app store consumption is significantly higher than Google Play Store.
- In 2025, USD 142 billion was collectively spent on the App Store, whereas USD 65 billion was spent on Google Play.
- By 2026, it is predicted that Apple will have USD 161 billion in revenue with the App Store compared to USD 72 billion in the Google Play Store.
iPhone’s Worldwide Market Share
- The USA remains Apple’s most significant regional market, with overall sales amounting to USD 37.3 billion in 2024.
- 1st iPhone was officially launched on June 29, 2007.
- 58.13% of the overall comes from the USA.
- The iPhone is Apple’s most successful product and has contributed mainly to becoming the most valued company in the world in terms of market capitalization.
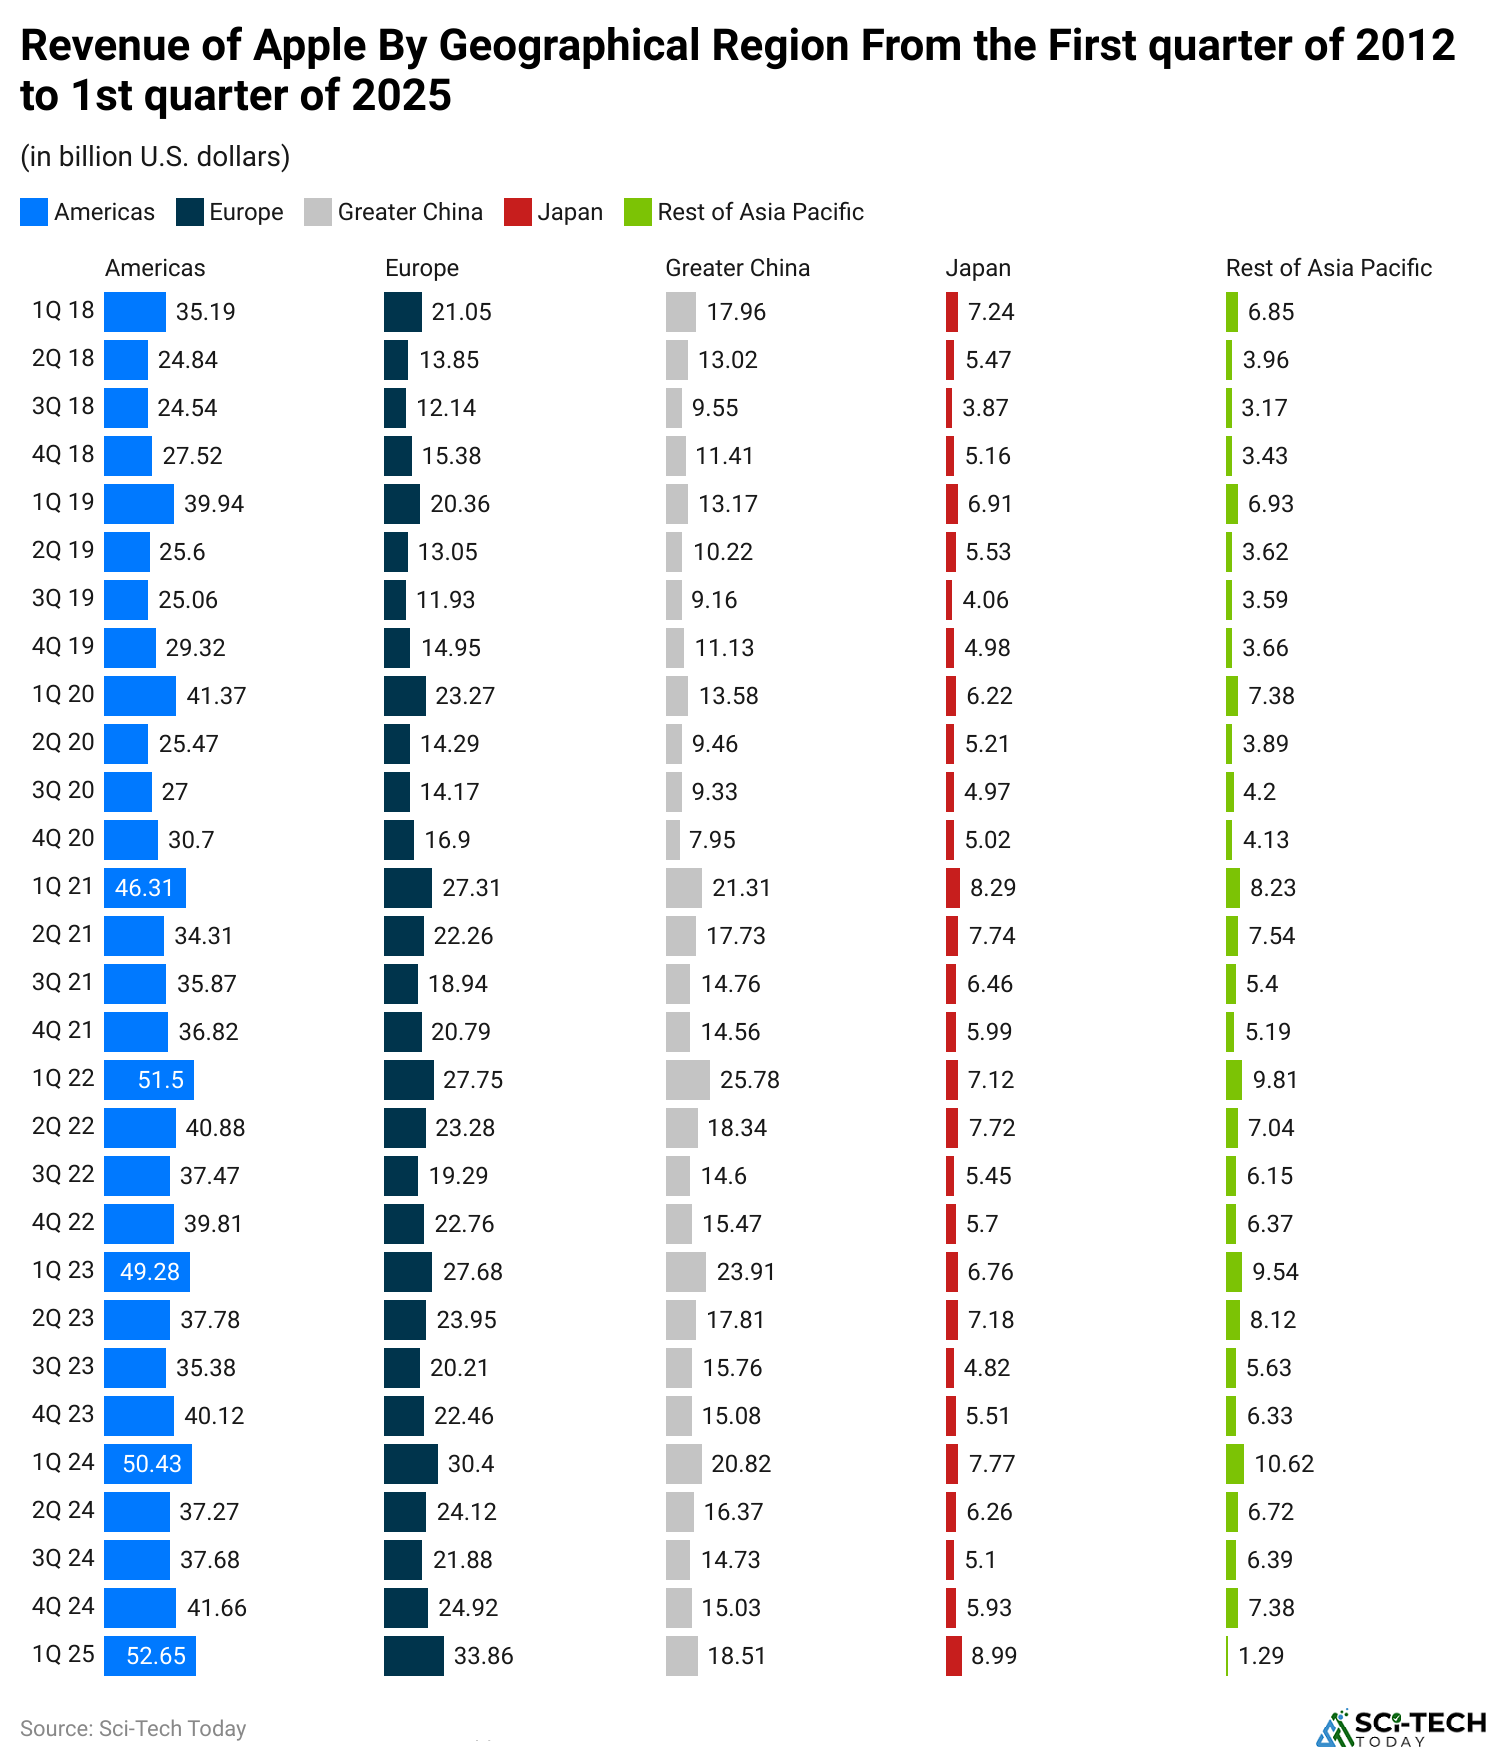
- Based on the graph mentioned above, it is evident that Apple has the largest market share in the Americas.
- Europe remains a close second, followed by Japan and the rest of the world.
- By the end of the 1st quarter of 2025, Apple’s revenue was USD 115.3 billion, with the Americas contributing USD 52.65 billion.
(Reference: statista.com)
Android’s Worldwide Market Share
- Since 2011, Android has been the best-selling operating system worldwide.
- HTC Dream was the world’s first commercially available Android device, released on October 20, 2008.
- As of 2025, Android has a 72.77% market share globally.
- As of 2025, Android has more active devices globally, over 3.6 billion.
- In markets like South America, Africa, and Asia, Android devices command a more significant percentage of the market.
- Compared to iOS, Android commands a more significant portion of the worldwide tablet market.
- In terms of total shipment numbers, the Android platform is dominant; there are more Android phones shipped than iPhones.
- The users of Android smartphones have access to a wide range of different brands of smartphones to choose from.
- In the educational space, Android smartphones hold a larger market share, especially in colleges and universities.
(Reference: statista.com)
- As the graph mentions, Android is the most popular mobile phone operating system.
- The iOS is the next rival, with a 26.82% market share as of Q1 2025.
- Since 2011, Android has grown extensively to remain the most used mobile phone operating system.
iPhone Vs Android User Experience
- The probability of iPhone users paying for apps is more compared to Android users.
- When compared with Android phones, iPhones receive high consumer satisfaction scores.
- An Android user is more likely to switch to an iPhone than an iPhone user to switch to an Android phone.
- iPhone users have a higher rate of user engagement and spend more time on their phones when compared with Android users.
- Compared with iPhones, there are additional hardware features provided by Android handsets, such as Dual Sim slots and IR Blasters.
- iPhones enjoy a better customer loyalty score as a larger percentage of iPhone customers remain loyal to their devices while upgrading.
- Android users are more inclined to play games and engage in other forms of entertainment on their devices.
- As per iPhone vs Android statistics, males prefer Android, and females prefer iPhones.
- iPhone users are usually the early adopters. As a result, they have a higher presence in the Western developed world.
- Android users are present evenly across the world.
Apple Vs. Android Users Demographics
- By 2025, global mobile data usage is predicted to reach 139 exabytes a month and will nearly double up to 274 exabytes a month by 2030.
- According to research, 79% of American Gen Z mobile phone users prefer the brand Apple, while 13% use the brand Samsung, predicting an increase in the current market share for iPhones in the US.
- In 2025, 88% of teenagers in the USA are already iPhone users, whereas 25% of them are estimated to switch to the iPhone 17 in the fall.
- 79% of iPhone users in the USA are using the Apple Watch as a smartwatch/fitness device, whereas only 22% of Android users do.
- The number one factor for the purchase of their next smartphone is price for 62% of Android and iPhone users in the U.S.
- 50% of American Android and Apple users are not ready to pay monthly subscription for AI capabilities on their smartphones.
- Privacy was the concern of slightly above 40% of these consumers when using AI in 2025, 7% more than in 2024.
- This problem concerns people of all generations; 45% of Boomers and 41% of both Gen Z and Gen X users are worried about that.
- Samsung took first place in terms of smartphone satisfaction in the U.S. with the score of 82 points, compared to Apple which got 81 points, LG and Motorola (Android) got 77 points each in 2025.
- Chatting or messaging was the primary purpose of smartphone usage for 75% of users in the world.
Interesting Facts About Apple
- In the USA, about 58.13% of smartphone users used iPhones in 2025.
- Among young people aged 18–34, 79% used iPhones in 2025.
- As of 2025, there are 45 million subscribers to Apple TV+.
- In fiscal 2025, USD 35.69 billion of sales came from Apple’s Wearables, Home and Accessories segment, accounting for 8.58% of total sales.
- In fiscal 2025, USD 33.71 billion of sales came from Mac, accounting for 8.1% of total sales.
- In fiscal 2025, USD 28.02 billion of sales came from iPad, accounting for 6.73% of total sales.
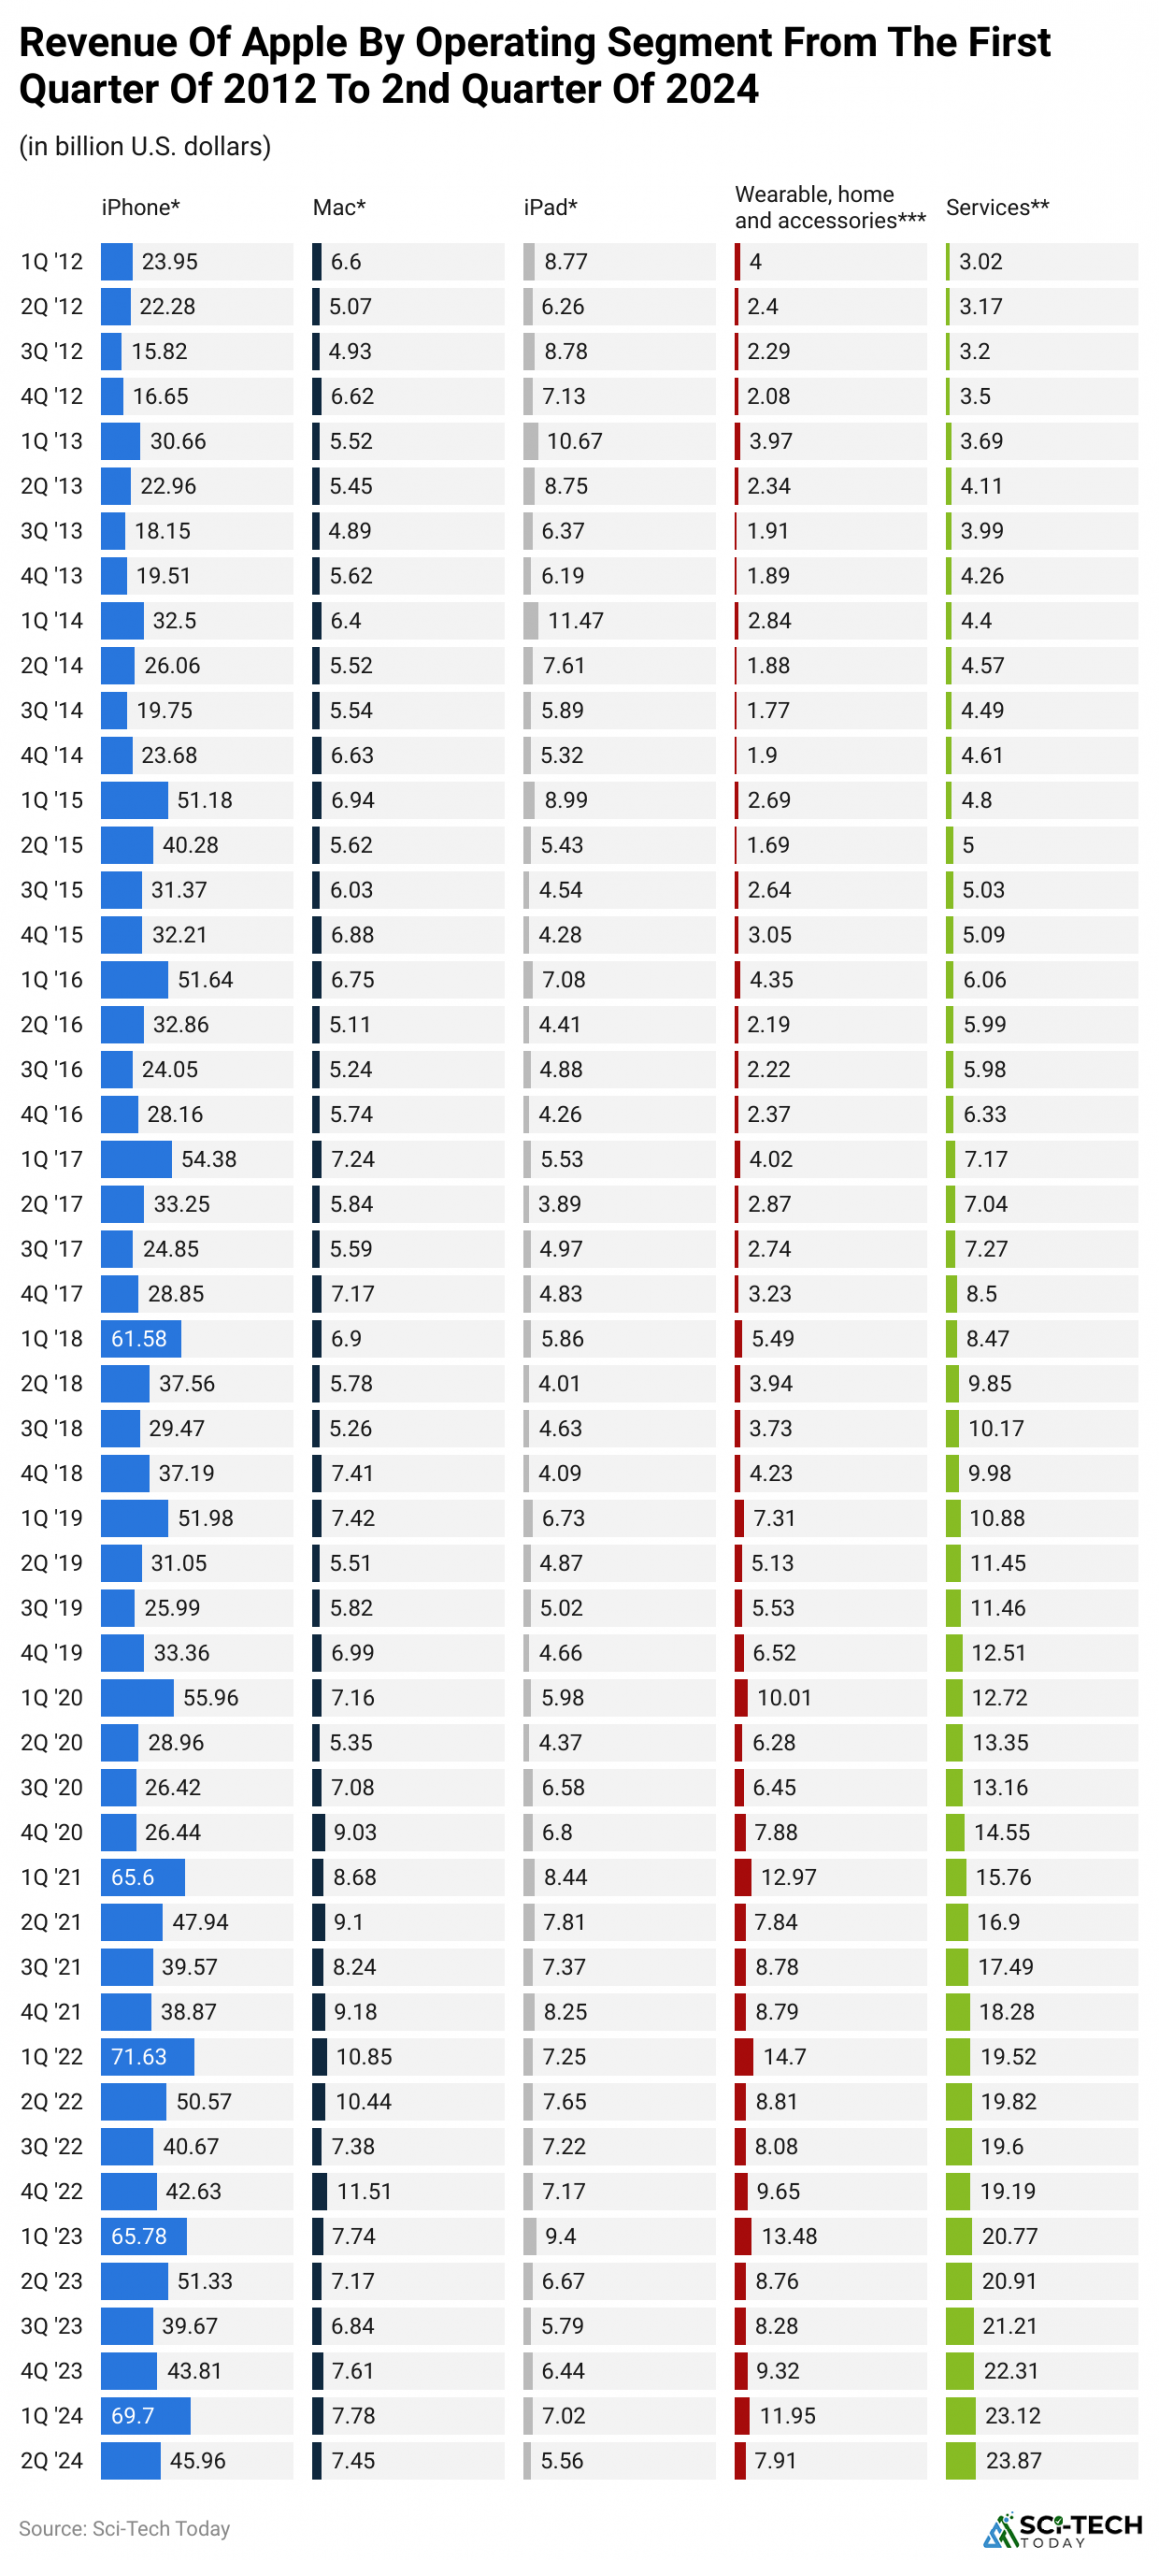
- As per the graph, Apple is slowly but steadily transforming itself from a product-based company to a product-based one.
- In the second quarter of 2025, Apple Services accounted for about 28% of total Apple revenue, or USD 26.64 billion.
- However, the iPhone remained the highest-selling segment in the second quarter of 2025, accounting for about 49% of Apple’s total revenue, or USD 46.84 billion.
(Reference: statista.com)
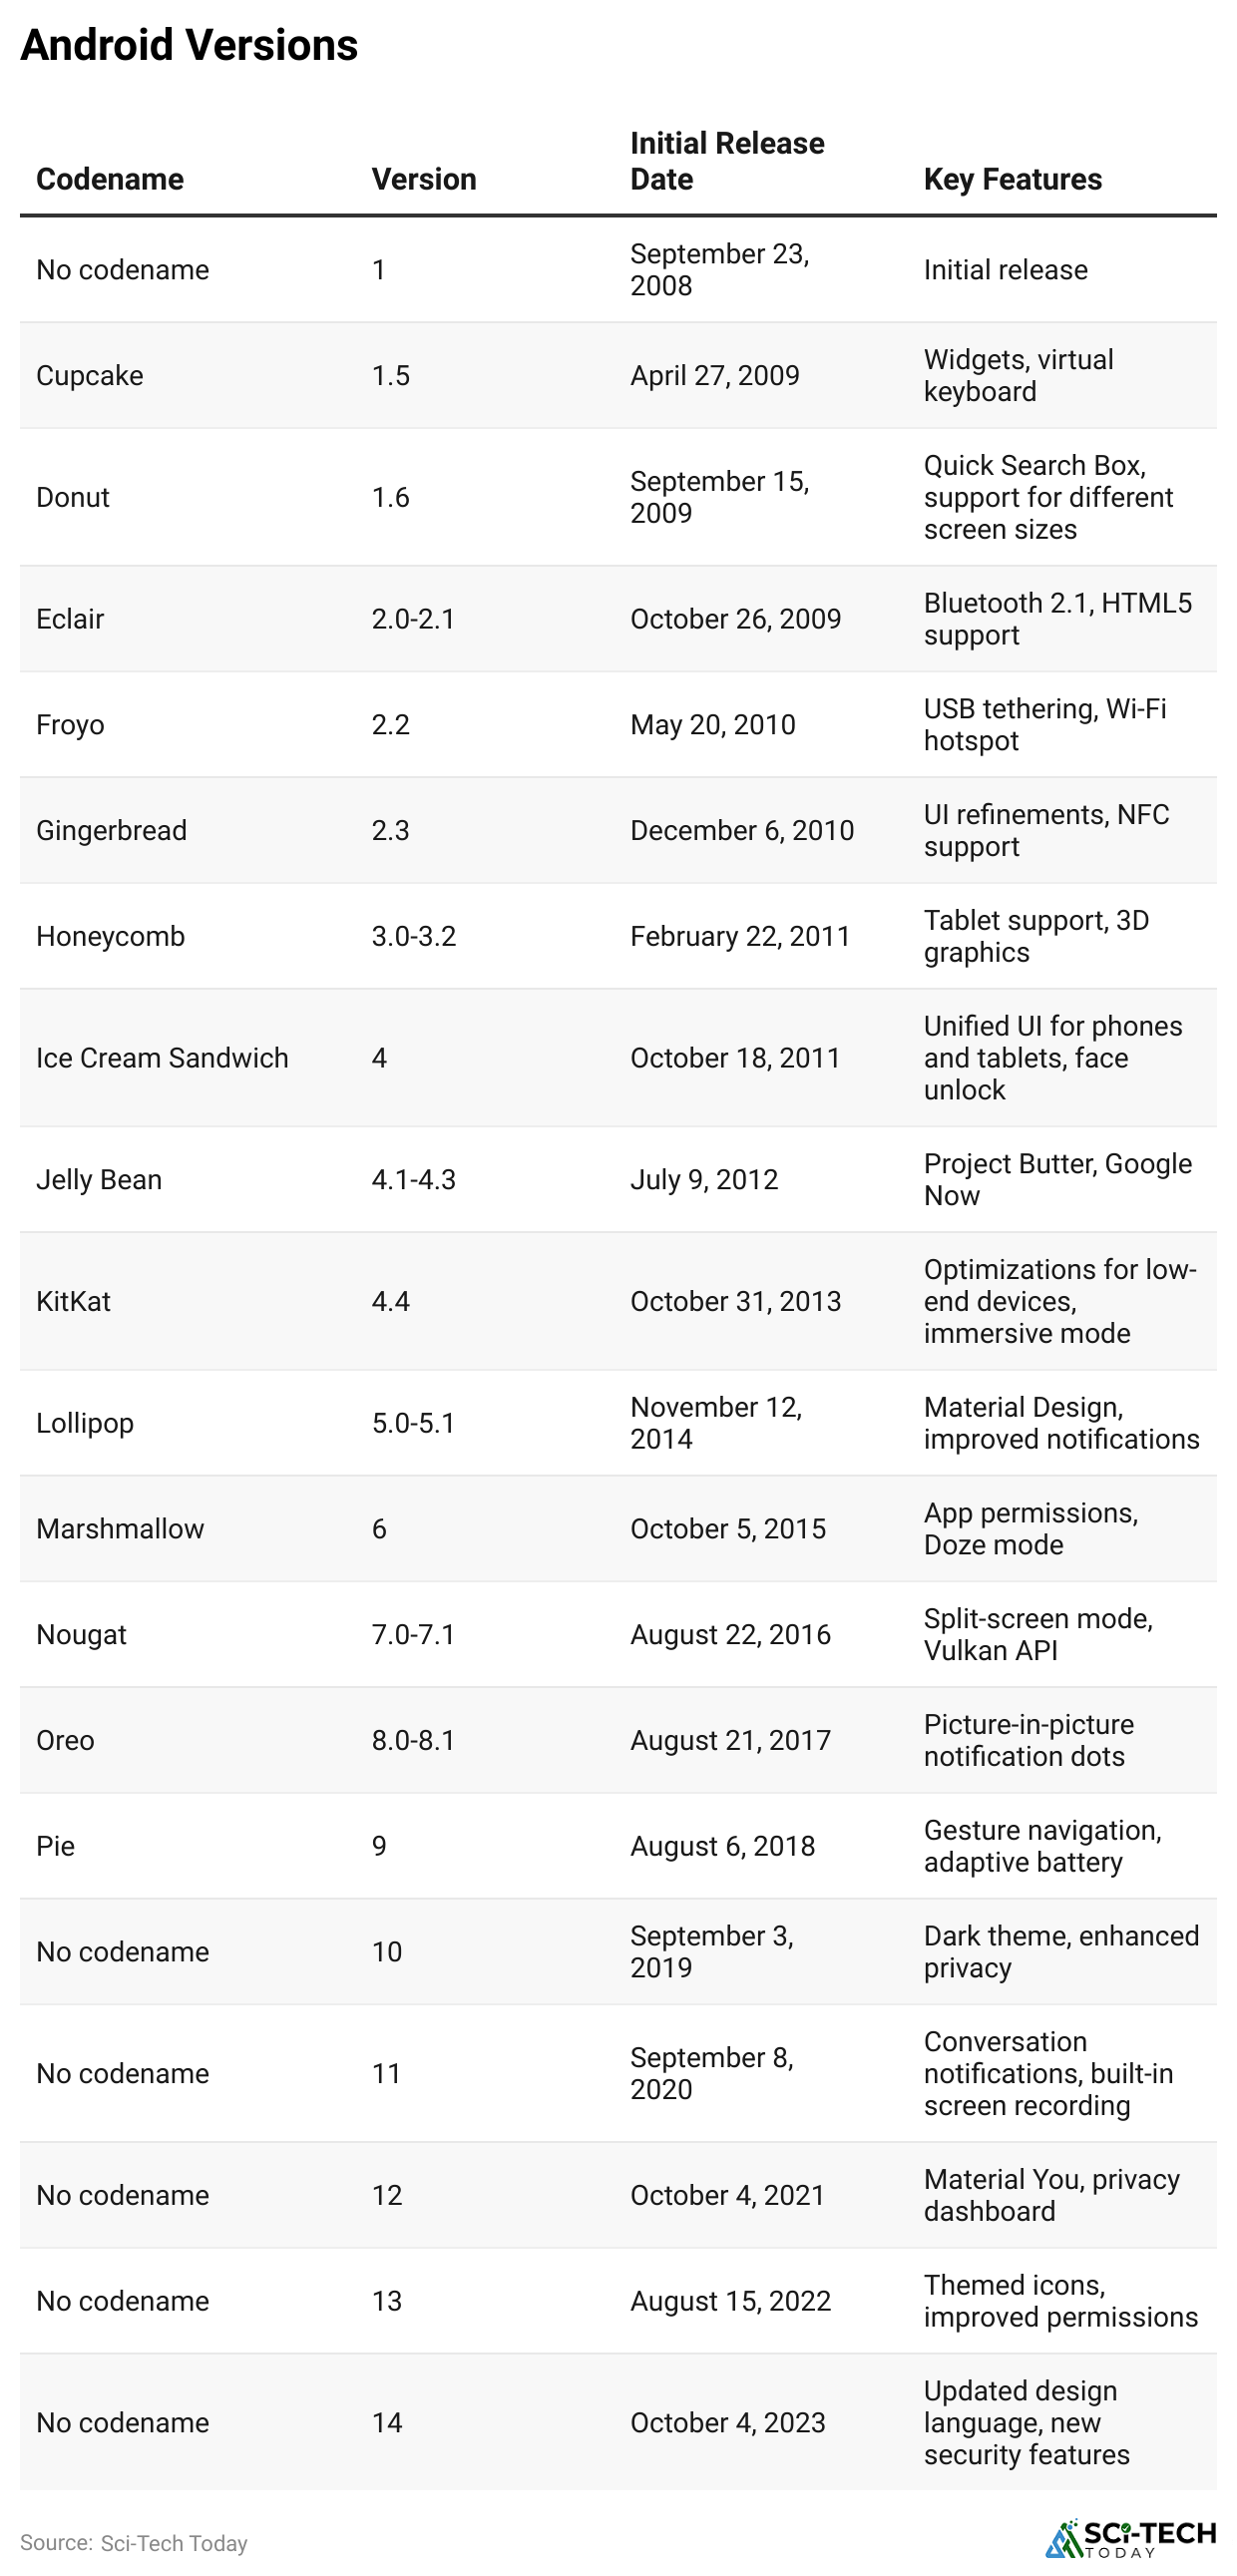
Android vs iOS Versions
(Reference: wikipedia.org)
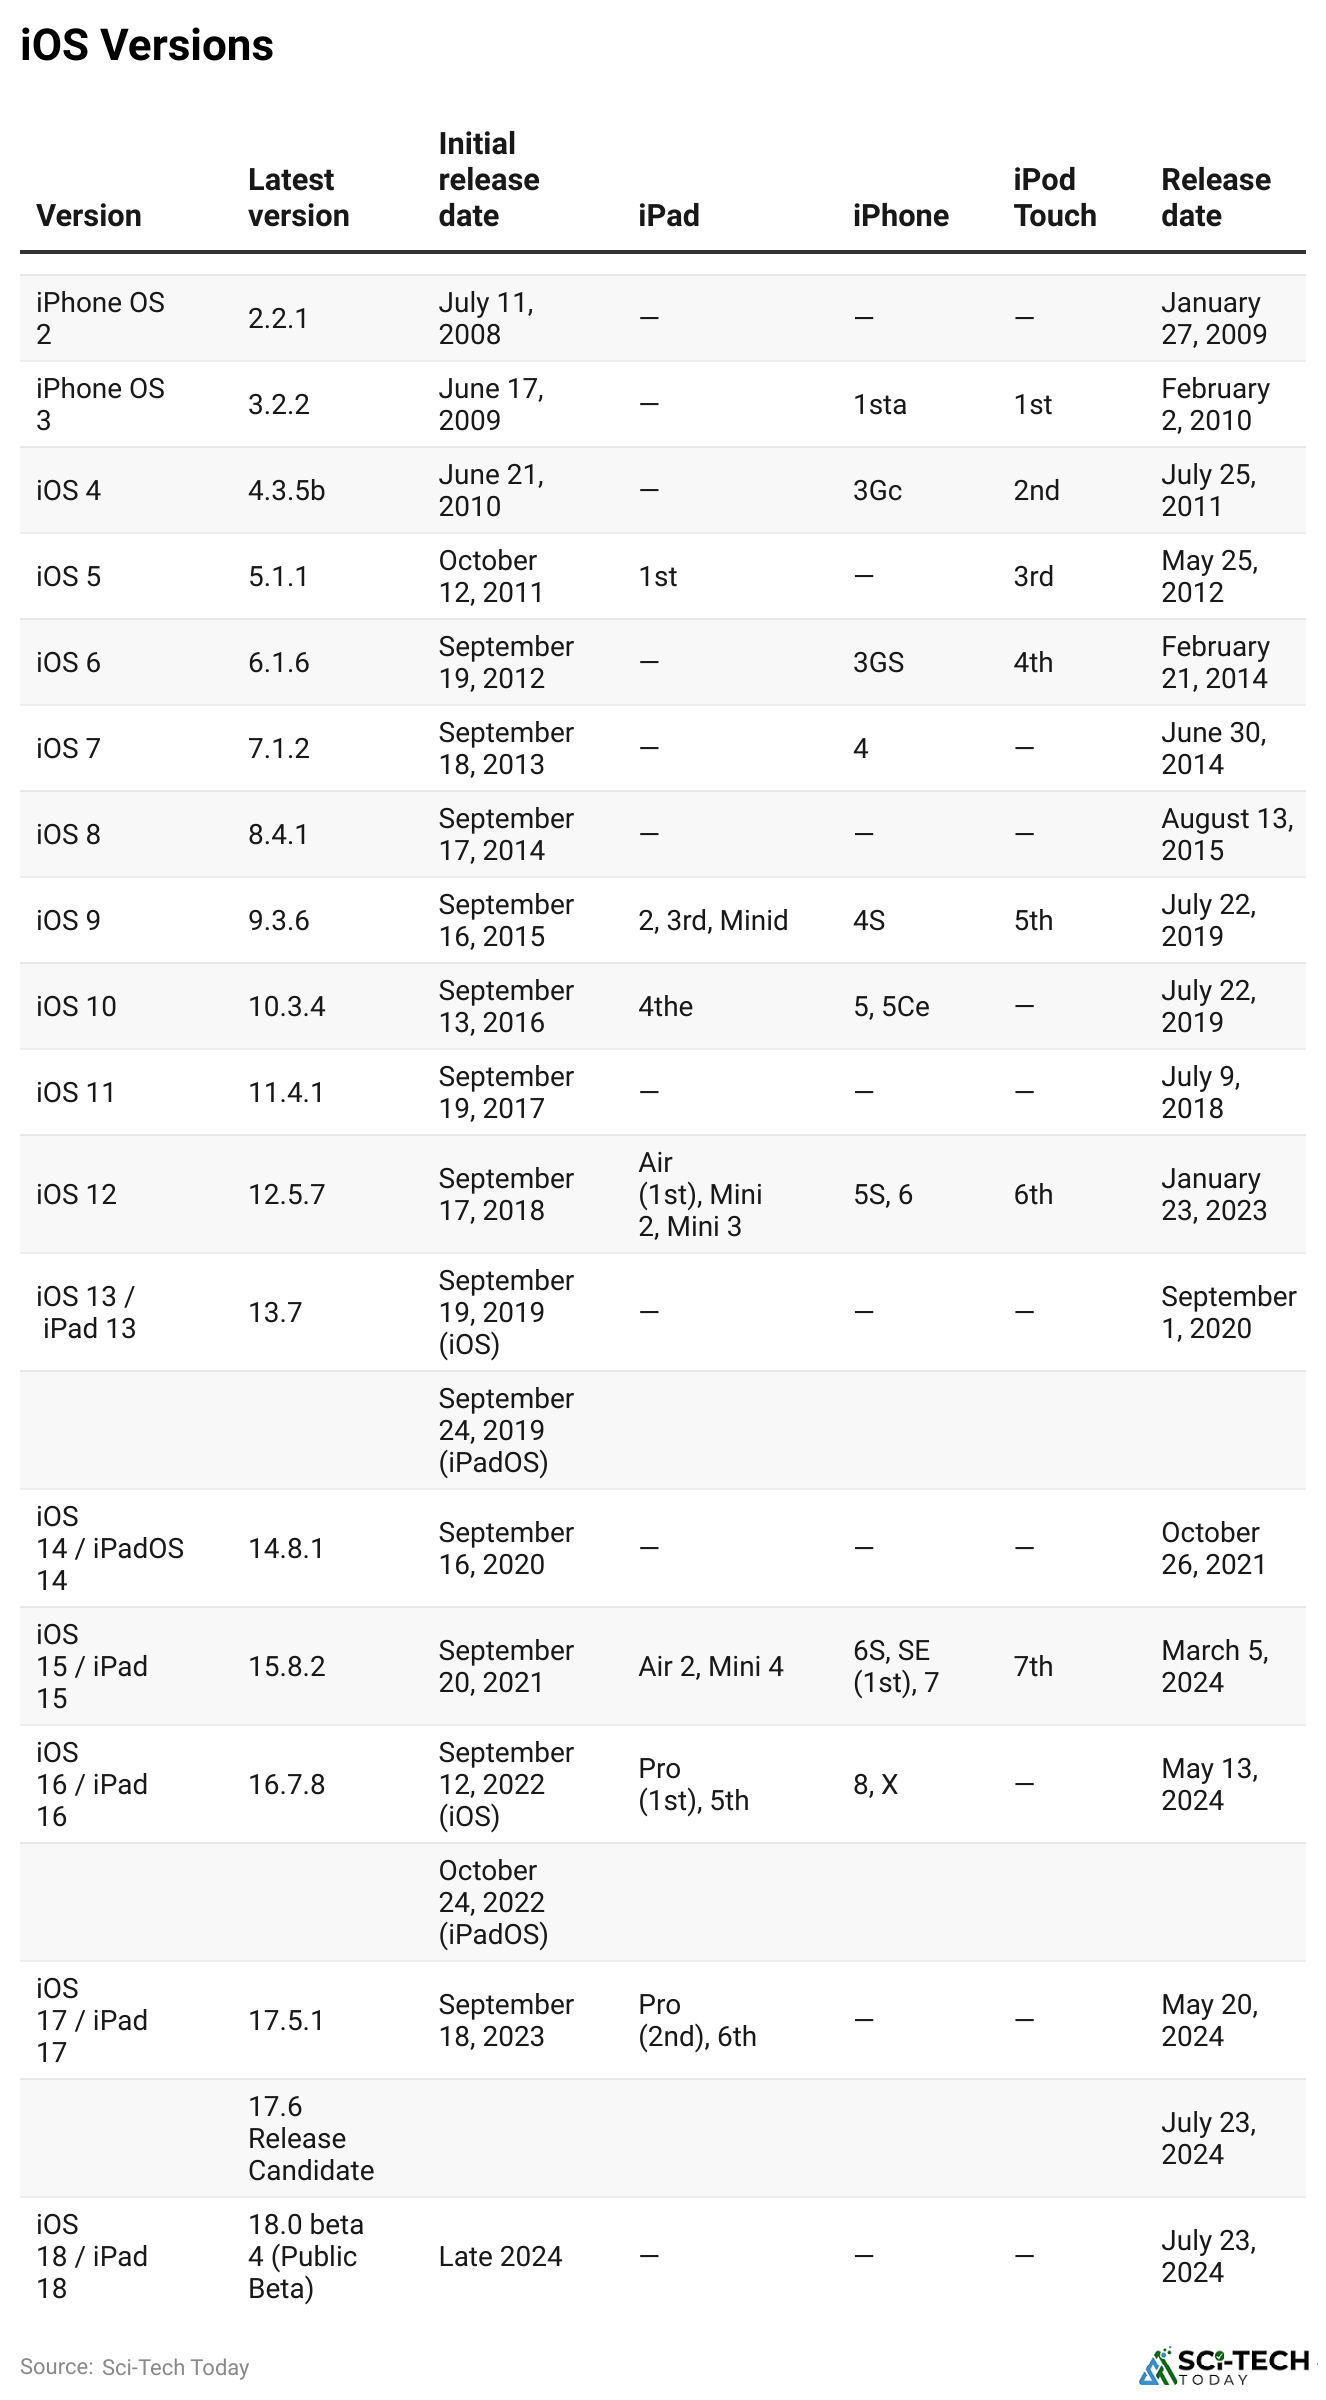
(Reference: wikipedia.org)
iPhone Vs Android Overview
iPhone Vs Android – Market Analysis for 2023 and 2024
#1. Market Share Overview
- In 2025, the global smartphone market saw a slight shift in market shares between iPhone and Android devices.
- According to recent iPhone vs Android statistics, Android maintained a dominant position with approximately 72.77% of the global market share, while iPhone held about 26.82%.
- This slight increase for the iPhone was attributed to the successful launch of the iPhone 14 series, which saw significant uptake in key markets such as the United States and Europe.
- For 2026, projections indicate that Android will continue to hold the majority share at around 72-75%, while iPhone is expected to increase its share to approximately 30%.
- This anticipated growth for the iPhone is fueled by the expected release of the iPhone 18 series, which is rumored to include groundbreaking features and improvements.
#2. Sales Figures and Revenue
- In 2025, total global smartphone shipments reached approximately 1.25 billion units, a 2% increase year over year.
- Out of these, Android devices accounted for about 950 million units, while iPhone sales were around 248 million units.
- For 2026, iPhone vs Android statistics project that total smartphone sales will grow to about 1.5 billion units. Android is expected to sell around 1.03 billion units, while iPhone sales are forecasted to reach around 1 billion units.
- The revenue from iPhone sales is projected to increase to approximately USD 215 billion, reflecting a strong demand for the new models. Android devices are expected to generate around USD 190 billion in revenue.
#3. Regional Market Analysis
- The competition between iPhone and Android varies significantly across different regions. In North America, iPhone holds a substantial lead with around 59% of the market share in 2025, while Android accounts for about 52%.
- This trend is expected to continue in 2026, with iPhone’s share increasing to 60% and Android’s share slightly decreasing to 49%.
- Android is the preferred platform in Europe, with about 66% of the market share in 2025, while iPhone holds around 33%. Projections for 2026 suggest a slight increase for iPhone to 35%, with Android’s share decreasing to 64%.
- In Asia, Android dominates with a significant 79% market share in 2025, while iPhone holds about 20%. This trend is likely to persist in 2026, with Android maintaining around 78% and iPhone increasing marginally to 21%.
#4. User Demographics and Preferences
- The user base for iPhone and Android differs in several aspects, including age, income level, and preferences.
- In 2025, iPhone vs Android statistics showed that iPhone users tended to be younger, with a significant portion falling within the 18-34 age bracket.
- Additionally, iPhone users generally had higher income levels, with many earning over USD 75,000 US dollars annually.
- This demographic trend is expected to continue in 2026, with iPhone appealing to younger, more affluent consumers.
- On the other hand, Android users were more diverse in age and income. The platform’s affordability and wide range of devices made it popular among middle-income and budget-conscious consumers.
- In 2025, a significant portion of Android users earned between USD 80,000 and USD 100,000 US dollars annually. This trend is expected to remain consistent in 2026.
#5. Technological Advancements and Innovations
- For 2026, the iPhone 18 series is expected to feature even more advanced technology, such as foldable displays, enhanced artificial intelligence capabilities, and improved sustainability measures. These anticipated innovations will likely drive further iPhone sales and market share growth.
- Android devices, particularly those from leading manufacturers like Samsung and Google, also introduced significant advancements in 2025.
- These included foldable screens, advanced 5G capabilities, and improved camera systems. For 2026, Android devices are expected to continue focusing on innovation, with new models featuring enhanced user interfaces, better battery performance, and advanced security features.
#6. App Ecosystem and Services
- The app ecosystems for iPhone and Android play a crucial role in their overall appeal and user experience.
- In 2025, iPhone vs. Android statistics showed that the Apple App Store generated approximately USD 117.6 billion in consumer spending/revenue, while the Google Play Store generated about USD 49.2 billion. This disparity is due to the higher spending power of iPhone users and the premium pricing of many iPhone apps.
- For 2026, the revenue from the Apple App Store is projected to increase to around USD 80 billion US dollars, while the Google Play Store is expected to generate about USD 120 billion US dollars.
- Both platforms are anticipated to continue expanding their app offerings, focusing on new and innovative services such as augmented reality (AR), virtual reality (VR), and advanced health and fitness applications.
#7. Consumer Satisfaction and Brand Loyalty
- Consumer satisfaction and brand loyalty are critical factors in the ongoing competition between iPhone and Android.
- In 2025, iPhone users reported higher levels of satisfaction, with approximately 89% expressing satisfaction with their devices.
- This high satisfaction rate is attributed to the seamless integration of hardware and software, superior customer service, and regular software updates.
- Android users also reported high satisfaction levels, with about 85% expressing satisfaction with their devices in 2025. The diversity of Android devices and the ability to customize the user experience were significant factors contributing to this satisfaction.
- For 2026, iPhone and Android are expected to maintain high consumer satisfaction levels. iPhone’s satisfaction rate is projected to remain around 89%, while Android’s will likely stay at approximately 85%.
- Brand loyalty is also anticipated to remain strong, with many consumers choosing to stay within their preferred ecosystem for future purchases.
#8. Environmental and Sustainability Initiatives
- Environmental sustainability has become a significant focus for both iPhone and Android manufacturers.
- In 2025, Apple continued its commitment to reducing its carbon footprint by using recycled materials in its devices and aiming for carbon neutrality by 2030.
- These efforts have been well-received by environmentally conscious consumers and have positively impacted the iPhone’s brand image.
- Android manufacturers, including Samsung and Google, also made strides in sustainability in 2025.
- These companies implemented initiatives such as using eco-friendly materials, reducing plastic packaging, and improving energy efficiency in their devices.
- For 2026, iPhone and Android manufacturers are expected to enhance their sustainability efforts, focusing on reducing e-waste and promoting device recycling programs.
#9. Competitive Landscape and Market Strategies
- The competitive landscape between iPhone and Android continues to evolve, with both platforms employing various strategies to gain market share.
- In 2025, Apple focused on premium pricing, exclusive features, and a strong brand image to attract and retain customers. This strategy proved successful, as evidenced by the iPhone’s market share and revenue increase.
- Android manufacturers, on the other hand, adopted a more diverse approach. Companies like Samsung, Xiaomi, and OnePlus offer a wide range of devices catering to different price segments, from budget to premium. This strategy helped Android maintain its dominant market share, particularly in emerging markets.
- For 2026, it is expected that the iPhone will continue to leverage its premium brand image and exclusive features to attract high-income consumers.
- Android manufacturers will likely focus on innovation, affordability, and expanding their presence in key markets such as India and Southeast Asia.
Summary
The competition between iPhone and Android remains intense, with both platforms striving to innovate and capture market share. In 2025, iPhone vs Android statistics showed that Android maintained its lead with a 72.77% market share, while iPhone held 26.82%. However, the iPhone’s revenue from sales was significantly higher due to its premium pricing strategy. Projections for 2026 suggest that the iPhone will increase its market share to 30%, while Android will continue to dominate with 72-75%.
Both the iPhone and Android have advanced technologically, introduced several features, and paid attention to user satisfaction and building up the brands’ reputation. Environmental sustainability is another area which is becoming increasingly crucial for both platforms in terms of reducing their carbon footprint and encouraging recycling. As a market researcher, I can state that the competition between the iPhone and Android will remain relevant in the years to come due to innovations and sustainable market strategies of both brands.
FAQ
An iPhone runs iOS and uses Apple’s ecosystem, giving it exclusive features like native iMessage, FaceTime, and MagSafe magnetic hardware integration. It also offers day-one global software updates and deep cross-device handoff with Mac and iPad that open-source Android cannot natively replicate across various third-party hardware brands.
People choose iPhones over Android devices for their seamless ecosystem integration, long-lasting hardware and software support, high resale value, superior social media app optimization, and an easy-to-use interface that lacks carrier bloatware.
Yes, Android is generally cheaper than an iPhone because Android has a much wider range of budget and mid-range options, whereas Apple mainly sells higher-priced phones. You can buy a basic, working Android phone for under USD 100, while entry-level new iPhones usually start at USD 599.