





Starter
Facebook vs Instagram vs Twitter Statistics: We all spend time on social media every day, but have you ever thought about which app works best for you? Whether you’re running a business, creating content, or want to keep in touch and stay updated, picking the right platform makes a big difference. Facebook, Instagram, and Twitter (now known as X) all have distinct features, user types, and benefits.
Knowing how each one works can help you save time and even make more money. In this guide, “Facebook vs Instagram vs Twitter – Which is Better?”, we’ll look at what each platform does well, who uses them, and how they can help you reach your goals so you can decide which one fits your needs best.
Top Selections By The Editor
- There are almost 8.1 billion people on the planet, of whom about 3.07 billion people use Facebook at least one time per month as of 2025.
- 42% of people report using Twitter, compared to 6% in the 65-and-older age bracket.
- As of 2025, Facebook remains the #1 social media site, with 3.07 billion monthly users. WhatsApp takes 2nd place with about 3.0 billion users each month, while YouTube is close behind with around 2.7 billion monthly users.
Basic Difference Between Facebook, X, and Instagram
| Features | |||
|
Privacy Settings | Private/Public profiles, customizable settings | Private/Public accounts, close friends features | Mostly public, but has a private message. |
| Post Lifespan | Remains on Profile, long-lasting | Longer than Snapchat, Feeds refresh quickly |
Tweets get buried quickly, fast-moving |
|
Monetization | In-stream videos, Advertisements, and branded content | Influencer sponsorship, Instagram Shopping | Advertisement revenue sharing, subscription model |
| Algorithm focus | Prioritizes personal connections and engagement-based. | Engagement is driven, visual first |
Trending Topics, Real-time updates |
|
Best for | Long-form content, networking, and community-building | Brand visibility, product showcasing, influencer marketing | Public Engagement, industry trends, real-time updates |
| Advertising Options | Marketplace, Business pages, Facebook Advertisements | Influencer collaborations, Shopping, Instagram advertising |
Trending advertisements, promoted tweets |
|
Engagement features | Comments, Shares, Groups, Pages, and Likes | Reels, Stories, Shares, Comments, and Likes | Retweets or reposts, Likes, Replies, and trending topics |
| Target Audience | Professionals, Businesses, All age groups | Visual-centric users, younger audience (18 to 34 years) |
Trends followers, Professionals, News-savvy |
|
Content-Type | Live streaming, Events, Videotexts, Texts, and Images | Stories, Reels, Videos, and Reels | Images, Posts, GIFs, Videos, Short Text |
| Primary Use | Brand marketing, Community Building, and Social networking | Video sharing, influencer marketing, and Photo and video | Discussions, real-time updates, microblogging |
Facebook vs Instagram vs X User Statistics
#1. Facebook
- According to the latest update from Meta, Facebook has approximately 3.07 billion monthly active users (MAUs). This means nearly 3.07 billion people log into Facebook at least once a month using either a phone app or a web browser.
- As of 2025, out of those users, 2.4 billion people go on Facebook every day. That’s 68.85% of the monthly users logging in daily on their phones or computers. This daily number grew by 7% compared to the same time last year.

(Source: reliablesoft.net)
- In the above chart, we can see the Facebook Monthly Active Users (MAU).
- In 2024, daily users (DAUs) are almost 2.2 billion (about 68.85% of all monthly users).
- Approximately 56.76% of internet users worldwide use Facebook every month.
- 22% of the entire global population logs in to Facebook at least once a month.
- 31% of all people on Earth go on Facebook daily.
- Approximately 39.07% of active internet users check Facebook daily.
- 5% of users access Facebook using a mobile phone.
- According to Meta’s Annual Reports, the growth rate of Facebook DAU is 6% annually.
| Year | Daily Active Users (DAUs) in Millions | Growth rate (as compared to the previous rate) |
| 2025 | 2,400 (estimated) | 7% |
| 2024 | 2,236 (estimated) | 6% (estimated) |
| 2023 | 2,110 | 6% |
| 2022 | 2,000 | 4% |
| 2021 | 1,929 | 8% |
#2. Instagram
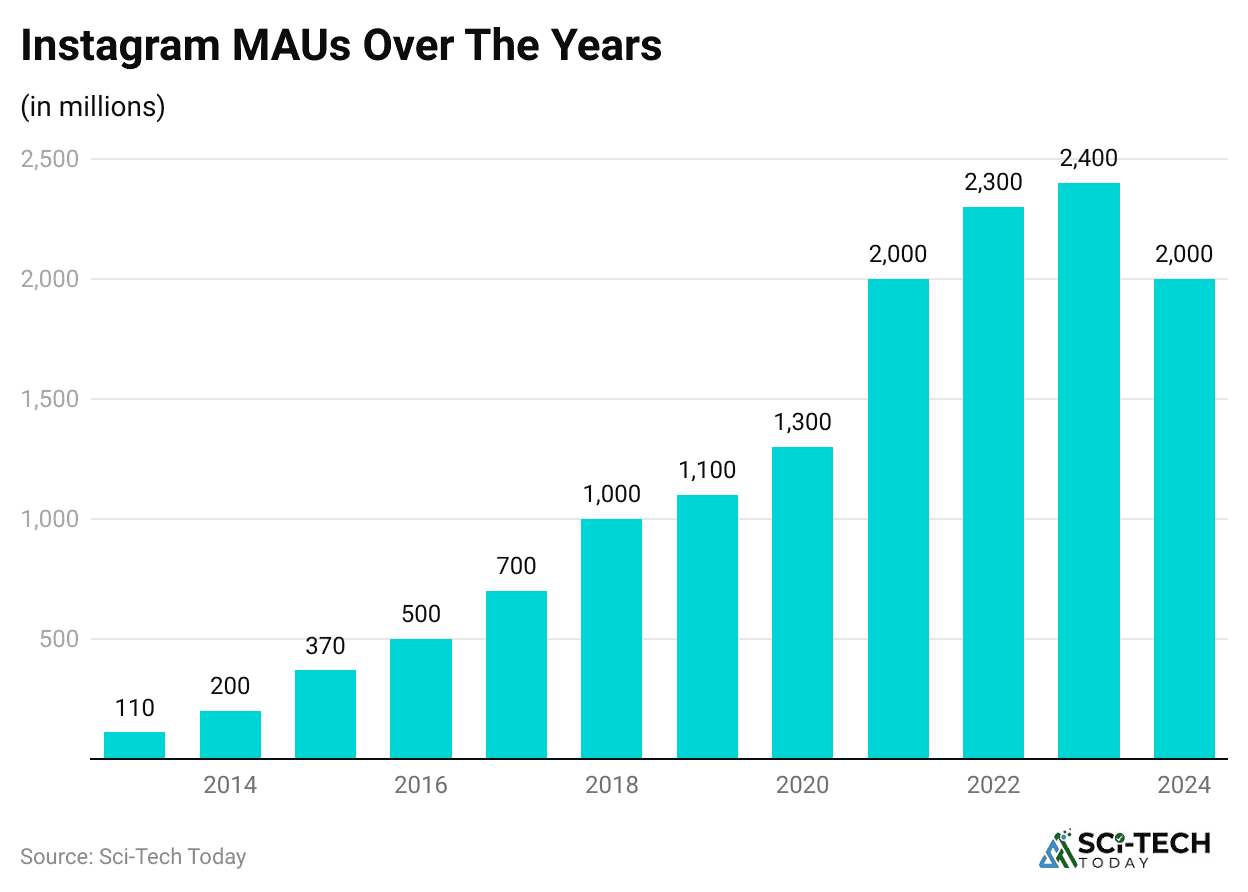
- By 2025, Instagram is expected to have more than 2 billion active users, which represents around 37% of all internet users worldwide. The platform continues to improve with the addition of new features, making the app easier and more enjoyable to use.
- In 2024, the platform experienced a slight decline. Instagram lost about 4 million users compared to the year before. In 2023, it had approximately 2.4 billion monthly active users worldwide.
(Reference: demandsage.com)
| Year | Instagram Monthly Active Users |
|
2013 | 110 million |
| 2014 |
200 million |
|
2015 | 370 million |
| 2016 |
500 million |
|
2017 | 700 million |
| 2018 |
1 billion |
|
2019 | 1.1 billion |
| 2020 |
1.3 billion |
|
2021 | 2 billion |
| 2022 |
2.3 billion |
|
2023 | 2.4 billion |
| 2024 |
2 billion |
- Every day, over 500 million people from around the world use Instagram.
- Most of them open the app to share pictures, upload videos, or check out what others are posting.
- Around 38.7% of all social media users are active on Instagram.
- Nearly 36.7% of the world’s 5.45 billion internet users visit Instagram at least once a month.
- When Meta (formerly Facebook) bought Instagram for USD 1 billion, the platform had only 30 million monthly users at that time.
#3. X (Twitter)
- In early 2025, X (formerly Twitter) is estimated to have around 650 million monthly active users (MAUs) worldwide, up from the 580 million figure cited in 2024.
- A statement from X’s leadership and third‑party estimates place MAUs in the 640 million range, with many analysts converging around 600 million monthly users in 2025.
- Some independent analytics still put the regularly active user base lower, at 385 million “core” monthly users, depending on methodology and whether ad‑reach or logged‑in users are counted.
- In the U.S., about 68 million people use X at least once a month in 2025.
- The company and external trackers now commonly cite roughly 300 million daily active users (DAUs) worldwide in 2025
Facebook vs Instagram vs X Demographics Statistics
#1. Facebook
(Reference: statista.com)
| Age Group | Female | Male |
|
18-24 | 9.1% | 12.7% |
| 25-34 | 12.7% |
18.5% |
|
35-44 | 8.7% | 11.7% |
| 45-54 | 5.7% |
6.6% |
|
55-64 | 3.9% | 4% |
| 65+ | 3.4% |
3% |
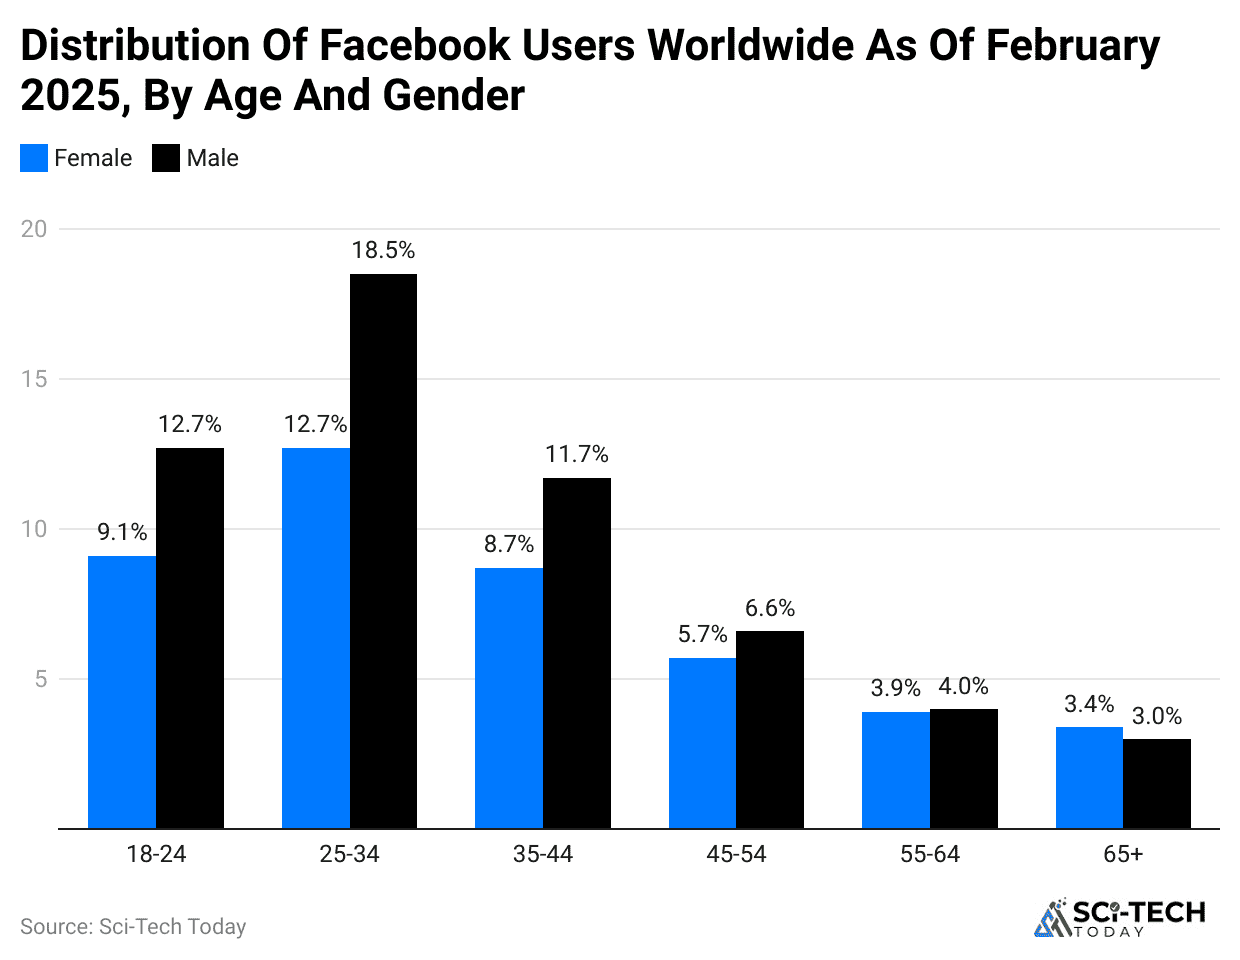
- By February 2025, the largest group of Facebook users was men aged 25 to 34, making up about 18.5% of Facebook’s global audience. The second biggest group was men between 18 and 24 years old.
#2. Instagram
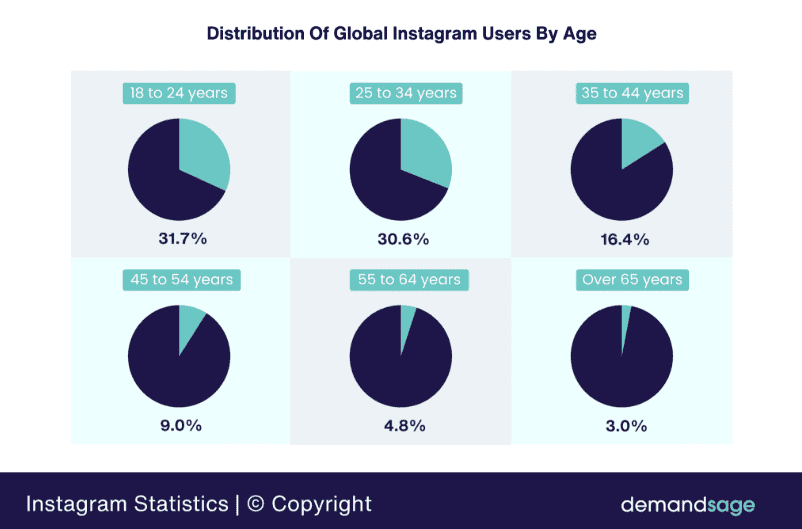
- More than half of those who use Instagram in the USA and globally belong to the 18-34 year-old age group.
- The gender split differs based on location, but the fact remains that the bulk of Instagram’s users are definitely young.
Here’s the breakdown:
- 3% of users are between 18 and 24
- 0% are between 25 and 34
- That means 62.3% of Instagram’s total users are between 18 and 34 years old, showing that most of the platform’s users are young adults.
(Source: demandsage.com)
- The following table shows the distribution of Instagram users by age:
| Year | % of Instagram Users Globally |
|
65 years and above | 3.0% |
| 55 to 64 years |
4.8% |
|
45 to 54 years | 9.0% |
| 35 to 44 years |
16.4% |
|
25 to 34 years | 30.6% |
| 18 to 24 years |
31.7% |
- In the U.S., 28.3% of Instagram users are between the ages of 25 and 34, and 26.5% are between 18 and 24.
- That means more than half (54.8%) of Instagram’s U.S. audience is made up of people aged 18 to 34, clearly showing the platform is most popular with young adults.
Other groups include:
- 4% are in the 35–44 age range
- Just 5.8% of users are 65 and older
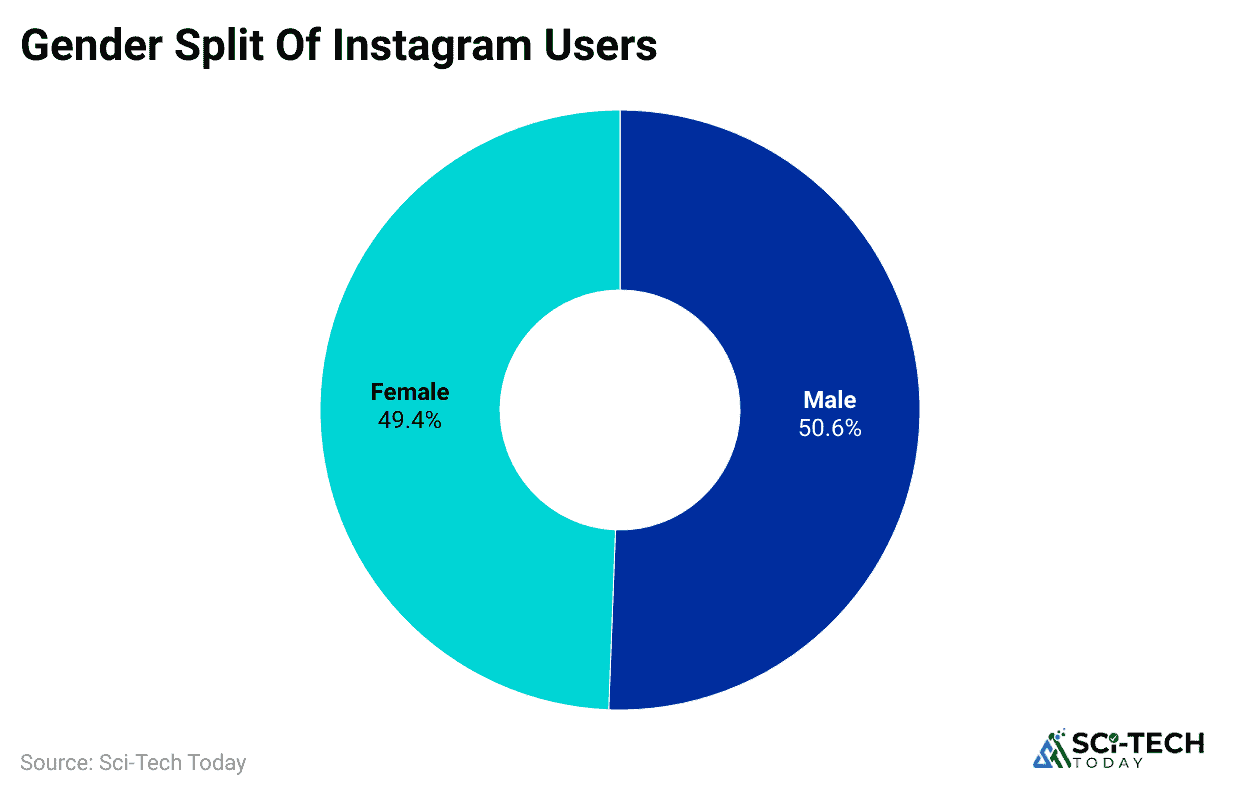
(Reference: demandsage.com)
| Gender | Share of users |
|
Male | 50.6% |
| Female |
49.4% |
#3. X
- 9% of X users are male, and 39.1 % are female.
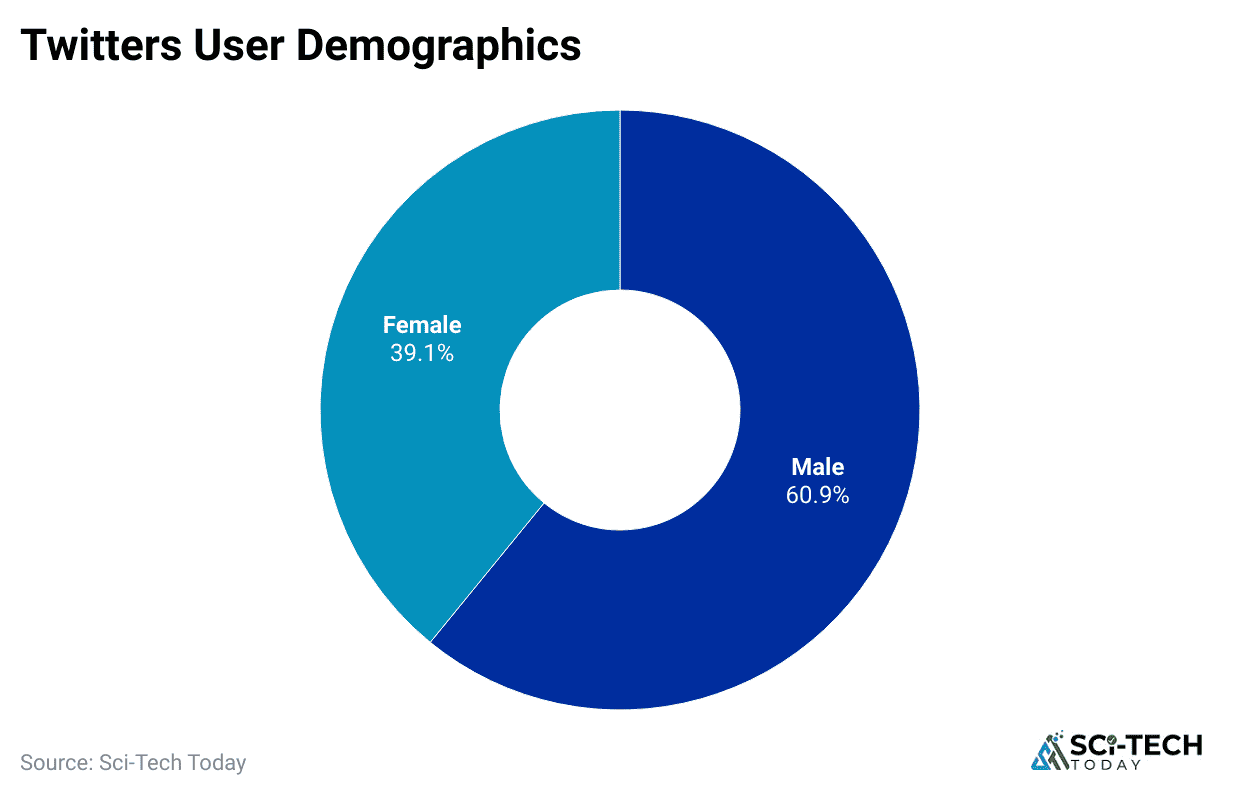
(Reference: demandsage.com)
- Approximately 36.6% of X users are between the ages of 25 and 34.
- People between 13 and 17 years old make up almost 2.4% of the X user base.
- The following table shows the distribution of the age of the X users by age group:
| Age Group | Share of Users |
|
Over 50 | 7% |
| 35-49 |
19.7% |
|
25-34 | 36.6% |
| 18-24 |
34.2% |
|
13-17 |
2.4% |
Facebook vs Instagram vs X Revenue Statistics
#1. Facebook
- Facebook’s Annual Revenue grew by 22.2% in 2025 to about USD 201.0 billion.
- Facebook’s Annual Revenue grew by 21.9% in 2024 to USD 164.5 billion.
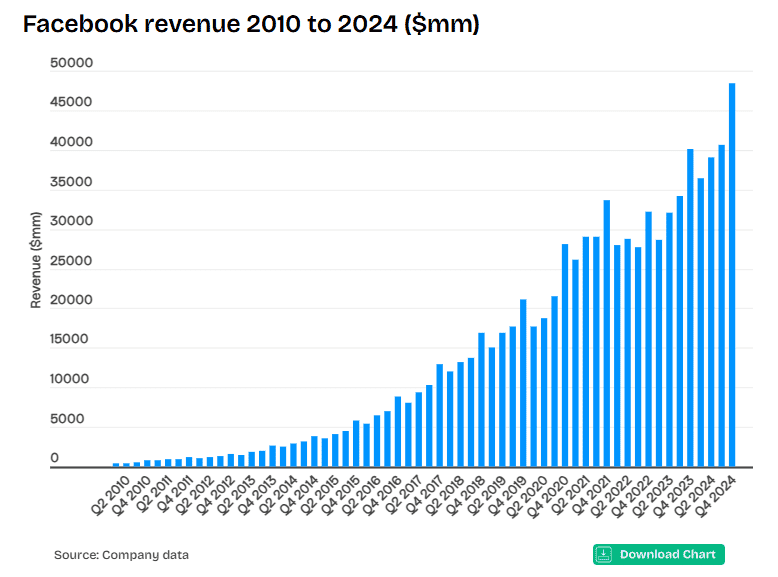
(Source: businessofapps.com)
| Year | Revenue (USD) |
| 2025 | 201.00 |
| 2024 | 164.50 |
| 2023 | 134.90 |
| 2022 | 116.60 |
| 2021 | 117.92 |
| 2020 | 85.96 |
| 2019 | 70.69 |
| 2018 | 55.83 |
| 2017 | 40.65 |
| 2016 | 27.63 |
| 2015 | 17.92 |
| 2014 | 12.46 |
| 2013 | 7.87 |
| 2012 | 5.08 |
| 2011 | 3.71 |
| 2010 | 1.97 |
- Almost around 44% of Facebook’s revenue still comes from North America in 2025, with solid growth across all regions.
- Almost 43.7% of Facebook’s revenue comes from North America, with growth across all regions in 2024.
| Year | Canada & US | Europe | Asia-Pacific | Rest of World |
|
2024 | 72 | 38.7 | 32.8 | 20.8 |
| 2023 | 61.2 | 30.8 | 26.9 |
15.8 |
|
2022 | 54.5 | 25.7 | 23.4 | 12.7 |
| 2021 | 51.5 | 29 | 26.7 |
10.5 |
|
2020 | 40.5 | 20.4 | 15.4 | 7.6 |
| 2019 | 33.4 | 16.7 | 12.5 |
6.8 |
|
2018 | 26.4 | 13.5 | 9.5 | 5.4 |
| 2017 | 19.4 | 9.7 | 6.7 |
4 |
|
2016 | 12.9 | 6.2 | 4 | 2.4 |
| 2015 | 7.2 | 3.4 | 2.3 |
1.5 |
#2. Instagram
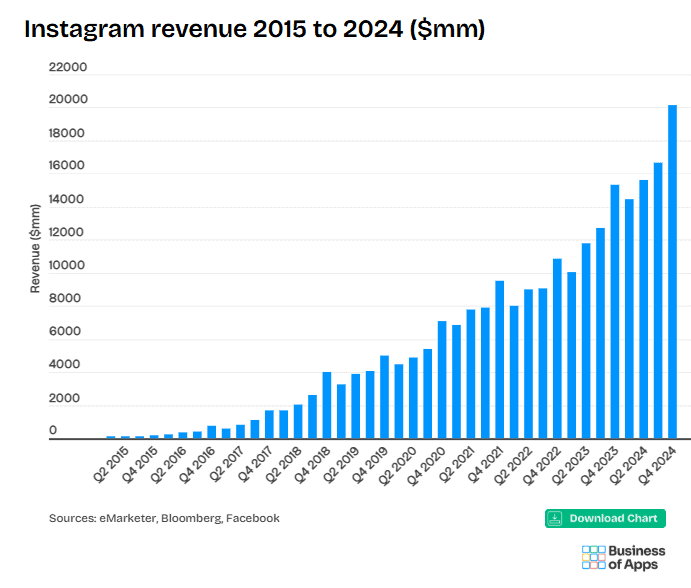
(Reference: businessofapps.com)
| Year | Revenue (billion) |
|
2024 | 66.9 |
| 2023 |
49.8 |
|
2022 | 36.9 |
| 2021 |
32 |
|
2020 | 21.8 |
| 2019 |
16.2 |
|
2018 | 10.3 |
| 2017 |
4.1 |
|
2016 | 1.8 |
| 2015 |
0.5 |
#3. Twitter
- In 2025, X (formerly Twitter) is estimated to report around USD 2.26 billion in advertising revenue and total annual revenue of roughly USD 4 billion.
- With quarterly operating costs still in the hundreds of millions of dollars range rather than a specific USD 744 million/Q1 number.
- In Q1 2024, X reported a total cost of USD 744 million.
- This also included the Q1 and USD 339 million from Q2.
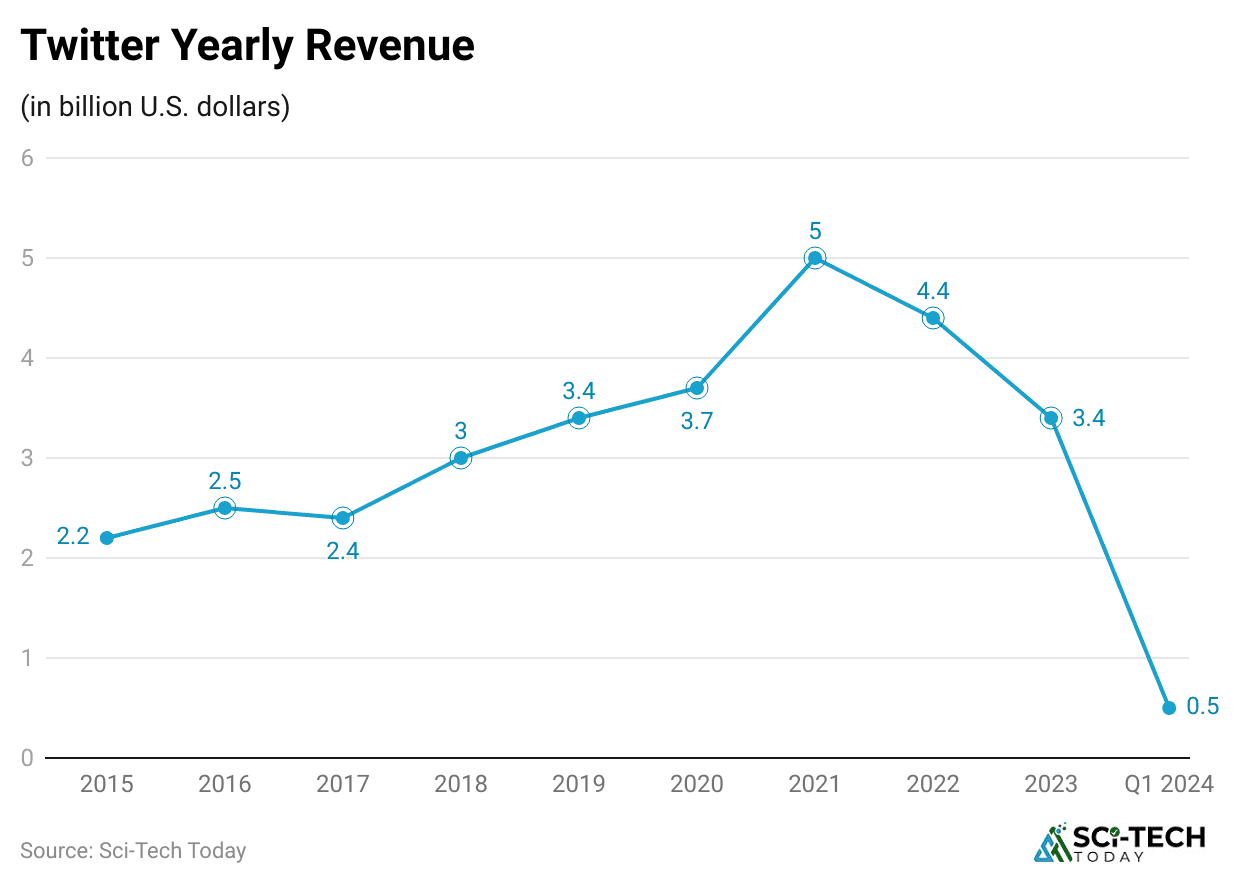
(Reference: demandsage.com)
- The above chart shows the revenue generated by X over the years.
| Year | X Revenue |
| 2015 | 2.2 billion |
| 2016 | 2.5 billion |
| 2017 | 2.4 billion |
| 2018 | 3 billion |
| 2019 | 3.4 billion |
| 2020 | 3.7 billion |
| 2021 | 5 billion |
| 2022 | 4.4 billion |
| 2023 | 3.4 billion |
| H1 2024 | 744 million |
| 2025 | 2.26 billion |
- The following table shows X’s Net Income and Loss over the years:
| Year | Net Income/Loss |
|
2013 | -USD645.32 million |
| 2014 |
-USD577.82 million |
|
2015 | -USD521.03 million |
| 2016 |
-USD456.87 million |
|
2017 |
-USD108.06 million |
|
2018 |
+USD1,205.6 million |
|
2019 | +USD1,465.66 million |
| 2020 |
-USD1,135.63 million |
|
2021 | -USD221.41 million |
| 2022 |
+USD876.61 million |
|
2023 | +USD469.73 million |
| 2024 |
+USD904.17 million |
Facebook vs Instagram vs X Advertising Statistics
#1. Facebook
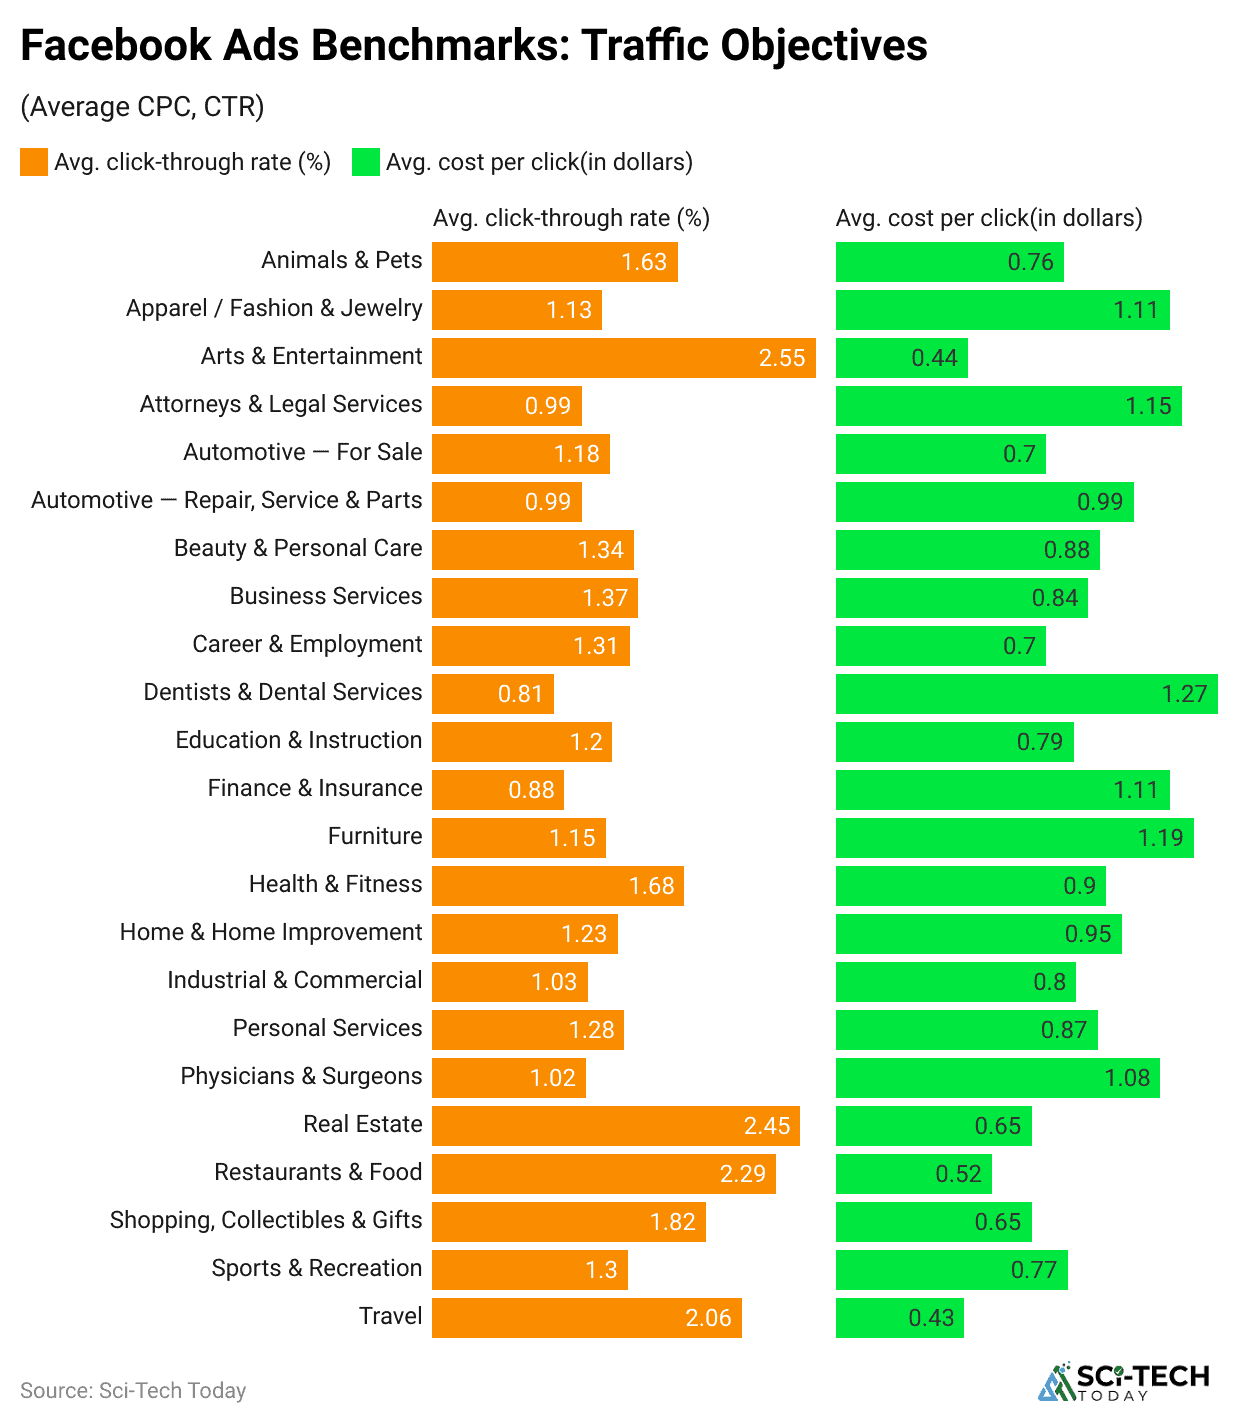
- According to Word Stream, Facebook ads designed to collect leads typically receive clicks at a rate of about 2.5% across various business types. In comparison, ads that aim to boost website visits have a slightly lower click rate of around 1.51%.
- On average, companies spend about USD 0.83 per click for traffic ads, while lead generation ads cost about USD 1.92 per click, depending on the industry.
(Reference: keywordseverywhere.com)
- Facebook ads work well, with an average conversion rate of 8.25%. This means that approximately 8 out of every 100 people who see the ad will take action, such as making a purchase or signing up for a service.
- By 2025, businesses using Facebook ads can reach about 2.28 billion people worldwide.
- By 2024, businesses using Facebook ads could reach as many as 1.98 billion people worldwide.
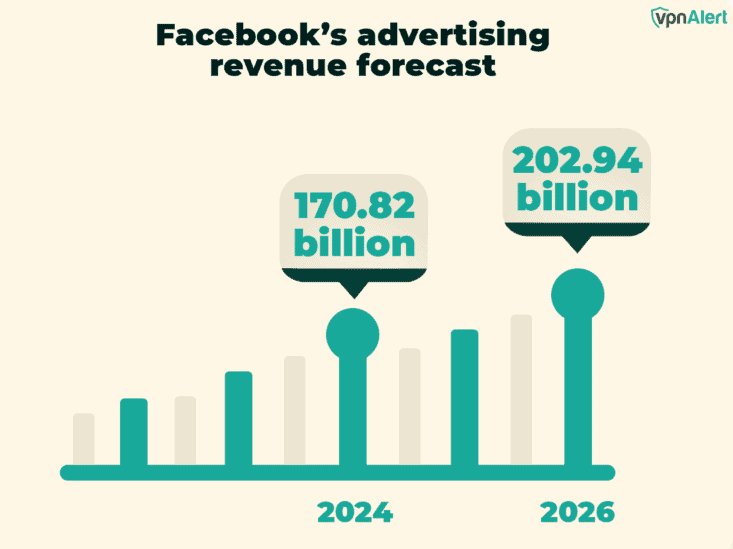
- In 2024, Facebook generated approximately USD 164.5 billion from ads and other sources of revenue. Experts believe this number will continue to grow, with total revenue expected to reach approximately USD 200.97 billion by 2025.
(Source: keywordseverywhere.com)
- Around 93% of marketers who use social media rely on Facebook Ads to promote their brands and connect with their target audience.
- Data shows that Wednesdays and Thursdays between 11 a.m. and 2 p.m. are the busiest times on Facebook, making them the most effective hours to reach your target audience.
- When it comes to ad performance, both Facebook and Instagram offer businesses a strong return, with an average ROI of 29% for each platform.
#2. Instagram
- Feed ads bring in the largest chunk of Instagram’s ad income.
- According to eMarketer, these ads made up 52% of Instagram’s total ad revenue in 2025.
- Story ads came in second, making up 24.6% of the total earnings. However, this is expected to decline as Reels continue to grow at a slow pace.
- By 2025, the combined share of ad revenue from Feed and Stories will fall to 73.8%, giving more room for Reels to earn more.
- Instagram ad prices are comparable to those of other top platforms, such as Facebook.
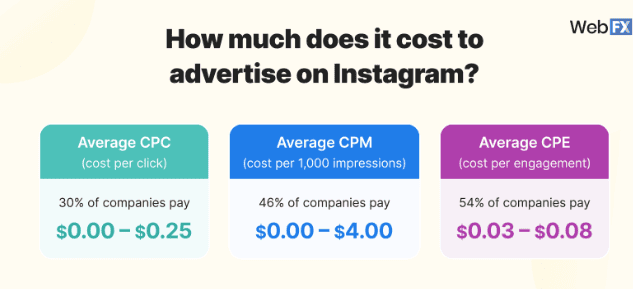
- Based on a survey by WebFX, the average cost-per-click (CPC) for Instagram ads ranges from USD 0.00 to USD 0.25.
- For views, about 46% of brands pay between USD 0.00 and USD 4.00 CPM (cost per 1,000 views). If you’re aiming for user interaction, the cost-per-engagement (CPE) is typically between USD 0.03 and USD 0.08.
(Source: sproutsocial.com)
- Instagram ad conversion rates depend on your campaign goal. On average, businesses see a 1%–2% conversion rate, according to Drift Lead. Top campaigns can even go beyond 3%.
Here’s a simple breakdown of the average conversion rates based on different goals:
- Brand awareness: 0.5% to 1%
- Reach: 0.8% to 3%
- Website traffic: 0% to 2%
- Post engagement: 0% to 3%
- App downloads: 1.5% to 8%
- Video views: 1.2% to 5%
- Lead generation: 3% to 5%
- Sales/conversions: 0% to 3%
- Product catalogue sales: 3.5% to 5%
- Store visits: 1.5% to 5%
#3. X
- In 2024, X (formerly Twitter) generated around USD 3.14 billion from ads, representing a 5% decrease from the previous year.
- In 2025, ad earnings are expected to decline by 4.8%, resulting in total revenue of approximately USD 2.99 billion.
- The platform offers advertisers the chance to reach up to 586 million people.
- The cost per first action typically ranges from USD 0.26 to USD 1.50.
- Most businesses spend between USD 101 and USD 500 monthly on X ads.
- X stands out as the only major social platform that permits cannabis advertising.
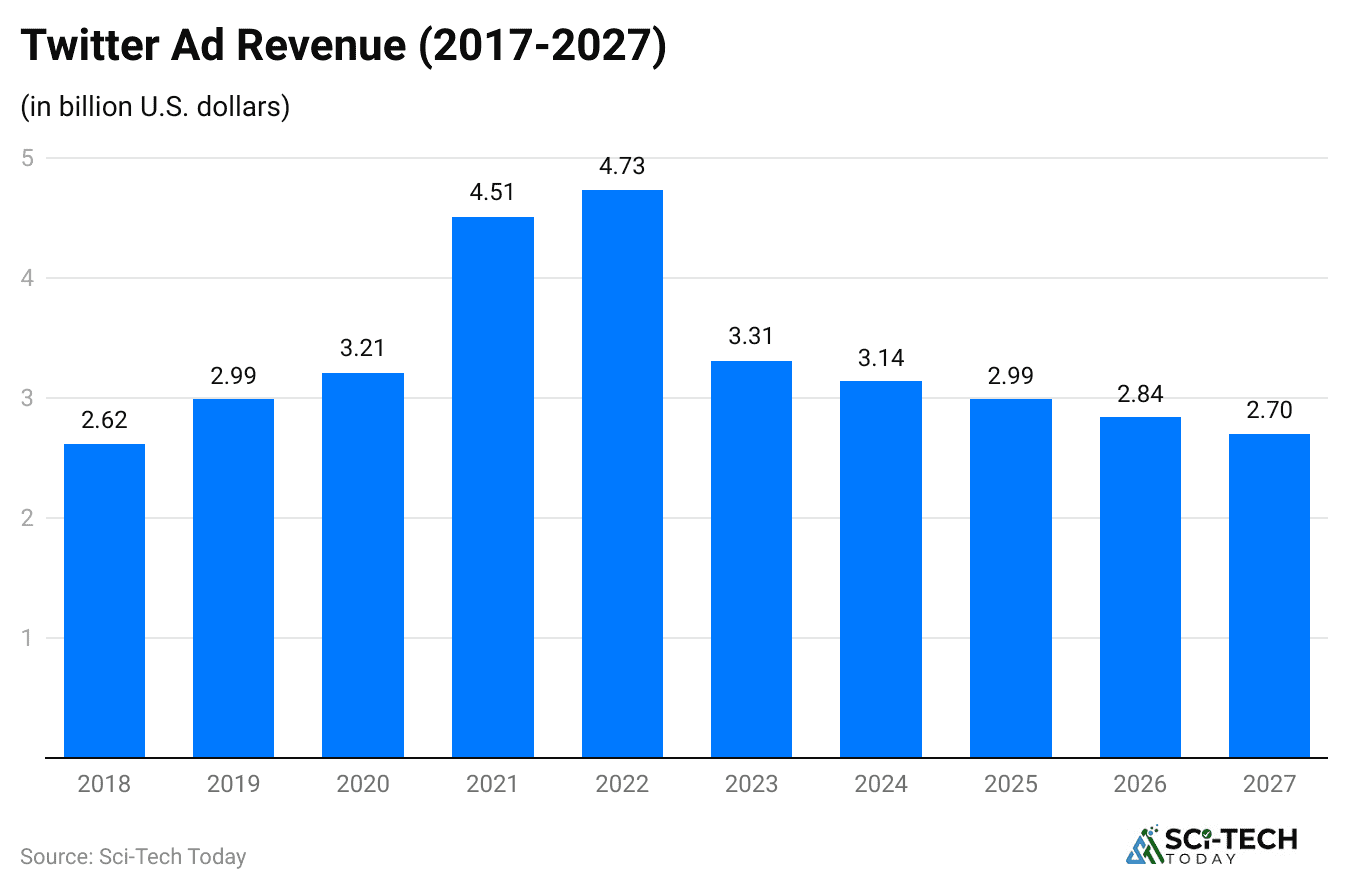
(Reference: sproutsocial.com)
| Year | Twitter Ad Revenue Worldwide (billion USD) |
|
2017 | USD 2.11 |
| 2018 |
USD 2.62 |
|
2019 | USD 2.99 |
| 2020 |
USD 3.21 |
|
2021 | USD 4.51 |
| 2022 |
USD 4.73 |
|
2023 | USD 3.31 |
| 2024 |
USD3.14 |
|
2025 | USD2.99 |
| 2026 |
USD2.84 |
|
2027 |
USD2.70 |
- According to DataReportal, the platform has approximately 586 million monetizable monthly users, providing brands with a significant opportunity to connect with a vast audience through smart targeting.
- One major reason advertisers still use X is because of its low-cost ad options.
- A report by WebFX states that promoted posts on X typically cost between USD 0.26 and USD 1.50 per action, with approximately 54% of businesses falling within this range.
- Additionally, around 53% of companies spend between USD 101 and USD 500 per month on ads, which helps them stay within their budgets.
Facebook vs Instagram vs X Engagement Statistics
#1. Facebook
- Based on a report by RivalIQ, most brands get a 0.063% engagement rate on Facebook. This makes Facebook one of the least engaging social media platforms just slightly ahead of X/Twitter, which only sees a 0.029% engagement rate.
- Even though Facebook Pages don’t get a lot of interactions overall, posts with images do better, with an average engagement of 0.8%.
- Link posts on Facebook Pages have the lowest Engagement, getting only 0.02% interaction, making them the least effective type of post for user response.
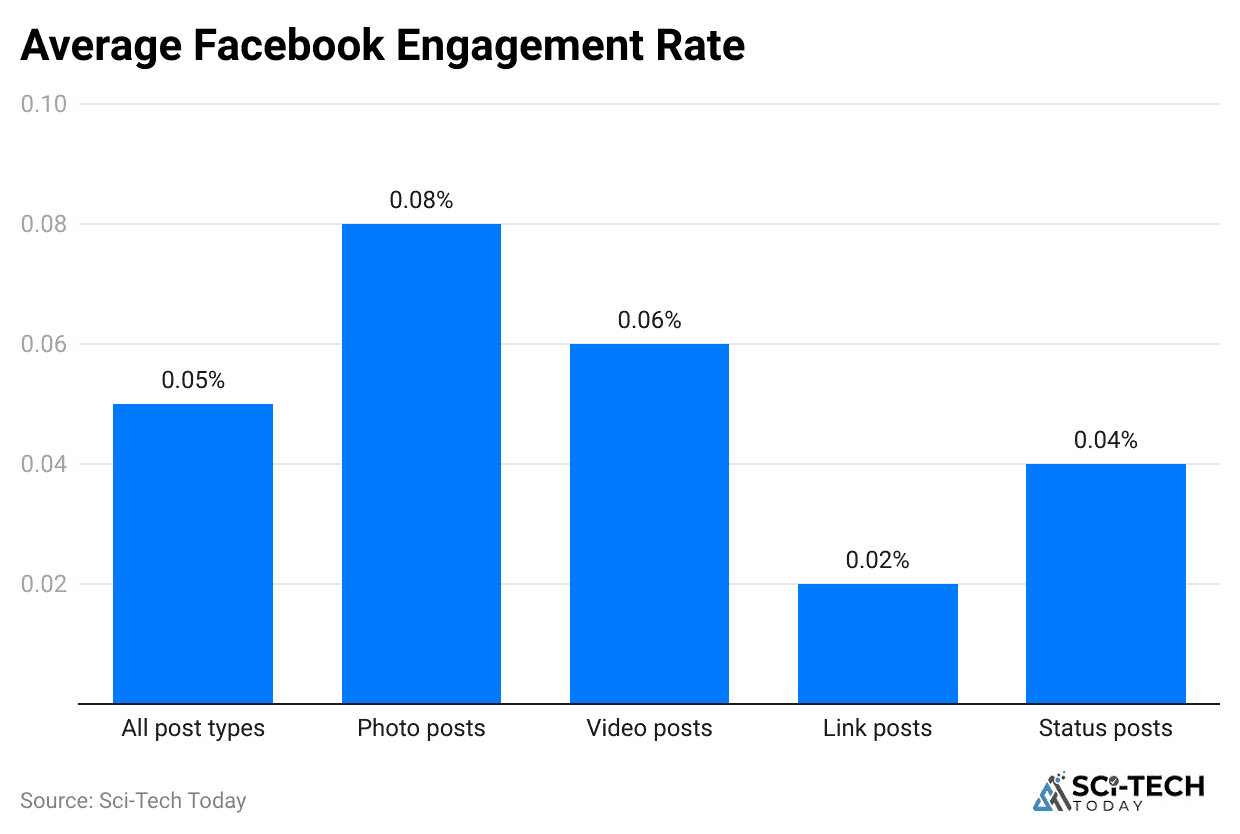
(Reference: keywordseverywhere.com)
| Types | Average Facebook Engagement Rate |
|
All post types | 0.05% |
| Photo posts |
0.08% |
|
Video posts | 0.06% |
| Link posts |
0.02% |
|
Status posts |
0.04% |
- In contrast, media outlets post more than 60 times a week, yet they only see an average engagement rate of 0.04%.
#2. Instagram
Instagram Reach by Industry:
- Creators have the biggest audience reach on Instagram at 32.6%.
- Travel pages follow with a 21.4% reach.
- Sports accounts reach about 19.7% of users.
Engagement by Industry:
- Education pages get the most Engagement at 8.4%.
- Travel and healthcare brands come next with 7.9%.
- Retail brands have an average engagement of 7.8%.
Best-Performing Content Types:
- Carousel posts (multi-slide content) see about 22.73% higher Engagement than videos or single photos.
- Carousels account for only 17.27% of posts but generate the most likes and comments.
- Videos reach 49% more users compared to still images.
Using Hashtags:
- Surprisingly, posts without hashtags reach 23% more people.
- Adding 2–3 well-chosen hashtags give your content a better chance of being found.
Caption Length Tips:
- Posts with captions longer than 300 characters get 70% more comments.
- The longer text encourages people to reply and join the conversation.
Tagging and Mentions:
- Tagging 4–5 collaborators in a post can boost reach by 3.8 times.
- Arts and entertainment pages mention others in 23.4% of their posts.
- Travel brands are next, with 20.2% of their posts including mentions.
Extra Insights:
- Posts with people’s faces perform almost 38% better than those without.
- Instagram videos get 21.2% more Engagement than images.
- Every month, around 2.35 billion users watch or interact with Reels, demonstrating the strength of video content on the app.
#3. X
- Global ad engagement on X (Twitter) went up by 35% in the past year.
- About 82% of marketers in B2B (business-to-business) use X to connect with their target audience.
- Around 79% of people on X follow brands.
- On average, businesses post 61 times per week, and each post gets up to 2,121 views.
- Entertainment and Media sector experiences the maximum natural (organic) engagement rate of 1.7%.
- Consumer Goods, Marketing, and Real Estate sectors experience the minimum engagement rate of 0.9%.
- A typical post (tweet) on X has an average engagement rate of 0.029%.
- Across all industries, the total average engagement rate on X is 2.8%.
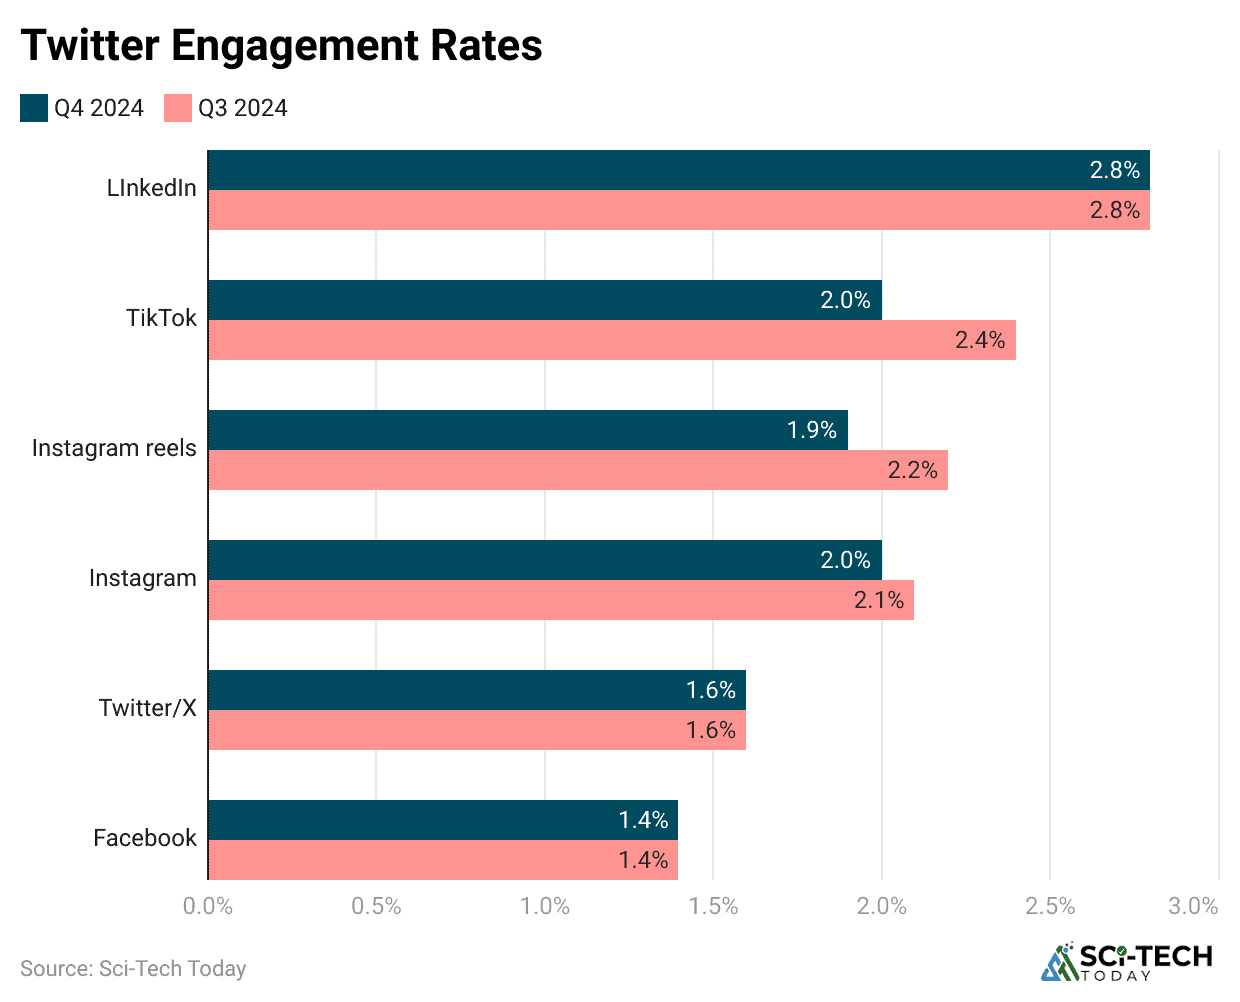
(Reference: socialpilot.com)
- To keep your X (Twitter) account active, posting at least 6 times per week is the minimum required for Engagement.
- The best time to post for more views and clicks is Tuesday between 3 a.m. and 6 a.m.
- X accounts typically experience a weekly follower growth rate of 0.11%.
- Video tweets get about 10× more Engagement than tweets with just text.
- Retweets make up 50% of all activity on the platform.
- Only 9.9% of influencer marketing campaigns include X in their strategy.
- Around 1% of tweets use the full character limit allowed.
- Users on X can post up to 2,400 times per day.
Facebook vs Instagram vs X Reels Statistics
#1. Facebook
- Entertainment is the top-performing category on Facebook Reels, making up 25% of total views. This is largely due to music clips, movie previews, and celebrity videos.
- Food and beverage content comes next, accounting for 15%, primarily featuring cooking tips and recipe videos.
- News and media content accounts for 12%, featuring short news updates and documentary-style videos.
- Beauty & fashion make up 10% of views through makeup tutorials and outfit ideas.
- Sports, gaming, and travel content get 8%, 7%, and 5% of views, thanks to highlights, walkthroughs, and travel clips.
Other types of content include:
#1. Online shopping (e-commerce) – 5% with product reviews and demos
#2. Technology – 4% with device reviews and how-to videos
#3. DIY and crafts – 3% with creative projects
#4. Education and pet videos – 2%, including short lessons and funny animal clips
- Finance, real estate, fitness, non-profits, self-growth, and cars each hold 1%, focusing on tips, tours, workouts, causes, motivation, and vehicle showcases
- 85% of people watch Reels on their phones, while 10% use desktops and 5% use tablets.
- The most-watched videos include MrBeast’s Squid Game, which has garnered 200 million views, and Khaby Lame’s Life hack videos, which have accumulated 150 million views.
- Accounts with over 50,000 followers had the best engagement rate 2.18%, while smaller pages saw lower results.
- Creators can earn up to USD 35,000 per month if their Reels get at least 1,000 views within 30 days.
- India leads in Reels viewership, accounting for 25% of traffic, followed by the U.S. (15%) and Brazil (10%).
| Industry | Estimated viewership | Niche |
|
Automotive | 1% | · Showcase of new cars highlighting the latest models and features · Driving experience reviews to share how the car feels on the road · Helpful car care advice to keep vehicles running smoothly · Inside, look at car factories showing how cars are made step by step · Creative car mods and design tips for people who like to personalize their vehicles |
| Personal Development | 1% | · Time-saving tips to boost your daily productivity· Personal growth ideas to help you improve yourself· Encouraging sayings to keep you inspired· Easy mindfulness activities for peace and focus· Job advice to help you succeed in your career· Suggestions for healthy relationships with friends, family, or partners |
|
Non-Profit Organizations | 1% | · Success stories that show how someone’s life changed because of support or donations · Volunteer highlights that shine a light on people giving their time to help others · Donation requests asking for USD to back a cause or project · Awareness efforts that share facts to inform people and spread the message · Action-driven posts that encourage followers to get involved or support the mission |
| Fitness and Sports | 1% | · Exercise plans to help people stay active and fit· Fitness competitions to motivate and push personal limits· Inspiring speeches that boost confidence and drive· Nutritious meal ideas for a healthy lifestyle · Training techniques and practice tips for different sports· Athletes experience sharing personal stories and journeys |
|
Real Estate | 1% | · Virtual home tours let you check out properties online without needing to visit in person. · Home styling tips help sellers make their houses look great and attract more buyers. · Neighborhood video previews show what it’s like to live in different areas. · Real estate updates share the latest trends and prices in the housing market. · Mortgage advice gives helpful tips on loans, interest rates, and how to save USD when buying a home. |
| Finance and Investing | 1% | · Smart investment ideas can help you grow your USD over time.· Money advice offers tips on how to save, spend wisely, and plan for the future.· Stock market news keeps you updated on price changes, trends, and what’s happening in the market.· Simple explanations of financial terms, such as interest rates, inflation, or return on investment, make finances easier to understand.· Budgeting advice helps you manage your money by tracking what you earn and spend, allowing you to save more and avoid debt. |
|
Pets and Animals | 2% | · Cute animal clips feature pets, including dogs, cats, and more, doing fun or endearing things.· Easy pet care tips to help you keep your animals healthy.· Funny pet moments that make people laugh and smile.· Feel-good stories about animals and their owners that warm your heart.· Rescue videos show how animals are saved and given new homes. |
|
Education | 2% | · Quick learning clips that teach something useful in just a few seconds. · Tips for learning new languages faster and remembering words better. · Fun and easy science activities you can try at home or school. · Cool facts from history that are short but meaningful · Study hacks that help students stay focused and improve grades. · Simple explainers that make hard subjects easier to understand. |
| DIY and Crafts | 3% | · DIY project guides that show you how to build or create things step by step.· Craft how-to videos that teach simple ways to make handmade items.· Home décor ideas to help you improve your space without spending too much.· Smart tips and tricks to make everyday tasks faster and easier.· Upcycling ideas that turn old or used items into something new and useful.· Creative art showcases that feature paintings, drawings, or crafts. |
|
Technology | 4% | · New tech launches that introduce the latest gadgets, apps, or software tools. · Technology reviews that give honest feedback on how well new products work. · Step-by-step software guides to help users learn how to use different programs easily. · App walkthroughs that show how apps function and what features they offer. · Unboxing clips that display what’s inside tech packages as they’re opened. · Tech explainers simplify complex topics so more people can understand them. |
| E-commerce | 5% | · Product demos show how something works or what it can do.· Unboxing clips give a first look at what’s inside a package.· Styling ideas help customers learn how to use or wear an item in creative ways.· Customer feedback videos share real stories from buyers who tried the product.· Limited-time deals or special offers help boost sales and create excitement.· Behind-the-scenes footage offers a glimpse into how products are created or designed. |
|
Travel and Tourism | 5% | · Travel destination highlights show amazing places people can explore. · Travel video blogs (vlogs) share real-life travel stories and experiences. · Hotel overviews provide people with helpful information on room quality, pricing, and service. · Packing tips guide how to organize your belongings and what essentials to pack. · Cultural experiences include trying local cuisine, visiting landmarks, and participating in community events. · Adventure fun like hiking, surfing, or skydiving draws people who love excitement. |
| Gaming | 7% | · New game trailers give a sneak peek of upcoming video games before they hit the market.· Top gameplay moments show exciting, funny, or skillful parts of a game in short clips.· Game guides and walkthroughs provide step-by-step instructions on how to overcome challenging levels or complete missions.· Helpful gaming tips and tricks offer smart ways to win faster or level up quicker.· Live streaming sessions allow fans to watch gamers play in real-time, often with live chat included.· Esports recaps highlight the best moves and plays from competitive gaming events and tournaments. |
|
Sports | 8% | · The best game moments showcase exciting plays and top highlights from matches.· Chats with athletes share their goals, training habits, and personal journeys.· Workout sessions demonstrate how players become stronger and remain prepared for competition.· Behind-the-scenes videos give fans a closer look at team life, practice, and travel.· Fan reactions show real-time cheers, celebrations, and emotions during events.· Sports updates encompass major news, including trades, injuries, wins, and losses. |
|
Beauty and Fashion | 10% | · Makeup tutorials provide easy, step-by-step guides on how to apply various beauty products for everyday or special occasions.· Hair ideas show fun and stylish ways to do your hair — from curls and braids to quick updos.· Outfit inspiration helps people choose what to wear by showcasing clothing styles for work, parties, or casual occasions.· Product reviews share honest opinions about beauty and fashion products, helping shoppers know what’s worth their USD.· Runway clips showcase the latest fashion from top designers and brands, helping people stay up-to-date with the latest trends.· Style tips provide straightforward guidance on pairing clothes, selecting the right accessories, and dressing to complement your shape. |
| Publishing and Media | 12% | · Short news summaries give quick and easy-to-understand updates about important events around the world.· Mini documentaries tell real stories or explore big topics in just a few minutes.· How-it-works videos break down complicated ideas, such as science, money, or politics, so that anyone can understand them.· Interview clips feature people—such as stars, experts, or everyday individuals—sharing their views or stories.· Opinion videos let creators share their thoughts on trending topics or recent headlines. |
|
Food and Beverage | 15% | · Step-by-step recipes guide you through making tasty meals at home with ease.· Easy cooking lessons help people learn how to prepare a variety of dishes, from basic to advanced.· Food spot reviews give honest feedback on restaurant prices, food quality, and service—helping people decide where to eat.· Eating challenges are fun and involve extreme food tasks, such as trying super spicy dishes or finishing huge meals.· Smart kitchen tricks save time, effort, or money while cooking and prepping meals.· Visually appealing food focuses on meals that look delicious and beautiful—perfect for grabbing attention on social media. |
|
Entertainment | 25% | · Music videos show full songs or short clips from popular artists and bands.· Movie trailers provide a brief glimpse into upcoming films to get viewers excited.· TV show clips highlight the best or funniest scenes from popular shows.· Celebrity interviews feature stars sharing their stories, latest projects, or personal moments.· Comedy sketches are short, funny videos meant to make people laugh.· Behind-the-scenes videos give fans a glimpse into what happens off-camera, such as the creation of music, movies, or shows. |
#2. Instagram
- In 2025, the monthly active users of Instagram Reels exceeded 2 billion users, which shows that 100% of Instagram’s monthly users watch and engage in Reels.
- More than 200 billion Reels are viewed on a daily basis, both on Instagram and Facebook. This number has doubled compared to 100 billion views on a daily basis within a year.
- Accounts with 50k followers post 1 new Reel every 2 days. The short video clips have around 22% more engagement than normal videos.
- India’s freestyle footballer, Muhammed Riswan, holds the record for the most-watched Reel ever, with over 491 million views.
- Instagram is expected to have over 1 billion Reels by 2025.
- India has become the largest audience for Instagram Reels, with approximately 385.35 million users, surpassing the U.S. (166.15 million) and Brazil (135.05 million).
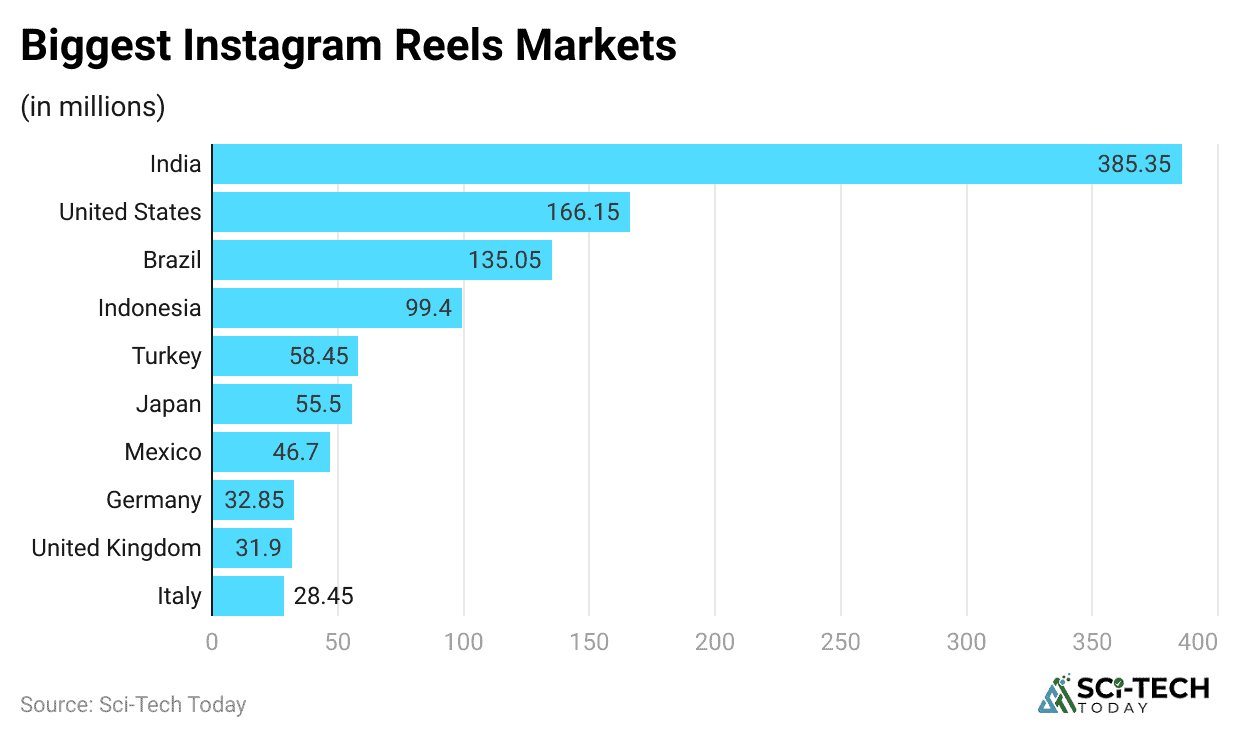
(Reference: demandsage.com)
- The following table shows the biggest Instagram Reel markets:
| Country | Instagram Reel Users |
|
Italy | 28.45 million |
| United Kingdom |
31.9 million |
|
Germany | 32.85 million |
| Mexico |
46.7 million |
|
Japan | 55.5 million |
| Turkey |
58.45 million |
|
Indonesia | 99.4 million |
| Brazil |
135.05 million |
|
United States | 166.15 million |
| India |
385.35 million |
- Instagram accounts with more than 50,000 followers post Reels more often than others, about 1 Reel every 2 days, or 0.5 per day.
- Pages with 10,001 to 50,000 followers post less frequently, around 0.3 Reels daily. Meanwhile, small accounts with fewer than 500 followers are the least active, uploading just 1 Reel every 5 days, which equals 0.18 per day.
Here’s the average number of Reels posted daily by account type:
- Tiny accounts (under 500 followers): 0.18/day
- Small accounts (500–10,000 followers): 0.18/day
- Medium accounts (10,001–50,000 followers): 0.21/day
- Big accounts (50,001–100,000 followers): 0.29/day
- Huge accounts (100,001+ followers): 0.55/day
#3. X
- In 2025, the number of video views on X (Twitter) continued to rise, with users watching about 8.3 billion videos per day, up strongly versus the 2 billion‑per‑day era and still growing year over year.
- Over 100 million users watch vertical-style videos (like Reels) on X every day, based on StatsUp data.
- More than 50% of those who watch vertical videos on X are Gen Z (young people born between 1997 and 2012).
- Posts with videos get 10x more Engagement (likes, comments, and shares) than those without.
- Overall, X users now watch around 8.3 billion videos per day on the platform in 2025.
- Advertisers pay 50% less per Engagement when they run video ads on Twitter compared to other ad formats.
- Although X’s total earnings remain under pressure, ads are still the main revenue source, with global ad revenue in 2025 estimated around USD 2.5 billion.
- Twitter (now X) has over 611 million daily users who can be shown ads, referred to as monetizable daily active users (MDAU).
- Around 68.66% of users are men, while 31.34% are women.
- About 53% of X users regularly use the platform to stay updated on news, according to Statista.
Final Thoughts
Each platform offers something different, so the best one for you depends on what you’re trying to do. Facebook works well if you want to reach a wide age range and build online groups or share longer posts. Instagram is ideal for sharing pictures and short videos, as well as staying up-to-date with the latest trends. Its Reels feature gets billions of plays, making it a smart pick for creators, brands, and younger users. Twitter (now known as X) remains the go-to platform for quick updates, trending topics, and live conversations. In 2025, it saw a +30% jump in daily video views, and videos cost 50% less per ad engagement.
So, if you want to build a strong community, choose Facebook; if you want to stand out visually, go with Instagram; and for fast news and viral content, Twitter or X is your best bet. We have shed enough light on Facebook vs. Instagram vs. Twitter: Which is Better? Through this article.
FAQ
Gen Z uses TikTok, Snapchat, and YouTube instead of or alongside Instagram for daily entertainment, search, and close friend communication.
Facebook is the number one social media app in the world, followed closely by Instagram and WhatsApp. All three platforms are owned by Meta Platforms.
Gen Z’s most used social media platforms are YouTube, Instagram, and TikTok. These three apps lead in total reach and daily use for this generation.

Sources
- Investopedia
- Hypefury
- Techmagnate
- Quora
- Socialbee
- Hubspot
- Raoinformationtechnology
- Hearsaysocial
- Voicesforhealthykids
- Webfx
- Penji
- Convinceandconvert
- Ajaxunion
- Techmagnate
- Websiteplanet
- Pixelfish
- Socialbee
- Wisoftsolutions
- Wildnettechnologies
- Socialcamels
- Opgram
- Ritza
- Exportdata
- Fiverr
- Gopulsion
- Designshifu
- Parkour3
- Smartsmssolutions
- Foreignerds
- Alviwebtech
- 6Sense
- Thequint
- Sproutsocial
- Wordstream
- Freelancewritinggigs