Introduction
Online Business Statistics: Today, shopping online is the most popular choice. e-commerce has made it much easier to buy everything from clothes and beauty products to home items and groceries. With just a few clicks, you can place an order and have it delivered right to your door, all without leaving your home. Many companies have gone digital, with some running entirely online.
This shift has led to a huge increase in online shopping. Nowadays, almost everyone buys something online at least once a day. To give you a better understanding of online shopping, we’ve gathered some interesting Online Business Statistics for 2025.
Editor’s Choice
- There are about 333.34 million companies worldwide, up from 314.21 million in 2021.
- Around 8 billion people use the internet globally.
- By 2025, online sales are expected to account for 23.6% of all retail sales.
- Live streaming on US eCommerce sites is expected to generate $25 billion by 2024.
- Online sales worldwide are projected to reach $6.542 trillion by 2024.
- These points show the increasing role of online sales, the growth in revenue from live streaming, and the global expansion of online sales.
- Asia has the largest share of online users, with 54.9%.
- Approximately 4.9 billion people use social media.
- Google gets around 99,000 searches every second, totaling about 8.5 million searches each day.
- 44% of internet users use laptops and desktops, 52% use mobile phones, and the rest use tablets.
- Mobile users love six types of apps: maps, instant messaging, music, games, photos, and weather.
- Online Business Statistics stated that almost 84% of Google users search about three times a day or more.
- Google is the most-visited website, with around 90 billion visits per month.
- Google Chrome leads the browser market with 64%, Safari has 20%, and Bing, Edge, and Firefox have 4%, 3.9%, and 3.9%, respectively.
- Google has a dominant 91.9% share of the search engine market.
- Eight billion people use Google Lens each month to identify objects.
- The US leads in e-commerce, with sales expected to grow from $907 billion in 2022 to about $1.5 trillion by 2025. Europe is next with 47%, and China has 15%.
- In the US, 63% of Google users access the search engine on mobile devices.
- Social media users are increasing faster than other digital audiences.
- Online Business Statistics stated that less than 1% of people check the second page of Google search results.
- Over 810 million websites use WordPress, which means 43% of businesses use it for their sites.
- Other popular website platforms include Blogger, Wix, Magento, Shopify, Joomla, and Drupal.
- Around 2 billion people made at least one online purchase last year, which is 27% of the world’s population.
- The top countries for e-commerce are China, the US, and the UK.
- In the UK, 55% of adults buy their clothes online.
- Mobile e-commerce purchases hit around $4 trillion, a big increase in the past year.
- Small businesses are quick to adopt new digital tools.
- Online retail makes up 20.8% of all retail sales, as per Online Business Statistics.
General Online Business Statistics
- By 2040, online shopping is expected to be the norm, with 95% of purchases happening online.
- Online Business Statistics stated that customers spend 30% to 50% of their budgets on groceries.
- Recent data shows e-commerce sales total $294 billion.
- 48% of online shoppers are female, with 49% of these purchases being clothing and shoes, followed by beauty and entertainment items.
- 60% of adults prefer online shopping to avoid long queues, and 71% find better prices online compared to physical stores.
- Immigrants have started over 50% of unicorn companies in the US.
- 81% of people search for a business online before finalizing their purchase to ensure they’re making the right choice.
- 75% of online shoppers expect a response to their inquiries within 5 minutes.
- According to Online Business Statistics, 24% of all purchases are expected to be made online by 2026.
- 40% of business owners consider lead generation a key marketing performance indicator.
- Around 70% of small and medium-sized businesses plan to invest more in digital marketing.
 (Reference: thrivemyway.com)
- There are over 2 billion websites today, as per Online Business Statistics.
- By 2030, digital payments are expected to replace cash, according to 70% of people.
- 90% of new online businesses fail within four months due to poor website performance and marketing.
- The global e-commerce market is projected to reach $6.3 trillion by the end of 2023, a 10.3% increase.
- E-commerce sales are expected to grow by 9.4% by 2024, reaching nearly $6 trillion worldwide.
- Growth might slow slightly in 2025 and 2026 to 9.8% and 8.1%, but by 2026, online spending could hit $8.1 trillion.
- The US e-commerce market is expected to reach $1.1 trillion in 2023.
- Women are making significant strides in business. Over 12 million women, nearly half from diverse backgrounds, run companies in the US.
- Online Business Statistics stated that almost 70% of companies plan to invest more in digital transformation.
- 21% of companies worldwide have completed a key stage of digital transformation.
- Four out of five marketers believe automation and AI tools can improve conversion and lead generation rates.
 (Source: wpforms.com)
- Marketing automation is a major trend in 2023, potentially increasing sales by 14.5% and cutting marketing costs by 12.2%.
- 80% of marketers will continue using automation software due to its positive results, and 91% say integrating automation is crucial for digital marketing success.
- More than 75% of marketers report increased conversions as per Online Business Statistics.
- A lead is nine times more likely to convert if the brand follows up within 5 minutes through email, SMS, or social media.
- Amazon has the highest market value in the online business, at $1.597 trillion, followed by Apple, at $65.34 billion.
- While Amazon dominates, other major e-commerce businesses are expected to grow to over $710 billion by 2025.
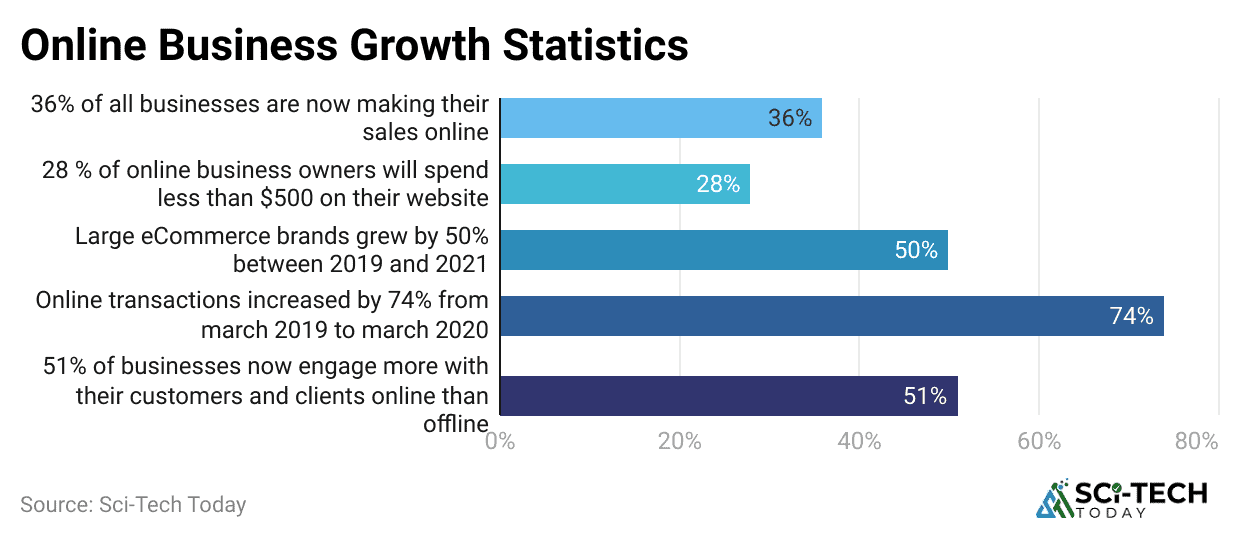
- Businesses with an online presence saw nearly 50% growth in sales from 2013 to 2018, compared to a 10% increase in physical store sales.
- 90% of e-commerce startups fail within three months due to poor website performance and ineffective marketing.
- 82% of consumers shop online daily, while only 24% shop offline.
- In 2023, 16% of retail purchases, covering everything from clothes to furniture, are expected to be made online.
Leading E-Commerce Players
- E-commerce platforms are helping businesses start online stores in India.
- The biggest firms in India that grow the e-commerce industry are Flipkart Private Limited, eBay Inc., Alibaba Group, Amazon.com, and FSN E-Commerce Ventures Limited, which owns Nykaa.
Amazon to Invest $15 Billion in India by 2031
- Amazon plans to invest an additional $15 billion in India over the next seven years, bringing its total investment to $26 billion after already spending $11 billion.
- Amazon aims to help 10 million small businesses go digital, boost $20 billion in exports, and create two million jobs in India by 2025.
Flipkart’s Parent Invests INR 722 Crore in India
- Flipkart Pvt Ltd, based in Singapore, has invested INR 722 crore ($90 million) into its Indian industry.
- Flipkart Internet, which Walmart owns, received this amount from its parent company in Singapore.
Nykaa’s Revenue Hits INR 51 Billion in FY 2023
- Nykaa, an Indian online store, saw its revenue grow from only INR 5 billion to INR 51 billion in fiscal year 2023.
- This increase came with higher spending on beauty and personal care products. Nykaa’s main revenue came from makeup sales.
- Because it focused more on beauty products, it faced less competition compared to platforms like Amazon or Flipkart.
Mobile E-commerce Statistics
In today’s world, where smartphones and tablets are everywhere, online stores must work well on mobile devices. Retailers need to understand the growing trend of mobile shopping (m-commerce) to adjust their strategies effectively.
- Mobile shopping is expected to make up 43.4% of retail ecommerce sales in 2023, up from 41.8% in 2022. This means more people are shopping online using their mobile devices.
- In the US, mobile commerce sales are projected to exceed $510 billion in 2023, accounting for 42% of all e-commerce sales. This shows that mobile devices play a huge role in online shopping.
- 79% of smartphone users have bought something online using their mobile device in the last six months. This indicates a high level of mobile shopping activity.
- As of March 2023, the average mobile conversion rate is 2.49%. This is lower than desktop conversion rates (3.64%) and tablet rates (3.43%). This suggests that while mobile shopping is popular, it often results in fewer completed purchases compared to other devices.
- 63% of shopping experiences begin online, highlighting the importance of having a strong online presence from the start.
- 60% of online shoppers abandon their purchases because of a poor user experience. Improving the mobile shopping experience can help reduce these abandonments.
- 50% of smartphone users are more likely to use a brand’s mobile site rather than download an app. This means a good mobile site is key to engaging users.
- 58% of smartphone users prefer companies whose mobile sites or apps remember their past behavior and preferences. Personalizing the shopping experience can make it more convenient and appealing.
- Even with the growth in mobile shopping, 80.79% of mobile shopping carts are abandoned, showing there’s room for improvement in user experience to reduce abandonment.
What Retailers Should Do:
- Improve Mobile Optimization: According to Online Business Statistics, your mobile site should be user-friendly and easy to navigate to meet the needs of mobile shoppers.
- Enhance User Experience: Work on improving the overall mobile shopping experience to lower cart abandonment rates and increase conversions.
- Focus on Mobile Sites: Since many users prefer using mobile sites over apps, invest in creating a high-quality mobile site.
- Personalize the Experience: Add features that remember user preferences and past actions to make shopping easier and more engaging.
- Reduce Cart Abandonment: Implement strategies to make the checkout process smoother and address issues that lead to cart abandonment.
Online Business and Lead Generation Statistics
Over half of businesses say their biggest marketing challenge is getting leads and traffic to their websites. If you’re facing this issue, here are some important facts and figures to help you find ways to improve.
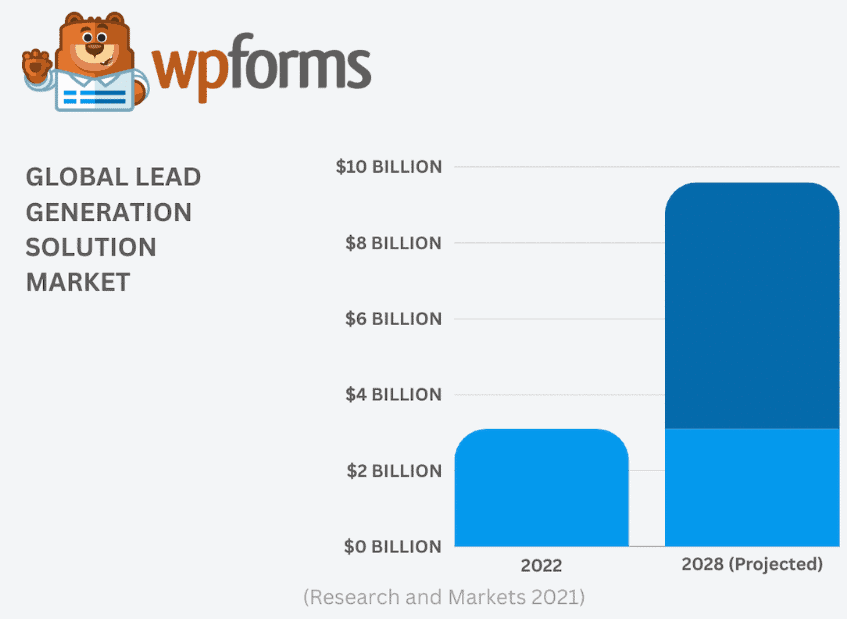
- The global lead generation market is expected to grow from $3.1 billion in 2021 to $9.6 billion by 2028.
 (Source: wpforms.com)
- A huge 91% of marketers say that lead generation is their top priority.
- Online Business Statistics stated that using multi-step forms on WordPress can boost conversions by up to 300%.
- For 27% of marketers, lead generation is a key way to measure the effectiveness of their content marketing strategy.
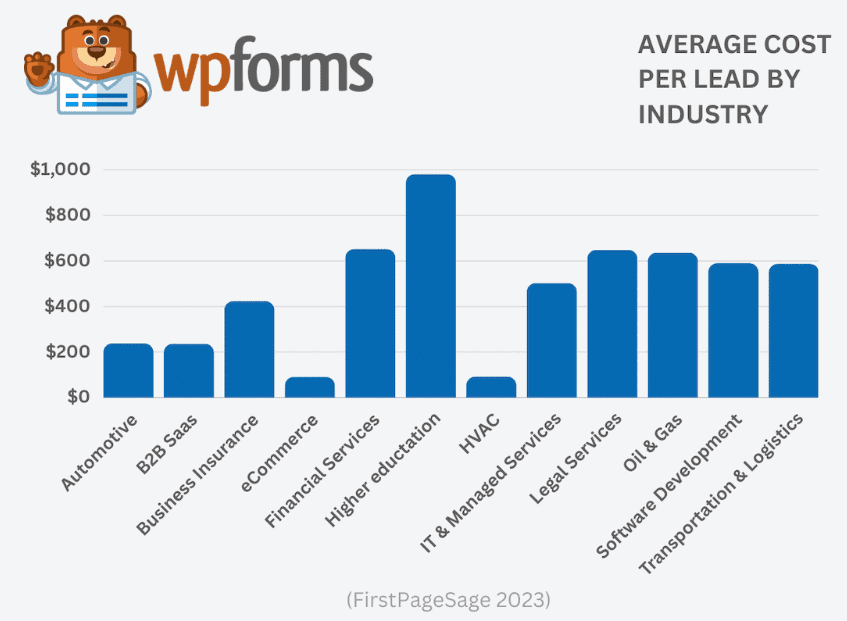
- The cost to get a lead varies by industry. Higher education has the highest cost at $984 per lead. Other industries with high costs include financial services, legal services, oil & gas, IT, software development, and transport & logistics.
- On the lower end, the eCommerce and HVAC industries charge around $91 and $92 per lead, respectively.
 (Source: wpforms.com)
- Over half of marketers, around 53%, put at least half of their marketing budget into lead generation.
- In 2023, web conversions went up by nearly 11% on average, and inbound leads increased by 6.66%.
- The highest conversion rates for search ads are found in industries like pets (13.41%), healthcare (13.12%), and automotive (12.61%).
- About 65% of high-intent searches (searches to buy) result in a click on an ad.
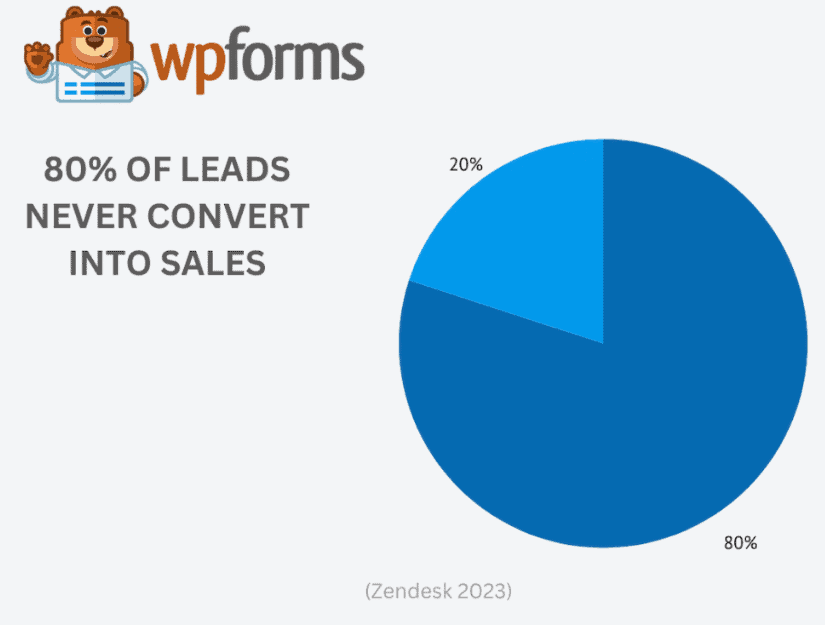
- 80% of new leads do not convert into sales, as per Online Business Statistics.
 (Source: wpforms.com)
- Global spending on search ads is predicted to go over $306 billion in 2024.
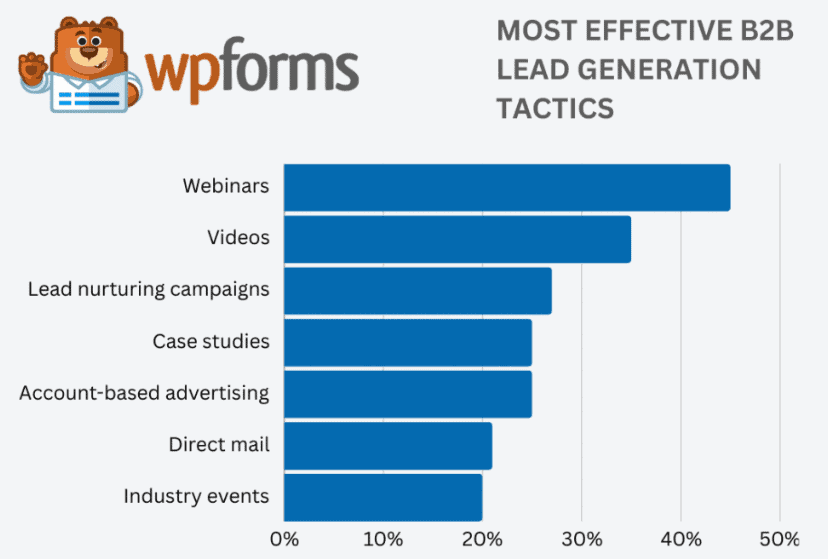
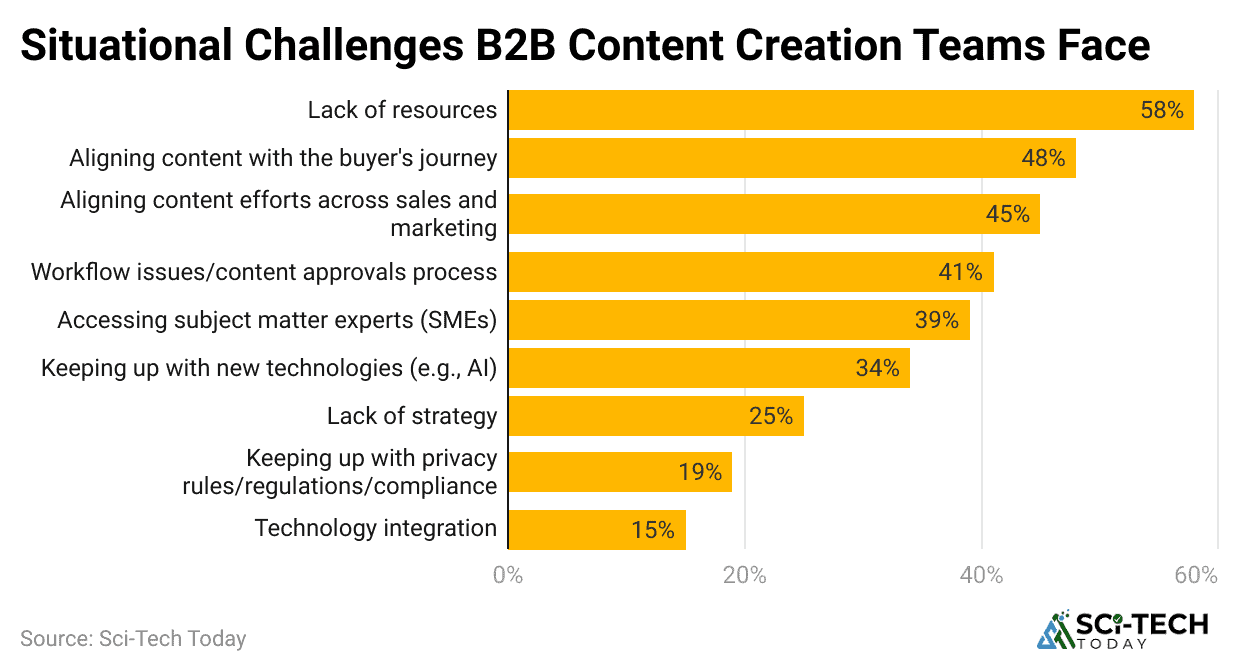
- 45% of B2B marketers find that webinars are the best for generating interest at the top of the sales funnel, while virtual events and digital experiences come in next at 35%.
 (Source: wpforms.com)
- Over 35% of B2B marketers say that not understanding their products or services is a major challenge for getting leads. Other difficulties include targeting a specific or hard-to-reach audience, struggling to contact decision-makers, the audience needing to be more familiar with the product or service, and outreach methods that are hard to expand.
- According to Online Business Statistics, LinkedIn is the top platform for generating leads for 84% of B2B marketers.
- Effective lead nurturing can result in 50% more ready-to-buy leads and costs 33% less.
 (Reference: wpforms.com)
| A program is in place and measurable | 18% |
| A program is in place, but it is not well-designed |
17% |
|
Still developing a program |
20% |
| No program, but I have plans to implement one |
19% |
|
No program in place and no plan to implement one |
25% |
- Personalizing marketing can lower customer acquisition costs by up to 50%.
- 60% of senior executives believe AI will significantly impact how leads are found in sales and marketing.
- According to Online Business Statistics, companies that use AI for lead generation have seen a 15-20% increase in sales productivity.
- 40% of businesses are either planning to or have already boosted their investment in AI for lead generation.
Content Marketing and Blogging Statistics
One important part of digital marketing is content marketing. It creates three times more leads compared to traditional outbound marketing and costs much less. Simply put, it’s a budget-friendly way to generate leads.
- 90% of businesses have a content marketing plan and regularly use blogging to build their brand and boost awareness.
 (Reference: webacquisition.com)
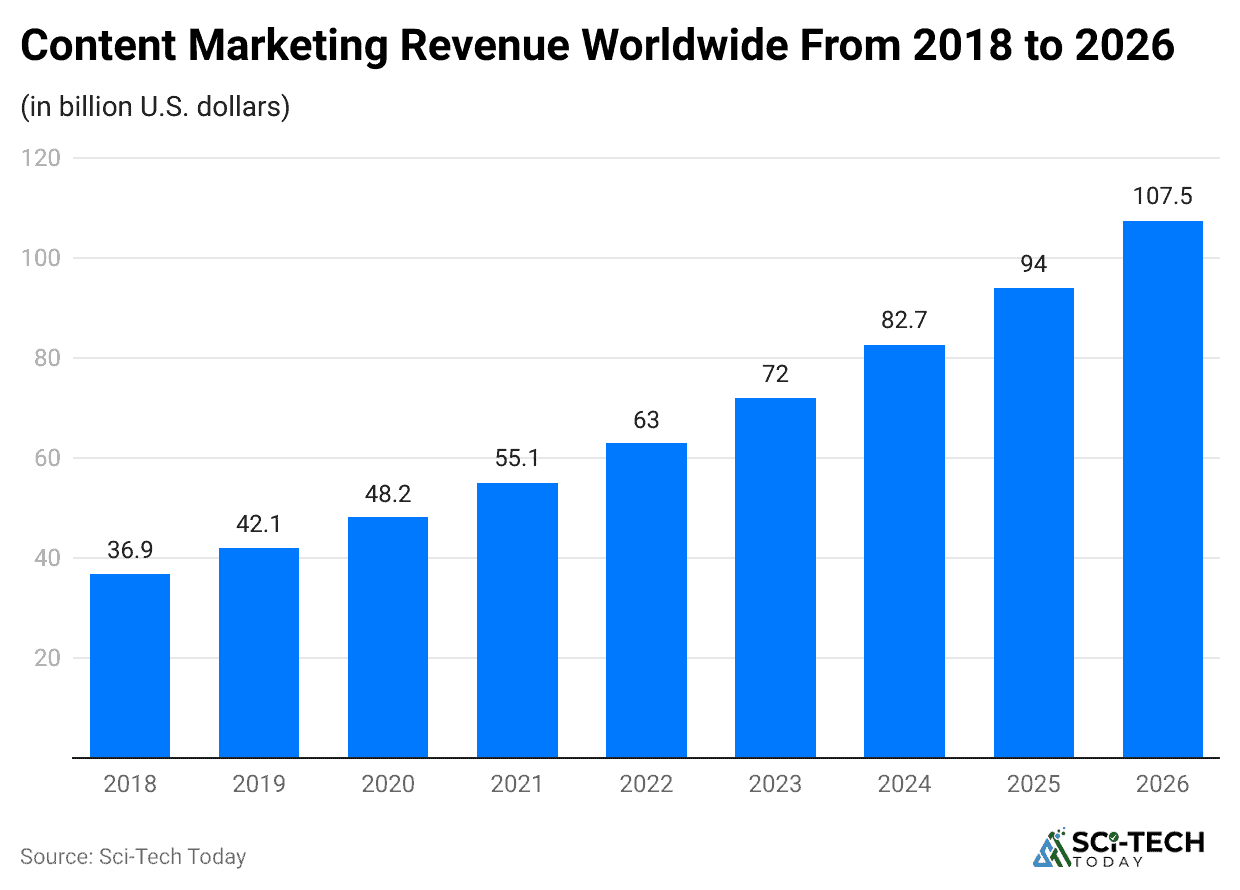
- By 2022, content marketing revenue was $63 billion and is expected to grow to $107 billion by 2026.
- In 2023, almost half of marketers planned to increase their content marketing budgets. Also, 80% of marketers worldwide felt their content strategy was very successful.
- Blogging is a key content marketing strategy for 48% of companies because they understand its value.
- Content marketing generates three times more leads than traditional marketing and costs 62% less, leading to six times more conversions.
- Over the past year, 26% of B2C companies reported achieving very high or significant success with content marketing.
- WordPress remains the top blogging platform used by major companies, such as TechCrunch, TED, CNN, and the NFL.
- In 2023, more than 50% of B2C companies shared content on their websites through blogs, email newsletters, and email.
- Online Business Statistics stated that almost 36% of business marketers have centralised teams dedicated to content marketing within their companies.
- The top three goals that enterprise marketers say content marketing helps with are increasing brand awareness, educating their audience, and building credibility and trust.
 (Reference: contentmarketinginstitute.com)
- Blogging helps build trust and drive business. Companies with blogs get over 90% more links and see 13 times higher ROI compared to those without blogs.
- Only 31% of B2B marketers feel their company has the right content management technology.
- According to Online Business Statistics, thirty percent have the technology but need to use it to its full potential, and 29% still need to get the right technology.
- In 2024, 45% of B2B marketers expect their company to invest in more content management technology. Thirty-two per cent think their company won’t invest more, while 23% are unsure either way.
Online Consumer Behavior Statistics
- 44% of consumers say that the spread of coronavirus has affected their shopping decisions.
- 47% of men and 41% of women say the virus has influenced their buying choices.
- 54% of Millennials feel their shopping habits have changed because of the virus. In comparison, only 33% of Baby Boomers, 42% of Gen X, and 49% of Gen Z say the same.
- Online Business Statistics stated that around 35% of consumers say that news about the coronavirus is affecting where and how they shop.
- More men (38%) than women (33%) say the news impacts their shopping habits.
- Younger generations are more affected: 37% of Gen X, 38% of Gen Z, and 39% of Millennials, compared to just 26% of Baby Boomers.
- 30% of consumers say they are shopping in physical stores less often.
- According to Online Business Statistics, slightly more women (30%) than men (29%) are shopping less in-store.
- Millennials (39%) are shopping in-store less frequently compared to 36% of Gen Z, 25% of Gen X, and 22% of Baby Boomers.
 (Reference: statista.com)
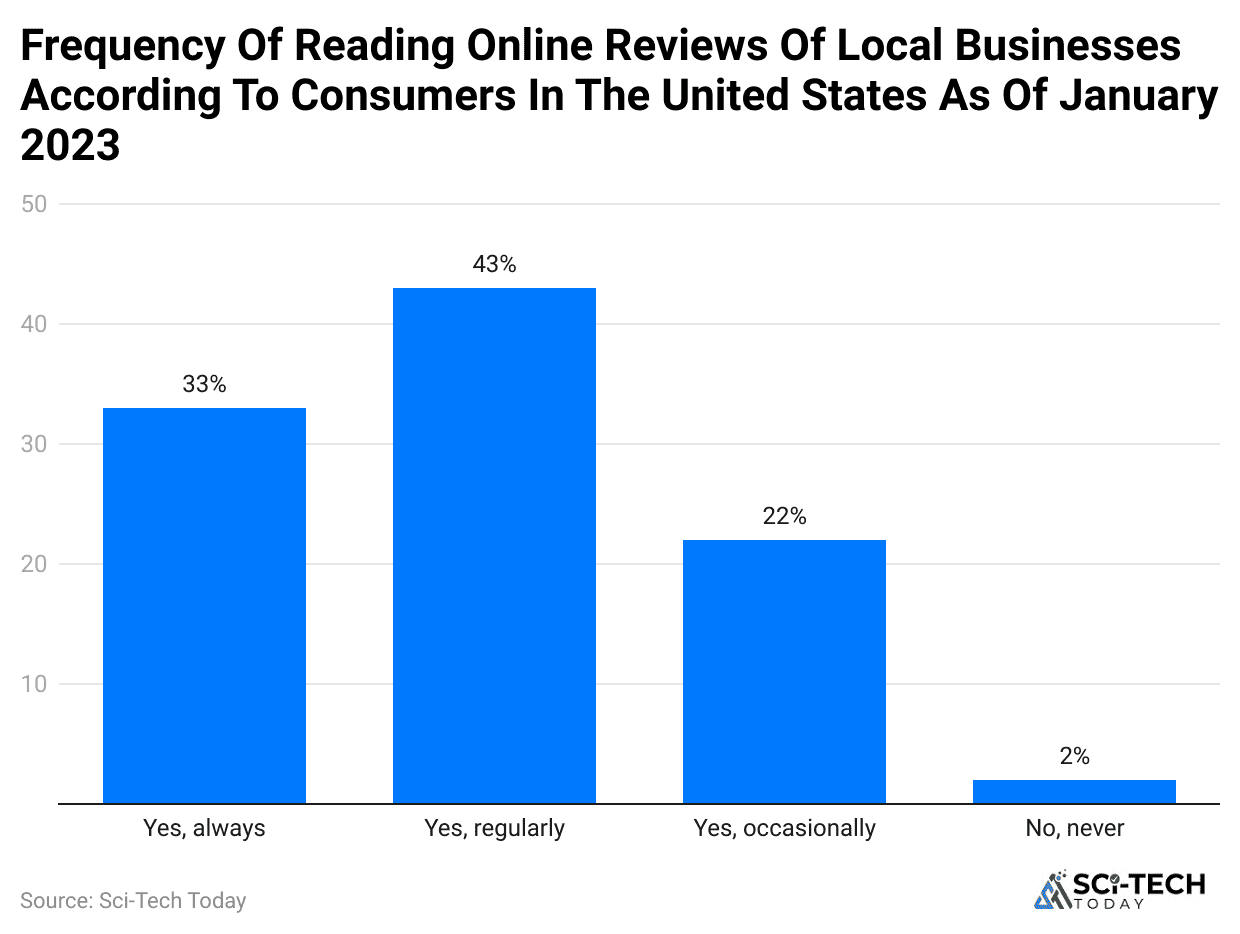
- A January 2023 survey revealed that 33% of US adults always read online reviews for local businesses.
- More than 43% said they often check these reviews, and just 2% said they never read them.
- Online Business Statistics stated that almost 21% of consumers say they are shopping online more often.
- More men (24%) than women (18%) are shopping online more frequently.
- Millennials are leading in online shopping, with 30% shopping online more compared to 24% of Gen Z, 20% of Gen X, and just 8% of Baby Boomers.
- Over 50% of online purchases by people aged 16-24 are valued between $100 and $499.
- Purchases in this price range are the most common across all age groups.
- Online purchases of $100-$499 make up about 43% of all online purchases by women and 40% by men.
- More consumers are using online and multichannel retail services to get products delivered without going into stores.
| Service | % of Men | % of Women |
|
Autoship |
12% | 14% |
| Curbship pickup | 22% |
16% |
|
Subscription services |
18% | 16% |
| BOPIS (Buy Online, Purchase In-Store) | 31% |
28% |
| Services | Baby Boomers | Gen X | Gen Z | Millennials |
|
Curbside pickup |
13% | 13% | 22% | 30% |
| Subscription services | 8% | 19% | 19% |
23% |
|
BOPIS (Buy Online, Purchase In-Store) |
20% | 28% | 47% |
22% |
- Before COVID-19, people expected standard shipping to take about four days. Now, they expect it to take around 6.7 days.
- Since the pandemic began, more than 67% of UK shoppers have reported facing shipping delays. Currently, the average delay for shipping in the UK is 1.9 days, which is close to the European average of 2 days.
- This shift in expectations shows that while delays have become more common, consumers have adjusted to longer delivery times due to ongoing disruptions in shipping and logistics.
Online Business Consumer Review Statistics
- Online reviews greatly affect a business’s success. Just one review can boost conversion rates by 10%, and this can increase the chance of buying products or services by 67.7%. Sales have gone up by 6.46% when reviews are shared on Twitter.
- When a product has good reviews, about 81% of people are okay with waiting longer for it to be delivered.
- Customer interest in products with more than five reviews goes up fourfold.
- In the US, 89% of people use smartphones to check online reviews. Meanwhile, 88% of CEOs think that online reviews can hurt a company’s reputation.
- Negative reviews lead to 86% of customers leaving a business, as per Online Business Statistics.
- In 2022, about 263 million people, or 80% of US shoppers, preferred to shop online. This number is expected to grow to 291.2 million by 2025.
- Because of online reviews, retail sales rose by 6.9% in 2022 and are expected to increase by 8% in 2023.
- Additionally, 71% of US consumers say that social media posts from friends and family influence their buying choices. The market for online reviews is projected to grow at a rate of 26.19% each year from 2022 to 2030.
 (Reference: enterpriseappstoday.com)
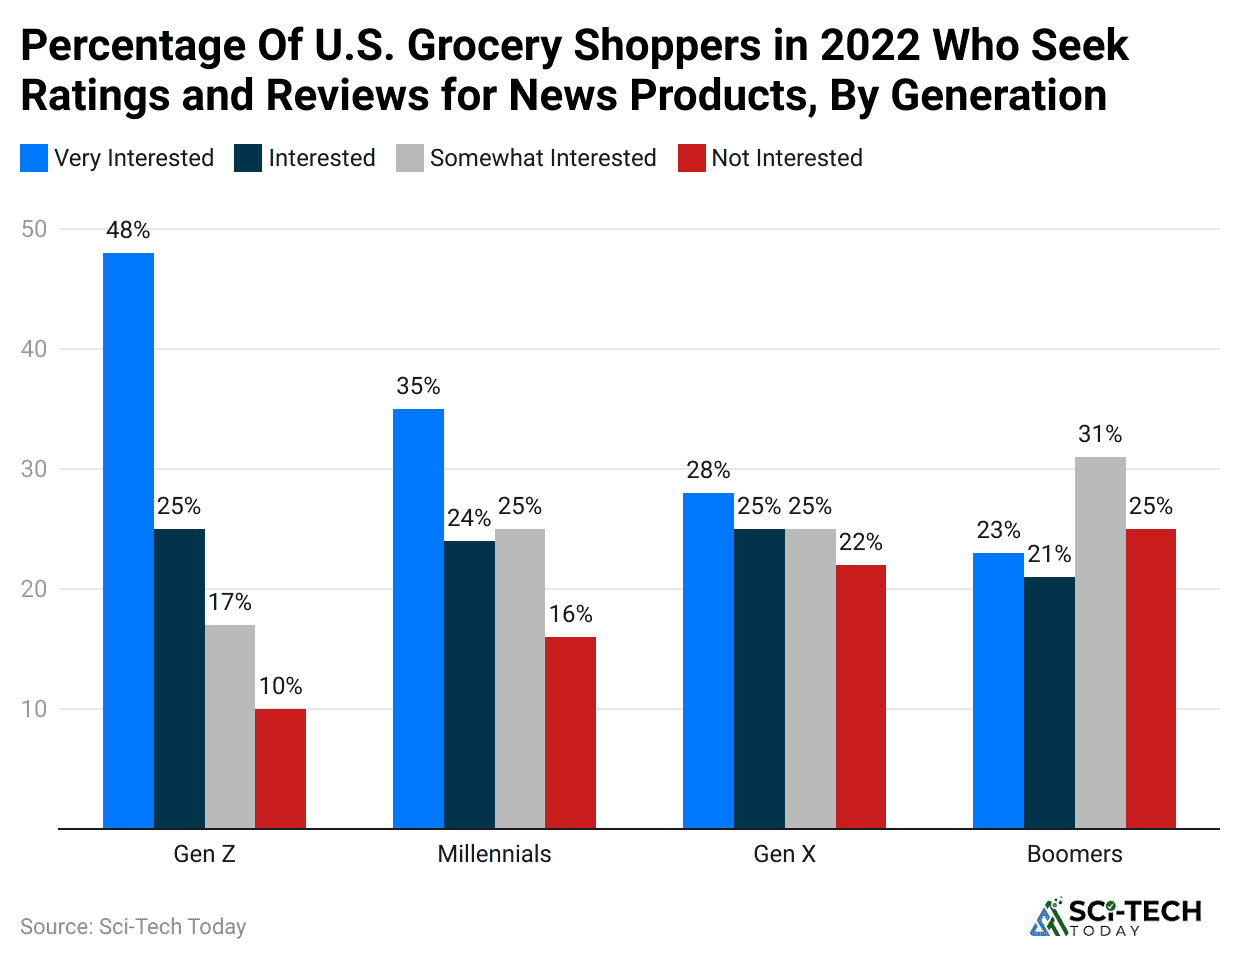
| Very Interested | Interested | Somewhat Interested | Not Interested | |
|
Gen Z |
48% | 25% | 17% | 10% |
| Millennials | 35% | 24% | 25% |
16% |
|
Gen X |
28% | 25% | 25% | 22% |
| Boomers | 23% | 21% | 31% |
25% |
 (Reference: enterpriseappstoday.com)
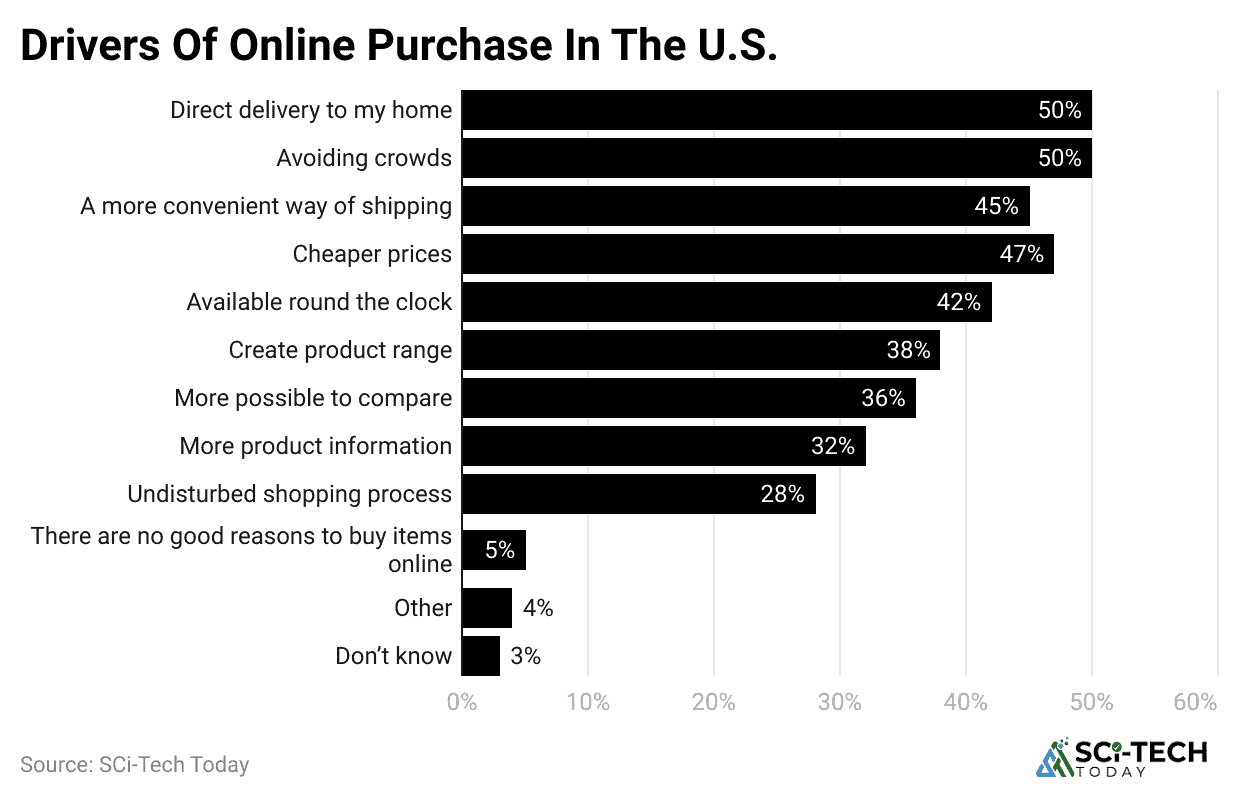
| Direct delivery to my home | 50% |
| Avoiding crowds |
50% |
|
A more convenient way of shipping |
45% |
| Cheaper prices |
47% |
|
Available round the clock |
42% |
| Create product range |
38% |
|
More possible to compare |
36% |
| More product information |
32% |
|
Undisturbed shopping process |
28% |
| There are no good reasons to buy items online |
5% |
|
Other |
4% |
| Don’t know |
3% |
 (Reference: enterpriseappstoday.com)
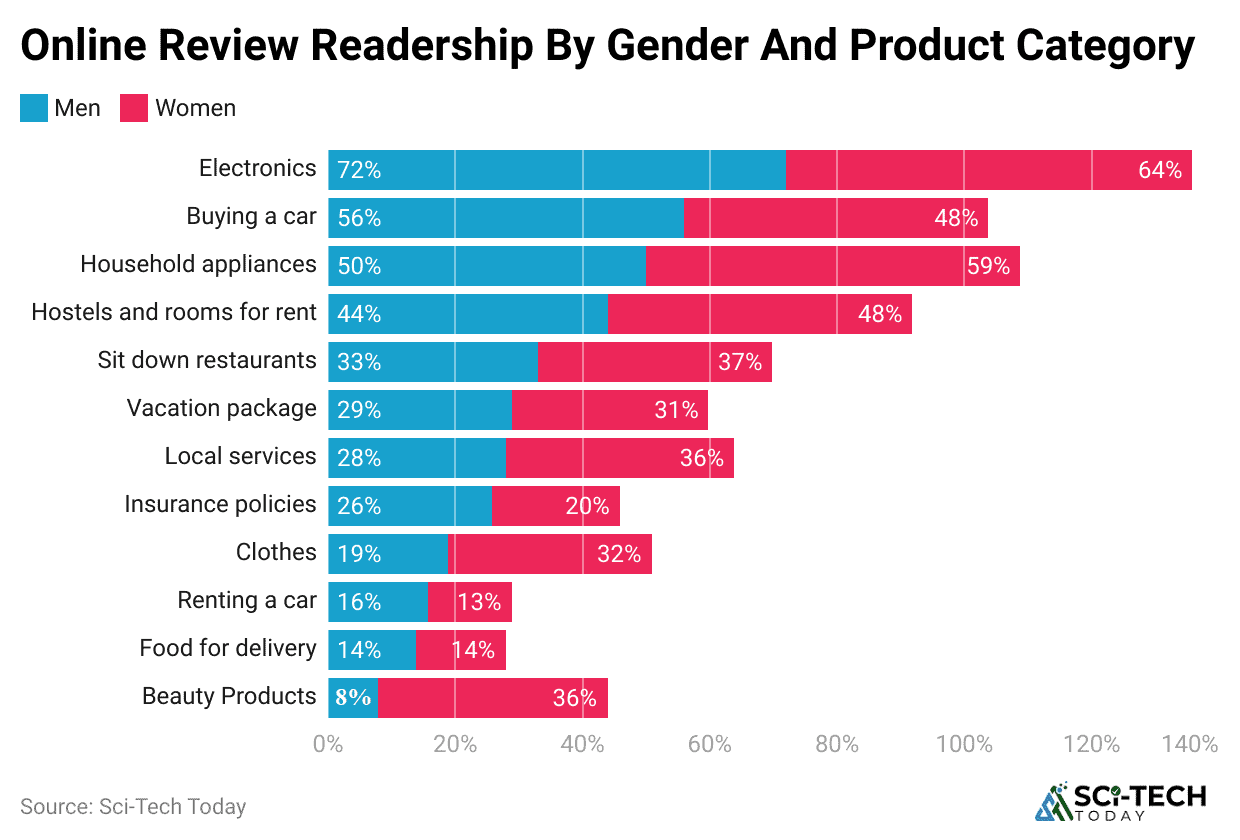
| Men | Women | |
|
Beauty Products |
8% | 36% |
| Food for delivery | 14% |
14% |
|
Renting a car |
16% | 13% |
| Clothes | 19% |
32% |
|
Insurance policies |
26% | 20% |
| Local services | 28% |
36% |
|
Vacation package |
29% | 31% |
| Sit-down restaurants | 33% |
37% |
|
Hostels and rooms for rent |
44% | 48% |
| Household appliances | 50% |
59% |
|
Buying a car |
56% | 48% |
| Electronics | 72% |
64% |
Online Business Statistics per Country
#1. Online business statistics in the United States
- The 32.4% growth in e-commerce in 2020 highlights a significant surge, likely driven by the pandemic and increased online shopping habits.
- With one-third of small businesses lacking a website, there’s a substantial opportunity for these businesses to tap into online markets and boost their sales.
- The 53% of consumers who shop online for free shipping underscores the importance of this incentive in driving online purchases.
- Online Business Statistics stated that free shipping is a major factor in many consumers’ decision-making processes.
- The fact that 33.6% of consumers use comparison sites while shopping in physical stores indicates that many people are combining online research with in-store shopping to find the best deals.
- With 45% of eCommerce sales happening on mobile devices, optimising for mobile is crucial for businesses.
- Mobile-friendly sites and apps can significantly impact sales and customer satisfaction.
- The statistic that 38.4% of purchasers are 35 or younger highlights a younger demographic’s significant presence in the market. This group is likely more tech-savvy and responsive to digital marketing strategies.
#2. Online Business Statistics in Canada
- Canadian online sales average $2.9 billion every month.
- 75% of people in Canada have bought something online.
- 58% of Canadian shoppers make more than seven online purchases each year.
- 42% of online purchases in Canada come from couples without children, as per Online Business Statistics.
- These points give a clear picture of the Canadian eCommerce scene, showing strong online shopping habits and a growing use of digital payment methods.
#3. Online Business Statistics in Australia
- Australians aged 35 to 44 spend the most money online.
- Online Business Statistics stated that online sales made up 2% of Australia’s GDP.
- 90% of people in Australia use mobile phones for shopping.
- Australian businesses saw a 55% rise in sales in 2020 compared to 2023.
- These points show how important online shopping and mobile devices are in Australia and how much sales grew in 2022.
#4. Online Business Statistics in the UK
- In 2022, 87% of adults in the UK shopped online, up from 82% in 2021.
- Online Business Statistics stated that around 55% of UK adults buy clothes online.
- Online grocery sales jumped by over 80% in 2023
- In November 2020, 36% of all retail sales in the UK were made online.
- The average person in the UK spends £1,372.78 ($1,692.67) online each year.
- 38% of UK consumers buy something online at least once a week, making them the most active online shoppers worldwide.
- The US ranks second, with 26% of consumers shopping online weekly.
- PayPal is the most commonly used online payment method in the UK, and 49% of users prefer it.
#5. Online Business Statistics in China
- China is the largest e-commerce market globally, with $1.7 trillion in annual sales.
- Only 44% of people in China have bought something online.
- Online Business Statistics stated that almost 29% of retail sales in China are done online.
- 94% of Chinese shoppers use mobile payments, compared to 45% of shoppers in the US.
- Online Business Statistics in Malaysia
- Online sales increased from $4.9 billion in 2020 to $6.2 billion in 2023.
- 52% of online sales are made on smartphones, while 42% are made on desktops.
- 47% of people choose to shop online because it’s more convenient.
- 27% of online sales are for electronic products, as per Online Business Statistics.
Email Marketing Statistics
- Emails sent through Constant Contact have an average click-through rate of 1.40%
- Emails that are segmented get 30% more opens and 50% more clickthroughs compared to those that are not.
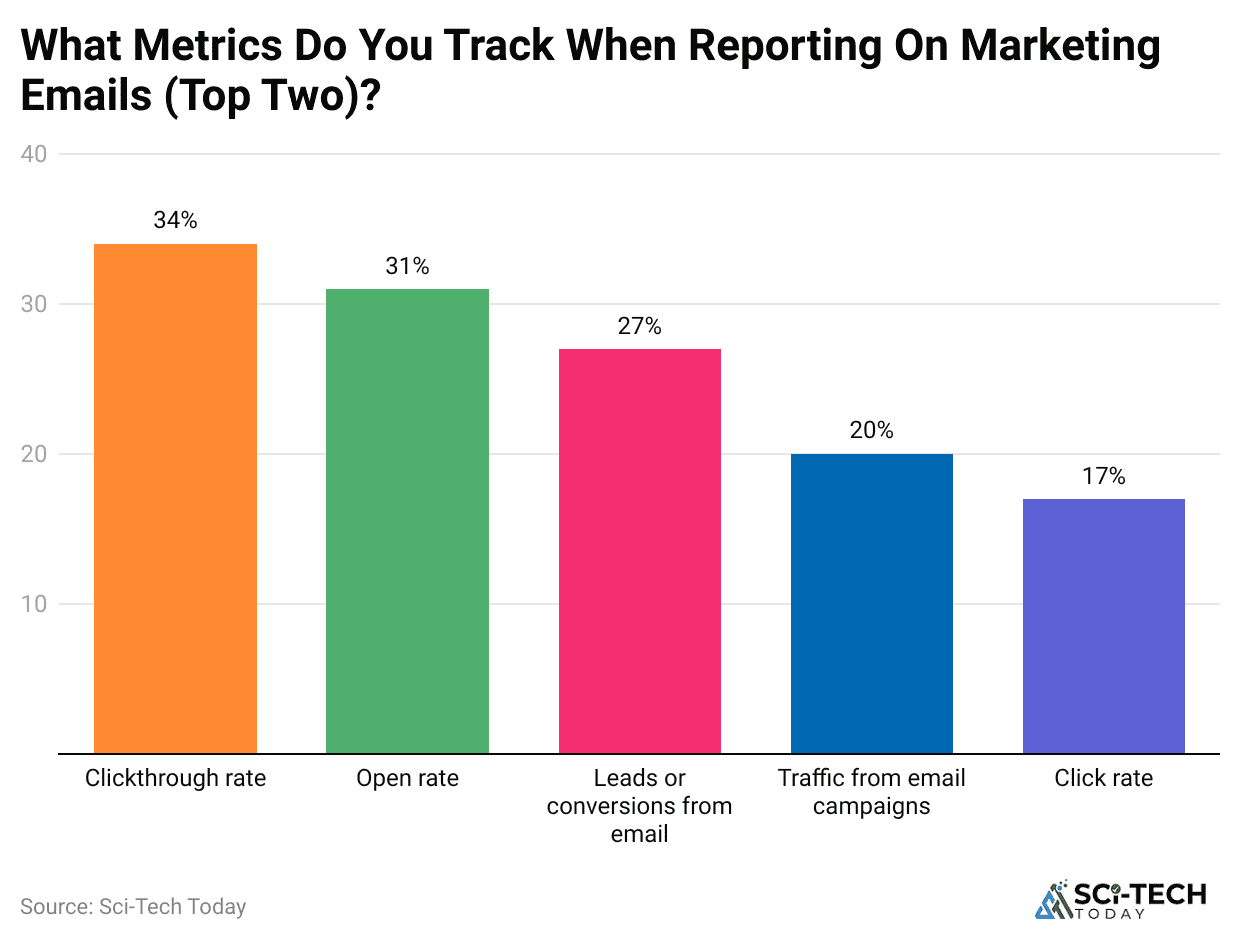
- Marketers mostly use the click-through rate to measure how well their email campaigns are doing.
- 95% of marketers who use generative AI for email creation find it “effective,” and 54% find it “very effective”.
- Online Business Statistics stated that around 43% of marketers say that generative AI is most helpful for creating email content.
- The most common way marketers personalise emails is by using the recipient’s name.
 (Reference: aweber.com)
- 47% of people open an email just because of the subject line, and 69% mark an email as spam based only on the subject line.
- Segmenting emails results in 30% more opens and 50% more clickthroughs compared to non-segmented emails.
- 78% of marketers believe that segmenting their email subscribers is the most effective strategy for email marketing.
- 64% of marketers customise their emails based on different segments of their audience.
- According to Online Business Statistics, 59% of Americans think most of the emails they receive could be more useful.
- People often unsubscribe from emails because they receive too many.
- 40% of email users have at least 50 unread messages in their inbox.
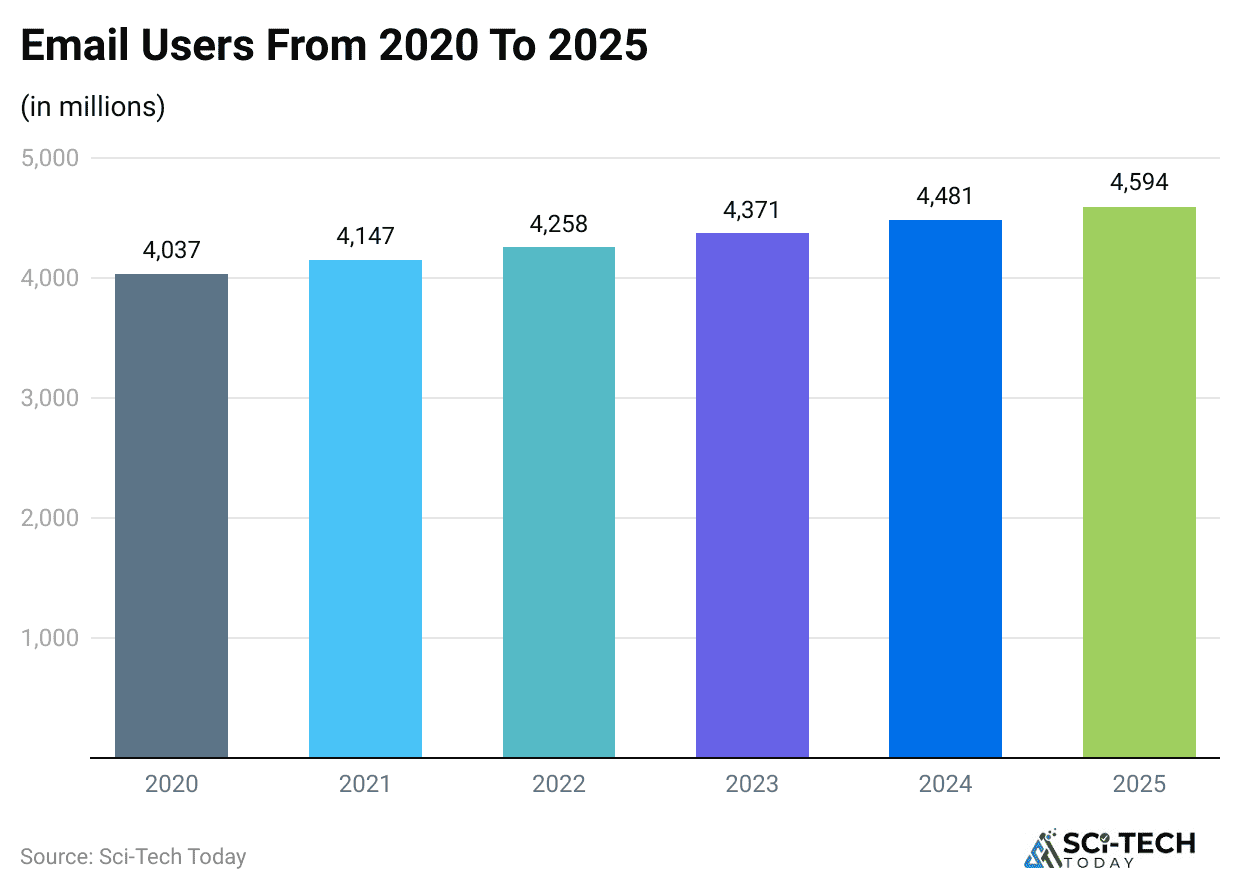
- There were 4.26 billion email users worldwide in 2022, and this number is expected to grow to 4.73 billion by 2026.
 (Reference: hubspot.com)
- 22% of marketers send two or three marketing emails each day, and 21% send them daily.
- Online Business Statistics stated that Emails tend to get the most engagement between 9 AM and noon.
- 41% of emails are viewed on mobile devices, and 75% of Gmail users check their emails on mobile.
- 35% of email marketers use a design approach that focuses on mobile devices.
E-commerce Growth Projection Statistics
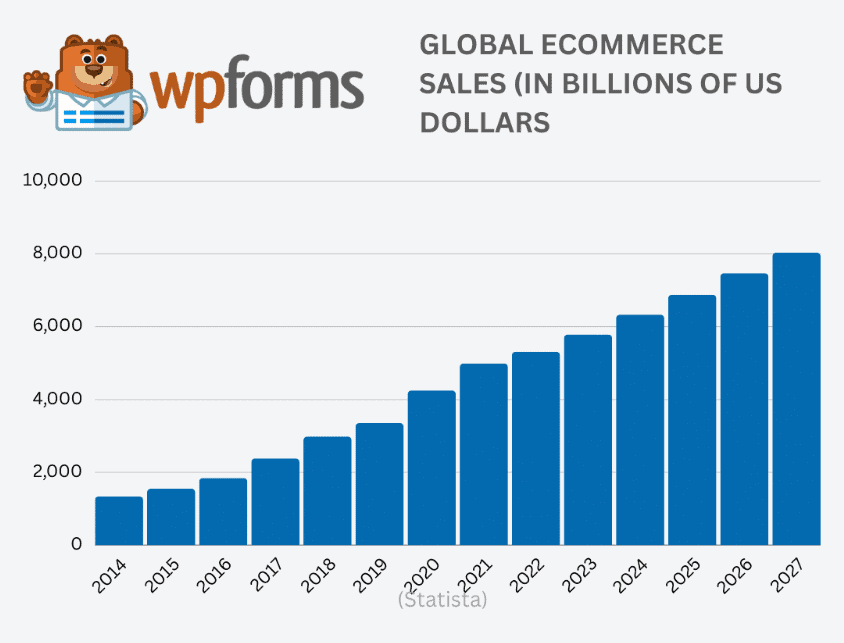
- The global e-commerce market, which was $5.2 trillion in 2021, is expected to grow to around $8.1 trillion by 2026 (Statista).
- This rapid growth shows how quickly online shopping is increasing.
- The number of people shopping online worldwide more than doubled from 1.32 billion in 2014 to over 2.64 billion by the end of 2023, which shows that more people are shopping online.
- Sales from mobile devices are expected to hit $534.18 billion in 2024, making up 40.4% of all e-commerce sales. This indicates that more people are using their phones for online shopping.
- Sales on US business-to-business (B2B) ecommerce sites are projected to grow from $1.676 trillion in 2022 to $2.472 trillion by 2026. This shows that businesses are increasingly making transactions online.
- China’s e-commerce market is expected to reach $2.1 trillion by 2027. This shows that China is a major player in the global online shopping market.
- The global rate of e-commerce sales is expected to reach 25% by 2027, up from 19% in 2022. This indicates a larger portion of retail sales is moving online.
- Online grocery sales are expected to grow to 15% of the market by 2026, up from 8.8% in 2020. This suggests that more people are buying groceries online.
- Sales from cross-border ecommerce are expected to rise from $750.1 billion in 2022 to about $6.585 trillion by 2032. This shows a significant increase in international online shopping.
- Businesses should make sure their websites and shopping experiences work well on mobile phones to reach the growing number of mobile shoppers.
- Companies should look into opportunities in fast-growing markets like China and enhance their ability to sell internationally.
- Investing in better digital platforms and technology is important to handle the growing number of online transactions and meet customer needs.
- With more people buying groceries online, businesses in this sector should consider boosting their online presence.
- Working with international logistics and marketplace partners can help businesses succeed in cross-border ecommerce.
Online Business Statistics for Business Owners
#1. Important Facts About Small Businesses and Websites
- 79% of startup owners believe that having a business website can lead to at least 25% growth over the next three to five years.
- 29% of small businesses still need a website.
- Almost 99.9% of employers in the UK and the US run small businesses. About 90% of them think that investing in a website is the best marketing strategy.
- Over 50% of small businesses operate from home rather than a formal office, and this trend has increased since the pandemic.
- In 2020, there was a 95% rise in online business applications in the US as more people started thinking about launching their businesses while staying at home during the pandemic.
- There are more than 582 million entrepreneurs worldwide, as per Online Business Statistics.
- Minorities own about 45% of all small businesses in the US, which totals around 30.2 million.
- On average, 543,000 new businesses start each month, but due to high competition, only a small number survive beyond three years.
- In the US, 67% of e-commerce spending goes to local businesses, which significantly benefits the national economy.
- 35% of small business owners think having a website isn’t crucial for making a positive impact and feel their business needs to be bigger for one.
- Many small business owners believe a website is too costly and worry that the revenue it generates will not justify the expense.
- Some small business owners think social media can effectively replace a website (The Manifest).
- 36% of small businesses make their profits from online sales.
- Almost 92% of small business owners believe starting their own business was a great decision, even though they work more than 40 hours a week to keep it running.
- 47% of small business owners wish they had more access to grants and funding to help grow their operations and meet demand. This is seen as a major challenge.
#2. What Small Business Owners Should Consider:
- A good website can help your business grow over time.
- Even if you work from home or think social media is enough, a website can offer many benefits.
- Consider the cost of a website against the potential benefits and sales.
- Look for grants and other funding opportunities to help your business grow.
- Be aware of the shift towards online and home-based businesses and adjust your plans accordingly.
Conclusion
The data shows how important digital platforms have become for businesses to connect with customers and increase sales. From the rise in mobile shopping to the impact of customer reviews, these numbers highlight key trends and opportunities for e-commerce entrepreneurs. As technology keeps changing, it’s essential to stay informed and adjust your strategies to stay ahead.
Whether you’re an established retailer or just starting, these statistics remind you of the need to adapt to this competitive market. We have shed enough light on Online Business Statistics through this article.
Sources
- Wpforms
- Forbes
- Profiletree
- Statista
- Webacquisition
- Gosimpletax
- Forbes
- Coursera
- Hostinger
- Mailmodo
- Coolest Gadgets
- Statista
- Enterpriseappstoday
- Firstsiteguide
- Thesocialshepherd
- Profiletree
- Crestcapital
- Udemy
- Luisazhou
- Thrivemyway
- Webfx
- Straighterline
- Chamberofcommerce
- Und
- Smallbusinessweb
- Zippia
- Brimco
- Dailyblogging
- Wifitalents
- Hubspot
- Nigp
- Helpscout
- Digitalnomaddesigns
- Wpforms
- Digitalnomaddesigns
- Wordstream
- Vpnalert
- Optinmonster
- Worldmetrics
- Tidio
