









Opening
Payment Service Provider Statistics: Making and receiving payments online has become a regular part of doing business. Payment Service Providers help simplify this process by enabling businesses to accept payments via cards, UPI, digital wallets, and bank transfers. They bring merchants, customers, banks, and payment networks together to complete transactions smoothly. Beyond payment processing, many PSPs also offer fraud detection, data protection, recurring payments, and international payment support.
These services help businesses handle transactions securely while making checkout easier for customers. As more people shop and pay online, the need for reliable payment solutions continues to grow.
Choosing the right PSP can help businesses manage payments efficiently, build customer trust, and support future growth.
Featured Choice
- The global payment gateway market is projected to reach USD 47 billion in 2025 and USD 57 billion in 2026.
- In 2026, hosted payment gateways will generate USD 33.63 billion in market revenue.
- The United States leads North America in payment gateway market size, at USD 38.63 billion.
- Disconnected payment systems remain common, with 58.5% of businesses relying on separate tools, providers, and workflows.
- Basic payment acceptance leads at 38.5%, while complex operations account for 23.9%.
- Payment apps are projected to account for 46% of global point-of-sale transaction value by 2030, reaching USD 15.6 trillion.
- Digital wallets are projected to lead online payments with a 54% share.
- Around 66.5% of surveyed businesses use multiple payment service providers.
- The global high-risk payments market is projected to reach USD 36.4 billion by 2026, growing at a 10.7% CAGR.
- Meanwhile, 42.2% of high-risk businesses do not adapt pricing or payment methods to local markets.
- By 2027, digital wallets, including mobile money, are projected to lead global e-commerce payments, accounting for 61% of the market.
- Cards remained the most widely accepted method, with 76% overall adoption.
- Nearly 60% of companies handle payment management as a general administrative task or an additional responsibility.
Global Payment Gateway Market Size
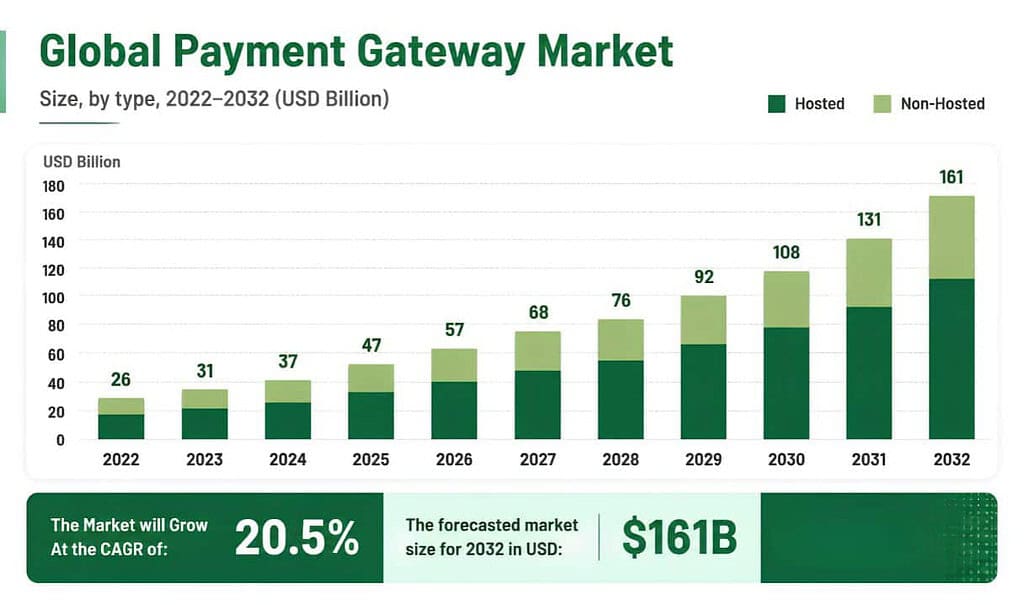
- The global payment gateway market is projected to reach USD 47 billion in 2025 and USD 57 billion in 2026.
- By 2032, the market is forecast to reach USD 161 billion, with a compound annual growth rate of 20.5% over 2022-2032.
Payment Gateway Market Breakdown
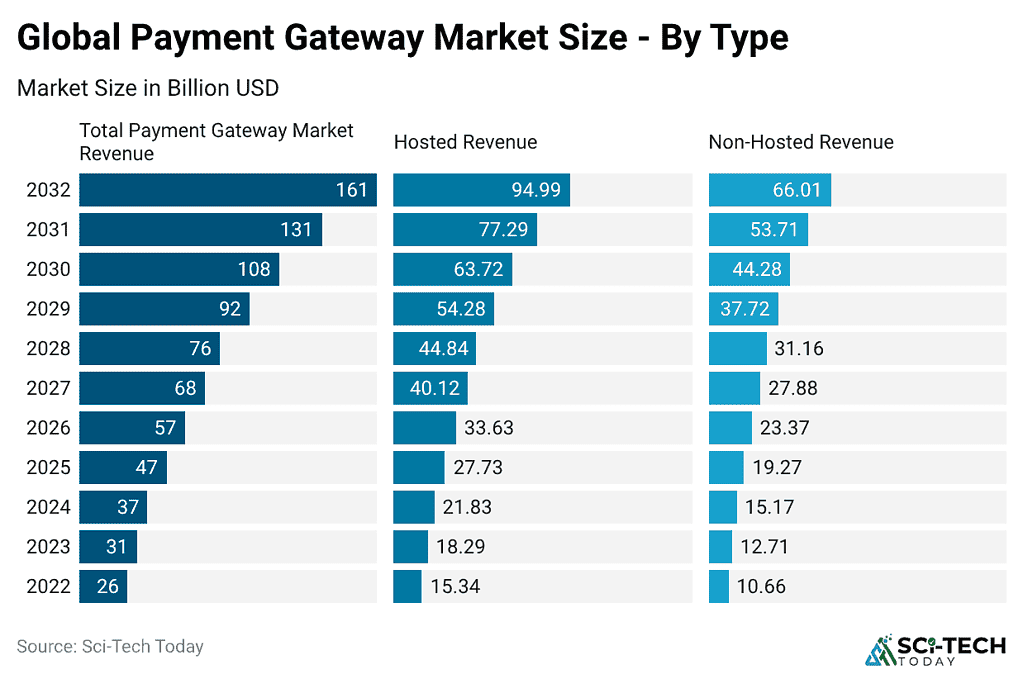
- In 2026, hosted payment gateways will generate USD 33.63 billion in market revenue.
- Non-hosted gateways contribute the remaining USD 23.37 billion.
- By 2032, hosted payment gateways are projected to reach USD 94.99 billion, compared with USD 66.01 billion for non-hosted gateways.
Regional Analysis of the Global Payment Gateway Market, 2026
North America
- According to payment gateway market data published by Scoop Market.us, the United States leads North America in payment gateway market size, at USD 38.63 billion.
- Canada accounts for USD 9.5 billion, while Mexico contributes USD 4.76 billion, reflecting growing demand for digital payment services.
Europe
- Germany leads the European market with USD 10.82 billion, followed by the United Kingdom at USD 7.59 billion.
- France and Italy account for USD 7.37 billion and USD 3.84 billion, respectively. Spain contributes USD 2.95 billion, while the rest of Europe represents USD 5.27 billion.
Asia-Pacific
- China dominates the regional market with USD 9.81 billion, followed by Japan at USD 5.78 billion and India at USD 4.79 billion.
- The rest of Asia-Pacific accounts for USD 5.04 billion.
Middle East & Africa
- The UAE leads with USD 2.11 billion, followed by Saudi Arabia at USD 1.63 billion and South Africa at USD 1.19 billion.
- The rest of MEA contributes USD 2.64 billion.
Latin America
- Brazil leads with USD 2.3 billion, followed by Argentina at USD 1.04 billion.
- The rest of Latin America accounts for USD 1.68 billion, reflecting growing demand for cashless transactions.
Payment Setup and Functionality Statistics, 2025
- Disconnected payment systems remain common, with 58.5% of businesses relying on separate tools, providers, and workflows.
- Flexible payment operations remain uncommon, with only 11.7% of businesses able to quickly respond to changing market and customer needs.
- Manual payment links remain the primary collection method for 19.0% of businesses.
- Provider-hosted payment pages with company branding are used by 26.3% of businesses.
- Advanced payment tools, including subscription management and fraud prevention, have reached 21.5% adoption.
- AI/ML-based payment solutions stay in the early stages of adoption, with only 8.3% of businesses using them.
Payment Feature Adoption
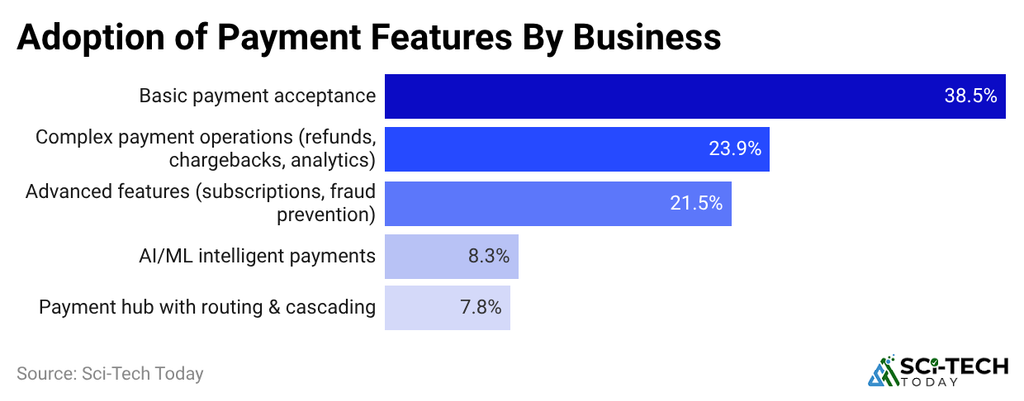
- Basic payment acceptance leads at 38.5%, while complex operations account for 23.9%.
- Advanced features, including subscriptions and fraud prevention, reach 21.5%.
- AI/ML payments account for 8.3%, while payment hubs with routing and cascading represent 7.8%.
Key Global Payment Trends and Statistics
- The 11th annual Global Payments Report 2026, published by Worldpay (now Global Payments), covers 42 markets and includes insights from 63,000 consumers.
- The report highlights 5 major payment trends, including payment apps, glocalization, digital wallets, buy now, pay later, and cryptocurrency.
- Payment apps are projected to account for 46% of global point-of-sale transaction value by 2030, reaching USD 15.6 trillion.
- Worldpay’s 2026 report shows that digital wallets accounted for 56% of global online spending and 33% of in-store spending in 2025.
- Global BNPL e-commerce payment value is forecast to reach USD 500 billion by 2030.
- Direct cryptocurrency payments currently account for 0.19% of global transaction value.
Global Payment Methods Statistics, 2026
- Scoop Market.us reported that digital wallets are projected to lead online payments with a 54% share.
- Credit cards are expected to account for 16%, while debit cards and A2A transfers each represent 10%.
- BNPL is forecast to capture 6% of online payment transactions.
- For in-store payments, digital wallets are expected to lead with 43%, followed by credit cards at 24% and debit cards at 19%.
- Cash is projected at 10%, while POS financing and prepaid cards each account for 2%.
Global Payment Fraud Data
- Corefy reported that in 2026, around 98% of merchants experienced at least one type of fraud attack in the past 12 months.
- Global payment card fraud losses are projected to reach USD 41.06 billion by 2030.
- E-commerce fraud is expected to cost merchants USD 66.4 billion in 2026.
- Only 17% of organizations currently use AI to detect and prevent payment fraud.
- Refund and policy abuse remain the most common types of fraud, affecting 41% of businesses.
Global Payment Platforms: Website Adoption and Market Share in 2026
| Provider | Websites / Customers | Share |
| PayPal | 1,575,947 | 18.87% (18.9%) |
| Apple Pay | 1,289,279 | 15.44% |
| Shop Pay | 1,209,437 | 14.49% |
| Visa | 900,852 | 10.79% |
| Mastercard | 900,452 | 10.78% |
| American Express | 831,257 | 9.96% |
| Google Pay | 774,427 | 9.28% |
| Stripe | 237,763 | 2.85% |
| Klarna Checkout | 199,350 | 2.39% |
| Venmo | 164,541 | 1.97% |
| UnionPay | 142,888 | 0.09% |
| Amazon Pay | 68,174 | 0.82% |
| Square | 24,746 | 0.3% |
| Recharge | 20,445 | 0.24% |
| Razorpay | 14,643 | 0.18% |
| Mercado Pago | 10,616 | 0.13% |
| Givebutter | 9,217 | 0.11% |
| authorize.net | 8,933 | 0.11% |
| Braintree | 5,184 | 0.06% |
| Paddle | 4,262 | 0.05% |
| Plaid | 3,915 | 0.05% |
| Chargebee | 2,442 | 0.03% |
Payment Service Provider Usage Statistics, 2026
- Around 66.5% of surveyed businesses use multiple payment service providers.
- Meanwhile, 40.9% of businesses operating in a single country rely on just one provider.
- Among globally operating businesses, 24.5% work with 10 or more providers.
- 27% of businesses need several months to integrate a new provider, while 43.9% can add a provider or payment method within a few days or almost instantly.
- Among businesses processing over 500,000 monthly transactions, 43.5% use 10 or more providers.
- Payment-hub adoption reaches 8.7% among businesses using 2-4 providers and 15.5% among those using 5-9.
- Companies working with over 10 providers show higher adoption, at 30.4%.
High-Risk and Regulated Payment Market
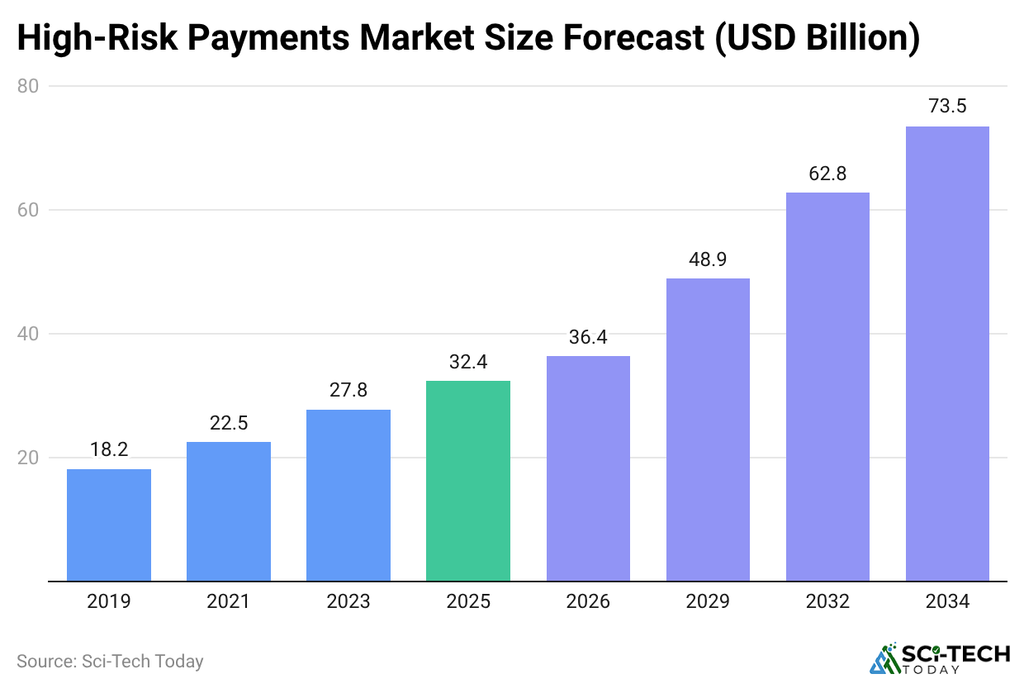
- The global high-risk payments market is projected to reach USD 36.4 billion by 2026, growing at a 10.7% CAGR.
- According to Corefy, around 75% of high-risk businesses use multiple payment providers, while 28% use more than 10.
- Payment disruptions remain a challenge, affecting 25% of regulated businesses.
- Around 37.5% of high-risk businesses cannot track gateway-related payment declines.
- Only 15.6% of regulated businesses use advanced payment routing systems.
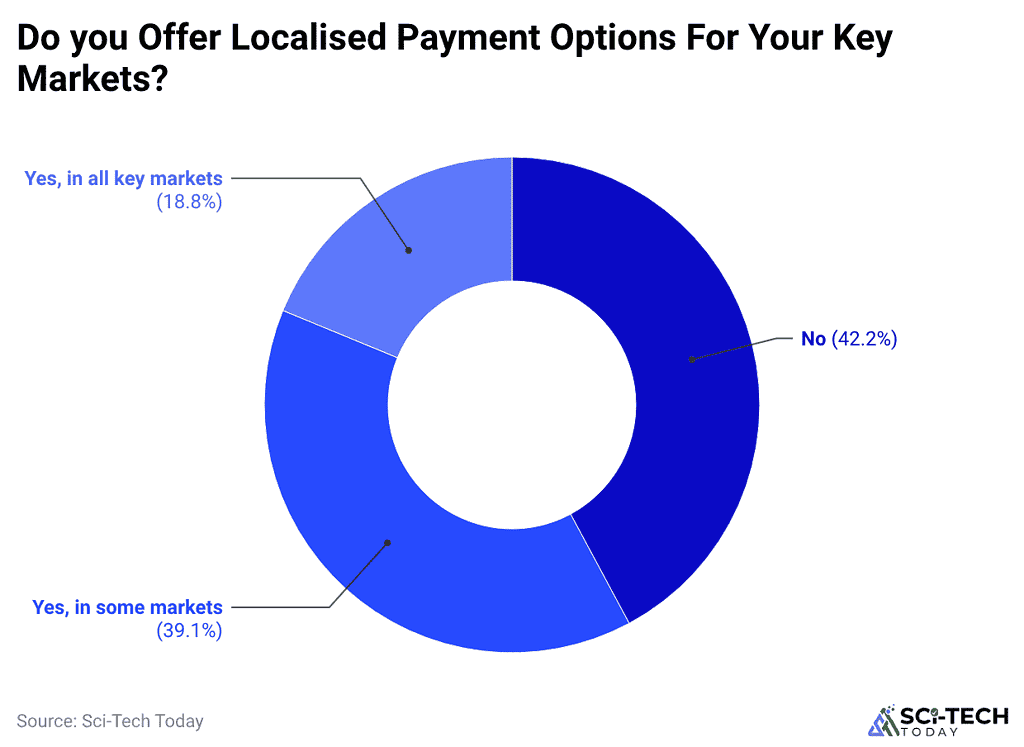
- Meanwhile, 42.2% of high-risk businesses do not adapt pricing or payment methods to local markets.
- Just 18.8% of high-volume businesses offer local payment options across key markets.
Payment as a Service Market Report
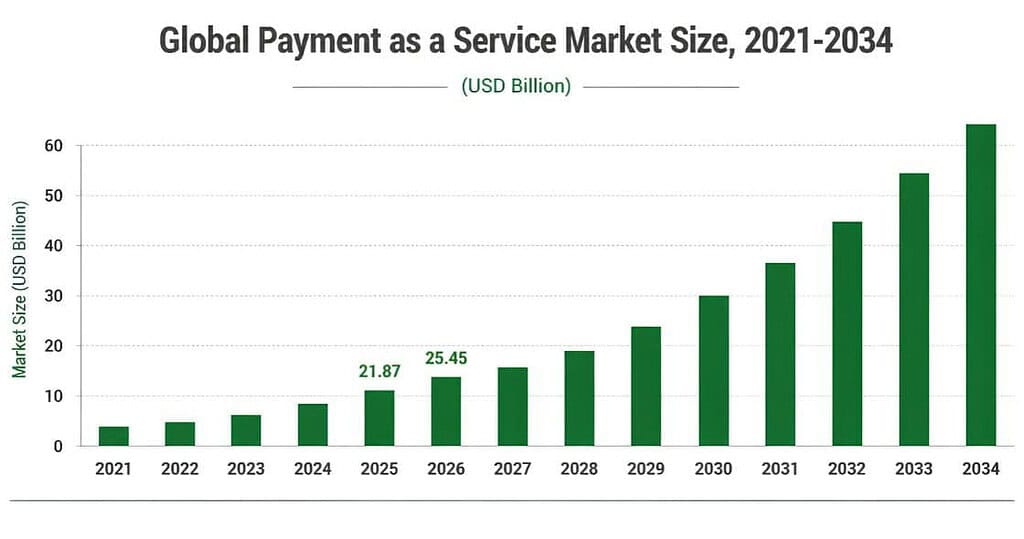
- The global Payment as a Service market is expected to reach USD 25.45 billion in 2026 and USD 85.51 billion by 2034, growing at a CAGR of 16.36% over that period.
- Regionally, North America led with a 35% market share in 2025, followed by Asia-Pacific at 30%, Europe at 27%, and the Rest of the World at 8%.
- Platform-based solutions accounted for 62% of the market, while services held 38%.
- Professional services represented 54% of the service segment, compared with 46% for managed services.
- By end-user industry, Media and Entertainment led with a 28% share, followed by Healthcare at 22% and Energy and Utilities at 18%.
Global Digital Payments Market Statistics
- Statista reported that the global digital payments market is projected to reach USD 37,448.48 billion in transaction value in 2026.
- At a 4.31% CAGR (2026-2031), the market is expected to grow to USD 46,250.99 billion by 2031.
- Mobile POS payments are projected to lead the market, with a transaction value of USD 28,320.37 billion in 2026.
- The United States is expected to record the highest transaction value globally, reaching USD 10,857.14 billion.
Global Ecommerce Payment Outlook
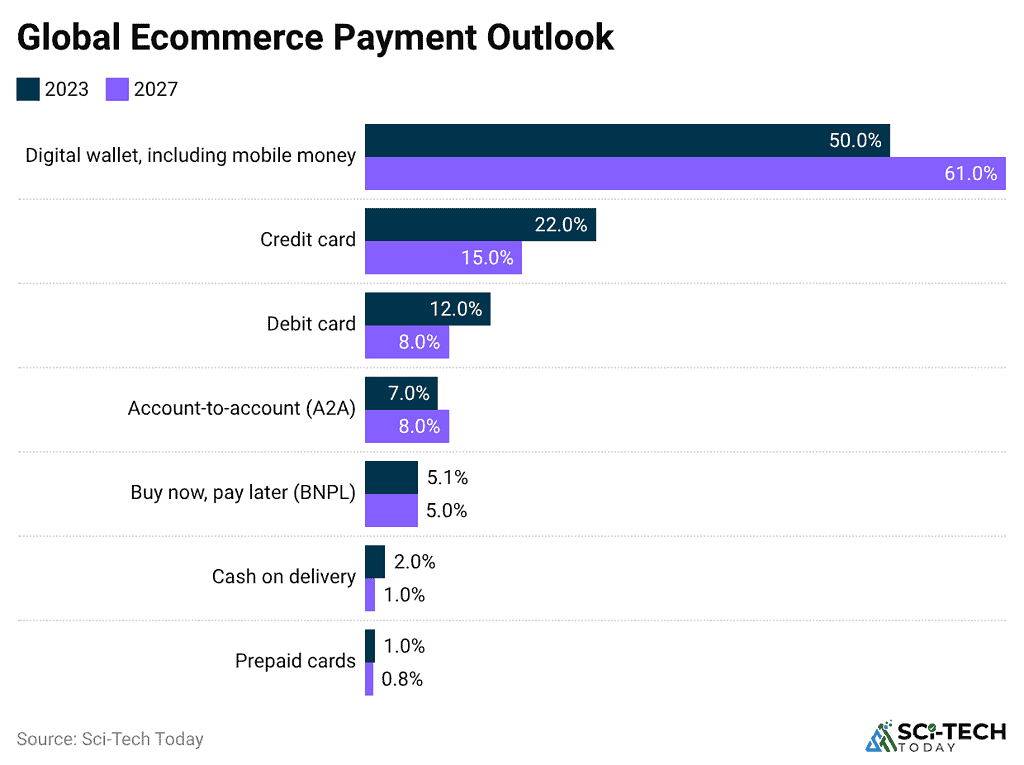
- By 2027, digital wallets, including mobile money, are projected to lead global e-commerce payments, accounting for 61% of the market.
- Credit cards are forecast at 15%, while debit cards and account-to-account payments each represent 8%.
- Buy now, pay later is projected at 5%, followed by cash on delivery at 1% and prepaid cards at 0.8%.
Payment Processing Market Outlook
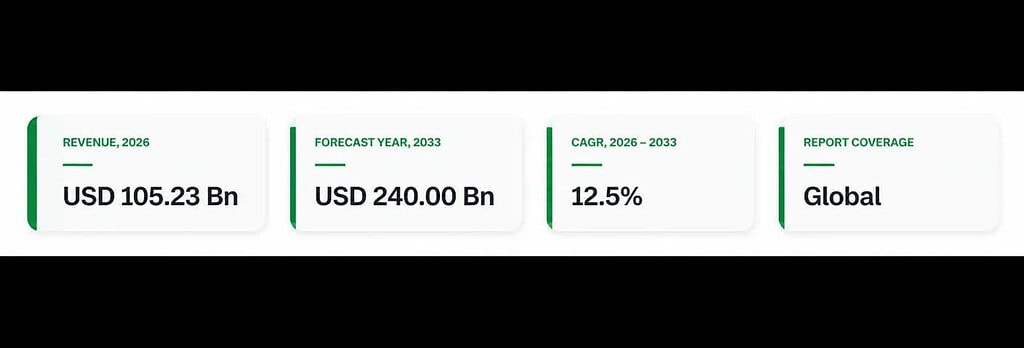
- The global payment processing solutions market is estimated at USD 105.23 billion in 2026.
- The market is projected to reach USD 240 billion by 2033.
- This represents a compound annual growth rate of 12.5% during 2026-2033.
- Credit cards lead with a 45.2% market share.
- Debit cards account for 32%, while e-wallets hold 22.8%
- In 2026, North America leads with 31.70% market share, followed by Asia-Pacific at 28.6% and Europe at 20.2%.
Merchant Payment Method Acceptance Statistics, 2026
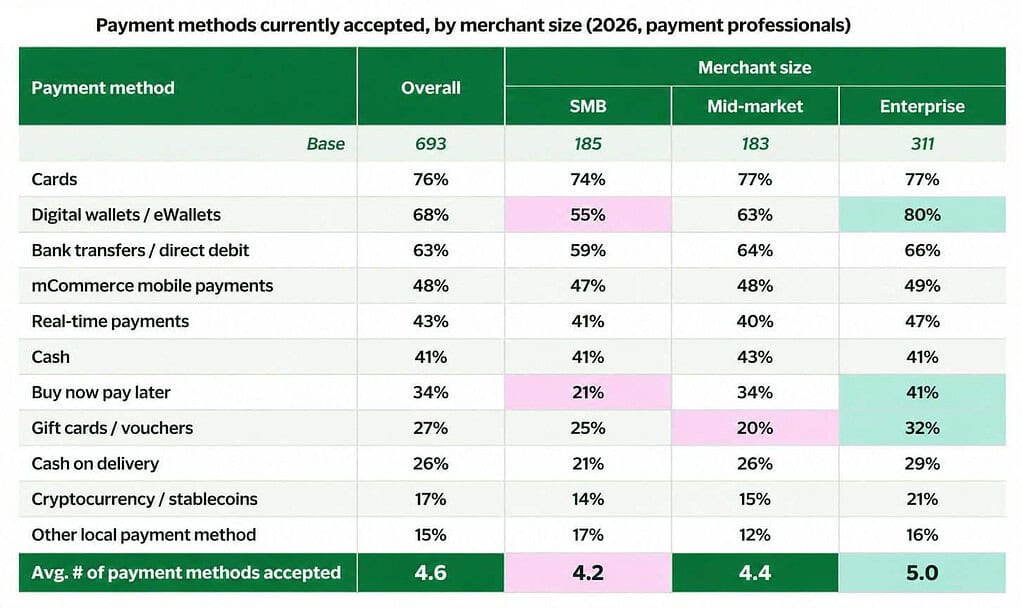
- Cards: Remain the most widely accepted method, with 76% overall adoption. Acceptance reaches 74% among SMBs and 77% across both mid-market and enterprise businesses.
- Digital wallets: Enterprise adoption leads at 80%, compared with 63% for mid-market firms and 55% for SMBs. Overall acceptance stands at 68%.
- Bank transfers and direct debit: 63% of businesses accept these methods, including 59% of SMBs, 64% of mid-market firms, and 66% of enterprises.
- Mobile commerce payments: Adoption remains consistent across business sizes, ranging from 47% to 49%, with an overall rate of 48%.
- Real-time payments: Overall acceptance reaches 43%, while SMBs, mid-market firms, and enterprises record 41%, 40%, and 47%, respectively.
- Cash: Despite growing digital payments, 41% of businesses still accept cash, including 41% of SMBs, 43% of mid-market firms, and 41% of enterprises.
- Buy now, pay later (BNPL): Acceptance stands at 34% overall, with enterprises leading at 41%, followed by mid-market firms at 34% and SMBs at 21%.
Online Payment Management Statistics, 2025
- Nearly 60% of companies handle payment management as a general administrative task or an additional responsibility.
- Among businesses processing 5K-100K monthly transactions, dedicated Payment Managers represent the largest ownership group at 35.7%.
- Payment Manager job descriptions focus 55% on operations, 34% on strategy, and 11% on both.
- Reporting and analytics appear 69% more often than payment service provider management.
- Data and analytics account for 15.4% of required hard skills, while collaboration (15.9%) and ownership (13.8%) lead soft skills.
- Engineering (30.2%) and Product (22.4%) are the main internal teams working with Payment Managers.
Final Thoughts
Digital payments have become a key part of everyday business, making Payment Service Providers more important than ever. They give businesses a simple, secure way to process transactions while reducing payment issues and fraud risk.
A reliable PSP can also make checkout easier for customers and help businesses reach more markets. As more people choose online and mobile payments, the demand for flexible, secure, and reliable payment solutions will continue to rise.
FAQ
PSPs support credit cards, debit cards, digital wallets, bank transfers, UPI, and buy-now-pay-later options.
A PSP manages the entire payment process, while a payment gateway securely transmits transaction data between merchants and banks.
Yes, PSPs support international payments across multiple currencies and countries.

Sources