





Opening
Black Friday Statistics: Black Friday is one of the biggest shopping events of the year. Every year, millions of people look for the best deals on electronics, clothing, home products, beauty items, and more. What started as a one-day sale in the United States has now become a global shopping event. Today, many retailers offer discounts for several days or even weeks, both online and in stores. As online shopping continues to grow, Black Friday plays a major role in holiday spending and retail sales worldwide.
In this article, you’ll discover the latest Black Friday statistics, consumer shopping trends, online sales figures, and key insights that show how this event continues to shape the retail industry.
Editor’s Pick
- Black Friday 2025 is projected to generate over USD 11 billion in U.S. ecommerce sales, up 8.7% year over year.
- Black Friday and Cyber Monday have evolved into an extended holiday shopping season rather than two standalone sales events.
- Around 45% of consumers began their holiday shopping before November, highlighting the shift toward early purchasing.
- A record 202.9 million people shopped during Thanksgiving weekend in 2025.
- 134.9 million consumers shopped online, while 129.5 million visited physical stores.
- Nearly 89% of shoppers used AI tools, with AI-driven traffic increasing almost 700% year over year.
- Mobile devices generated a record 56.4% of online holiday revenue.
- Holiday BNPL spending reached USD 20 billion, with over 25% of shoppers planning to use it.
- Email promotions influenced 59.2% of Black Friday purchases, outperforming all other marketing channels.
- The United States led planned Black Friday spending globally at USD 1,061 per shopper.
Black Friday 2025 Market Overview
- Black Friday 2025 is expected to generate more than USD 11 billion in U.S. ecommerce sales, marking an 8.7% year-over-year increase, according to Hostinger.
- Higher online sales indicate stronger consumer demand, more retail competition, and wider discount offerings.
- More than 50% of shoppers worldwide now purchase products online, while around 40% research products digitally before buying in physical stores.
- Black Friday and Cyber Monday have expanded into a longer holiday shopping season instead of two single-day events.
- Around 45% of consumers started their holiday shopping before November, showing that early shopping continues to grow.
- These Black Friday statistics highlight consumer spending, shopping behavior, device preferences, demographics, and marketing performance.
- Hostinger’s 2024 survey of 1,000 U.S. consumers provides valuable historical insights into Black Friday and Cyber Monday shopping habits, spending patterns, and product preferences.
Holiday Shopping Started Earlier and Lasted Longer
- According to Experian, Black Friday 2025 recorded a record 202.9 million Thanksgiving weekend shoppers, up from 197 million in 2024.
- Around 45% of consumers planned to begin holiday shopping before November.
- By Thanksgiving weekend, 84% had already started shopping.
- Another 62% expected to continue buying throughout December.
- These figures show that Black Friday is now part of a much longer holiday shopping season rather than a single shopping event.
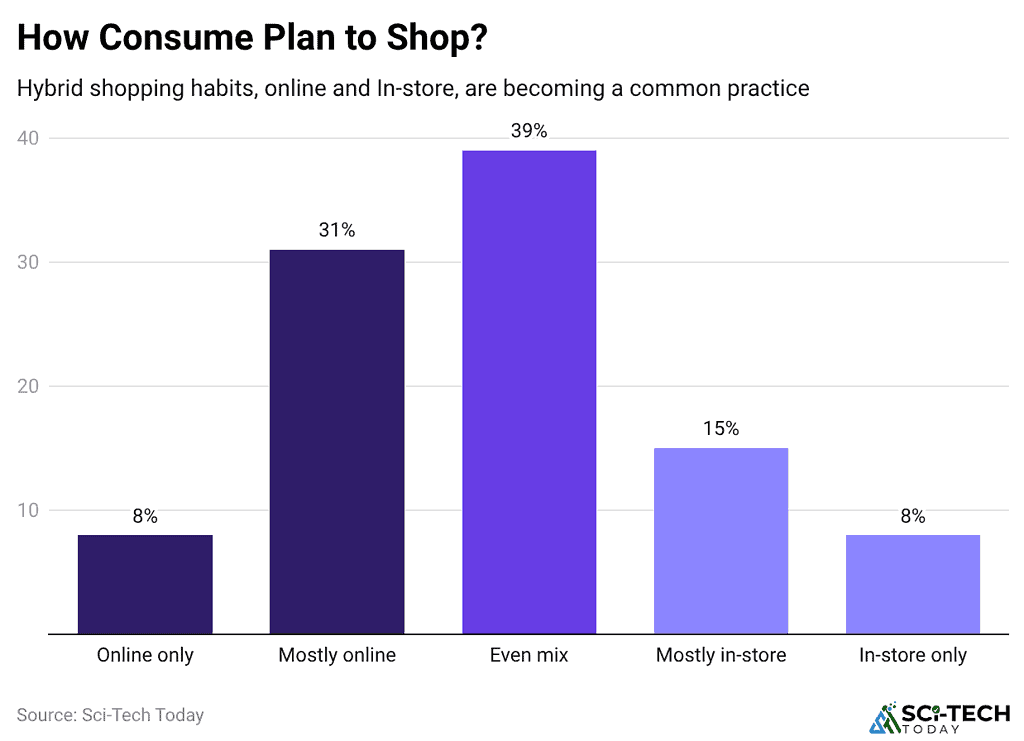
Consumers Used Both Online and Physical Stores
- Consumers combined digital and in-store shopping throughout the holiday season.
- Around 134.9 million people shopped online during Thanksgiving weekend.
- Physical stores welcomed 129.5 million shoppers.
- Black Friday remained the busiest shopping day, while Sunday set a new record for in-store visits.
- Retailers benefited from offering a smooth experience across online and offline channels.
AI and Mobile Changed Shopping Behavior
- AI and mobile technology became essential shopping tools during 2025.
- Around 89% of consumers used AI while shopping during the holidays.
- About 42% used AI to find gift ideas, while AI-driven website traffic increased by nearly 700% compared with the 2024 holiday season.
- AI-generated traffic achieved 31% higher conversion rates than traditional traffic.
- Mobile devices accounted for a record 56.4% of online holiday revenue.
Value Remained the Top Priority
- Consumers focused on affordability instead of simply chasing discounts.
- Average basket sizes increased by 5%, showing shoppers bought more items per order.
- However, the average amount spent per item declined from USD 47 to USD 45.
- Holiday Buy Now, Pay Later (BNPL) spending reached USD 20 billion.
- More than 25% of shoppers planned to use BNPL.
Black Friday Marketing Channels Statistics
(Reference: imagedelivery.net)
- Email offers have the strongest influence on Black Friday and Cyber Monday purchases, with 59.2% of consumers choosing them.
- Social media ads affect 39.4% of shoppers, while search engine ads influence 38.6%.
- TV and radio ads impact 35.2% of buying decisions.
- Influencer recommendations have the lowest influence, with 13.5% of consumers relying on them for purchase decisions.
Top Reasons for Reduced Holiday Spending
- According to Black Friday Statistics, 78% of people say the rising cost of living is the major reason for spending less during the season, while 67% cite the same for grocery costs.
- In addition, inflation (60%), interest rates (25%), and the number of people shopping for less(19%) were other leading causes of the same.
- Around 17% said they have job uncertainty, and student loan repayments were told by 13% of the shoppers.
Popular Black Friday Electronic Products
According to Doofinder, gaming devices are the most popular gift choice worldwide, with more than 102k sales worldwide during the season.
| Product name | Black Friday sales in numbers |
| Nintendo Switch | 102k + |
| Apple Watch | 46.2k+ |
| AirPods | 46k+ |
| iPhone | 32.8k |
| PS5 | 31.8k |
| iPad | 31.4k |
| Airpods Pro | 31.1k |
| Dyson Airwrap | 27.3 |
| PS4 | 18k |
| iPhone 13 | 11.7k |
(Source: doofinder.com)
Black Friday and Cyber Monday Consumer Interest Statistics in the United States
- According to a report shared by YouGov, consumer interest in Black Friday and Cyber Monday declined in 2025, with 36% reporting lower interest, while only 11% said they were more interested.
- Shopping participation varied widely, as only 42% of less-interested consumers planned to shop compared with 87% of more-interested shoppers.
- Spending also became more cautious, with 31% of less-interested consumers expecting to spend less, while only 2% planned to spend more.
- Interest dropped more among women (39%) than men (33%), with Gen X and Baby Boomers also showing lower participation.
- AI shopping tools remained more popular among interested shoppers, with only 6%-7% of less-interested consumers planning to use them compared with about 34% of more-interested shoppers.
Interest in Mega Sales Events Statistics
(Reference: yougov.com)
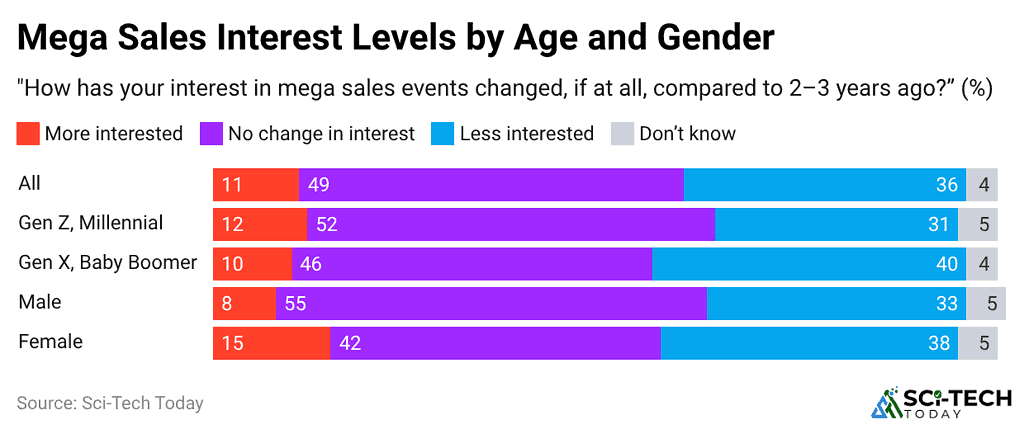
- Overall, 11% of consumers are more interested in mega sales events than 2–3 years ago, 49% report no change, 36% are less interested, and 4% are unsure.
- Among Gen Z and Millennials, 12% are more interested, 52% report no change, 31% are less interested, and 5% do not know.
- For Gen X and Baby Boomers, 10% are more interested, 46% report no change, 40% are less interested, and 4% are unsure.
- Among men, 8% are more interested, 55% report no change, 33% are less interested, and 5% are unsure.
- Women show stronger enthusiasm, with 15% reporting more interest, while 42% report no change, 38% are less interested, and 5% do not know.
Black Friday Spending Channels
- According to news.adobe.com, in 2026, consumers started shopping earlier in the season, helping Black Friday reach USD 11.8 billion in online sales with a 9.1% year-over-year increase.
- Mobile commerce is projected to generate 57%-58% of online Black Friday sales in 2026, up from 56.4% of U.S. online holiday revenue in 2025.
- Desktop and laptop shopping is expected to account for 42%-43% of online sales, remaining important for product research and high-value purchases.
Black Friday and Cyber Monday Shopping Intent by Country
(Reference: statista.com)
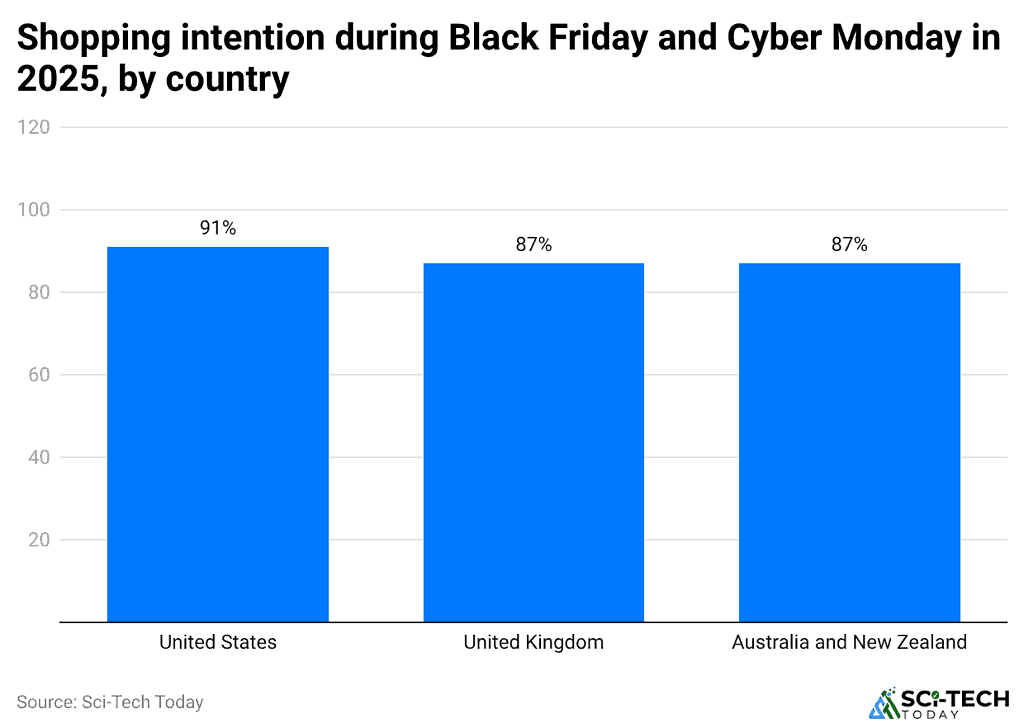
- The United States recorded the highest shopping interest, with 91% of consumers planning to shop during Black Friday and Cyber Monday.
- The United Kingdom, Australia, and New Zealand followed closely, with 87% of consumers in each country intending to participate.
Planned Black Friday and Cyber Monday Spending by Country, 2025
- The United States leads planned spending at USD 1,061, followed by Australia (USD 851), the United Kingdom (USD 847), and New Zealand (USD 836).
- Canada (USD 812), Germany (USD 738), France (USD 706), Spain (USD 653), and Italy (USD 611) complete the list of top planned holiday spending markets.
Trust in Black Friday Offers by Online Shoppers, 2025
- Statista reported that Trust in Black Friday offers was highest in India (79%), followed by the United Arab Emirates (78%), South Africa (77%), Brazil (75%), Mexico (74%), China (72%), and the United States (69%).
- Trust was lower in Canada (67%), Australia (64%), the United Kingdom (63%), Germany (58%), France (56%), Italy (54%), and Japan (47%).
United States Black Friday Promotion Channels by Age, 2025
| Marketing Channel | Gen Z (18-27) | Millennials (28-43) | Gen X (44-59) | Baby Boomers (60+) |
| Email promotions | 35% | 49% | 66% | 74% |
| Social media ads | 61% | 52% | 32% | 18% |
| Search engine ads | 45% | 43% | 36% | 28% |
| TV and radio ads | 18% | 24% | 43% | 56% |
| Influencers/content creators | 34% | 21% | 9% | 3% |
United Kingdom Consumer Shopping Intent for Black Friday and Cyber Monday, 2025
- According to Statista, 87% of consumers in the United Kingdom planned to shop during the Black Friday and Cyber Monday sales in 2025.
- The UK ranked among the leading markets for holiday shopping, matching Australia and New Zealand, while only the United States recorded a higher shopping intention at 91%.
Most Popular Black Friday Product Categories in Italy, 2025
| Product Category | Share of Consumers |
| Clothing, Shoes & Accessories | 58% |
| Consumer Electronics | 47% |
| Beauty & Personal Care | 34% |
| Home & Kitchen Products | 31% |
| Toys & Games | 26% |
| Food & Beverages | 24% |
| Sports & Outdoor Equipment | 21% |
| Books, Music & Entertainment | 18% |
| Furniture & Home Décor | 16% |
| Jewellery & Watches | 13% |
Best Sources for Black Friday Deals
| Places | Share of consumers |
| Amazon | 59% |
| Search Engines | 32% |
| Retailer sites | 19% |
| Brand websites | 18% |
| Personalised communications | 16% |
| Don’t do anything | 16% |
| TV advertisements | 15% |
| Stores | 12% |
| Social media | 12% |
| Comparison Sites | 12% |
| Online reviews | 11% |
| Online digital advertising | 10% |
| Listen to influencers | 8% |
| If not discounted, I do not want to buy it | 8% |
| YouTube Ad | 7% |
| Direct mail | 5% |
| Print advertisements | 3% |
| Promotion from gaming influencers and streamers | 2% |
(Source: statista.com)
Consumers Planning to Shop the November Sales Events Worldwide
Based on the Statista survey, around 78% of shoppers around the world showed their overall interest in shopping through different expressions.
| Country | Definitely | Probably | Probably not | Not | Don’t know |
| US | 43% | 34% | 12% | 6% | 5% |
| Poland | 39% | 39% | 8% | 5% | 10% |
| Canada | 38% | 39% | 11% | 5% | 6% |
| Germany | 35% | 34% | 13% | 9% | 9% |
| Australia | 28% | 32% | 18% | 13% | 9% |
| UK | 27% | 37% | 18% | 9% | 9% |
| Switzerland | 20% | 37% | 19% | 13% | 11% |
Black Friday Frenzy – A Shopping Extravaganza Explained
Black Friday is a major shopping day in the United States. It takes place the day after Thanksgiving, and it always falls on the fourth Thursday of November. In 2024, Black Friday will be on November 24th. It’s traditionally known for massive discounts and sales offered by retailers, both in physical stores and online. This kickstarts the holiday shopping season in the US, with many consumers waiting for these deals to grab Christmas gifts and other items at a reduced price.
While Black Friday originated in the US, the concept of big sales events on this day has spread to other countries in recent years, including Canada, the United Kingdom, Mexico, and Australia. However, the level of enthusiasm and participation varies from country to country.
Why the Shopping Frenzy?
The reasons behind Black Friday shopping are multifaceted. Here are some key drivers:
- Saving Money: For many shoppers, Black Friday presents an irresistible opportunity to save significant money on desired items. With discounts ranging from 20% to even 70% off, it can be a great way to stretch their holiday shopping budget.
- Gift-giving Advantage: With Christmas just around the corner, Black Friday allows people to buy gifts for friends and family at a bargain price. This helps them manage their holiday spending and get more gifts for their loved ones.
- Retail Therapy: The holiday season can be stressful, and Black Friday shopping can serve as a fun activity and a way to de-stress. The excitement of finding good deals and the festive atmosphere in stores can be a mood booster for some.
- Marketing Hype: Retailers heavily advertise Black Friday sales, creating a sense of urgency and excitement. This marketing blitz pushes consumers to participate in the shopping frenzy to avoid missing out on incredible deals.
Wrap-Up
Black Friday is one of the biggest shopping events of the year, helping retailers increase sales and giving shoppers great deals. Online shopping, mobile apps, and personalized offers continue to make the event more popular every year.
These Black Friday statistics show changing shopping habits, top-selling products, and market trends. Businesses can use these insights to improve their sales strategies, while shoppers can make smarter buying decisions during the busy holiday shopping season.
FAQ
Electronics, clothing, home appliances, furniture, beauty products, toys, and fashion items often receive substantial discounts.
No. Many countries, including the UK, Canada, Australia, and India, now participate in Black Friday sales.
Black Friday includes both online and in-store sales, whereas Cyber Monday primarily features online-exclusive deals.