






Preface
Amazon Statistics: Amazon started as an online bookstore in 1994 and has grown into one of the world’s biggest technology companies. Today, millions of people use Amazon to shop, stream movies, read books, store data in the cloud, and access smart devices. The company also leads in cloud computing through AWS and continues to expand its reach in artificial intelligence, digital advertising, and logistics. With a strong global presence and billions in annual revenue, Amazon plays a major role in the digital economy.
This article highlights the latest Amazon statistics, including revenue, AWS growth, Prime members, customer trends, workforce, market share, and other key facts that show the company’s size, growth, and global impact.
Top Choice
- Amazon operates one of the world’s largest e-commerce ecosystems, with 310-315 million active consumer accounts globally in 2026.
- Amazon Prime membership surpassed 240-250 million users worldwide, generating around USD 49.6 billion in subscription revenue in 2025.
- Amazon reported USD 742.77 billion in trailing 12-month revenue, showing continued business expansion.
- Amazon Web Services (AWS) remained a major growth driver, generating USD 137.05 billion in TTM revenue.
- Amazon.com attracted around 2.3-2.7 billion monthly visits in 2026, highlighting strong global engagement.
- The United States remained Amazon’s largest market, generating approximately USD 426.31 billion in FY2025 revenue.
- Prime Day 2026 achieved record performance with estimated global sales of USD 26.4 billion, up 23% year on year.
- Amazon employed 1,576,000 workers worldwide at the end of 2025, with about 70% based in the U.S.
- Amazon’s advertising business reached USD 68.6 billion in revenue in 2025, becoming a major profit contributor.
- Around 99% of Amazon customers are repeat buyers, demonstrating exceptional customer loyalty and platform strength.
Recent Developments and Lesser-Known Facts
- Financial Times reported that Amazon plans to expand Project Kuiper with 5,105 low-Earth orbit satellites to provide direct-to-device mobile connectivity and compete with Starlink.
- The company expects to invest around USD 200 billion in 2026, according to Reuters.
- Amazon reported Q1 2026 net sales of USD 181.5 billion, reflecting a 17% year-over-year increase.
- Amazon Web Services (AWS) generated USD 37.6 billion in revenue during Q1 2026, growing 28% from the previous year.
- Amazon’s net income reached USD 30.3 billion, while operating income increased to USD 23.9 billion in Q1 2026.
- The company is redesigning Prime Video with AI-powered recommendations and voice-based features.
- AWS launched a Forward Deployed Engineering team to help enterprises implement agentic AI solutions faster.
- Amazon added OpenAI models and Codex to Amazon Bedrock, expanding AI development options.
- Amazon already operates hundreds of Project Kuiper satellites, strengthening its global satellite network.
- The company continues to expand AI training and workforce partnerships to prepare employees for future AI-driven technologies.
Amazon Revenue Highlights
(Resources: demandsage.com)
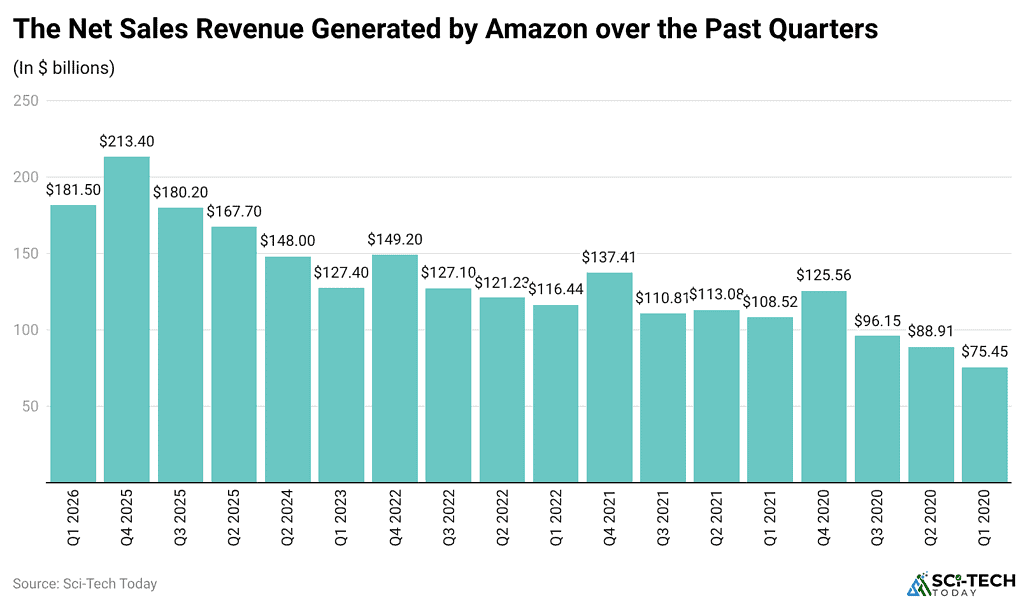
- Amazon reported Q1 2026 net sales of USD 181.5 billion, up 15% from USD 155.7 billion in Q1 2025.
- Excluding foreign exchange effects, the company’s revenue increased by 11%, showing steady business growth.
- Amazon’s Trailing Twelve Months (TTM) revenue reached USD 742.77 billion, reflecting a 3.61% year-over-year increase.
- Amazon reported net sales of USD 167.7 billion in Q2 2025, which increased to USD 180.2 billion in Q3 2025.
- Sales reached USD 213.4 billion in Q4 2025.
Amazon Advertising Revenue Statistics
- Amazon Ads is projected to generate USD 94 billion in global advertising revenue by 2026, up from USD 37.74 billion in 2022.
- In the U.S., Amazon’s advertising revenue is expected to increase from USD 27 billion in 2022 to USD 64 billion by 2026.
- Amazon’s advertising business generated USD 46.9 billion in 2023, USD 56.2 billion in 2024, and USD 68.6 billion in 2025.
Amazon Profit Analysis
- Amazon recorded a record profit of USD 77.7 billion in 2025, reflecting stronger profitability and improved profit margins.
- In Q1 2026, Amazon reported net income of USD 30.3 billion, an increase of 77.19% compared with Q1 2025.
- Despite higher earnings, free cash flow declined from USD 38 billion to USD 11 billion because Amazon invested USD 50.7 billion in infrastructure and equipment.
- Amazon’s quarterly profits in 2025 reached USD 17.127 billion (Q1), USD 18.164 billion (Q2), USD 21.187 billion (Q3), and USD 21.192 billion (Q4).
Amazon Revenue Statistics By Region and Business Segment
- In Q1 2026, North America remained Amazon’s largest market, generating USD 104.1 billion, up from USD 92.9 billion in Q1 2025, with 12% growth and contributing 57.4% of total revenue.
- The International segment increased from USD 33.5 billion to USD 39.8 billion, recording 19% growth and accounting for 21.9% of revenue.
- AWS revenue rose from USD 29.3 billion to USD 37.6 billion, delivering the highest growth of 28% and contributing 20.7% of total revenue.
By Channel
(Source: stockanalysis.com)
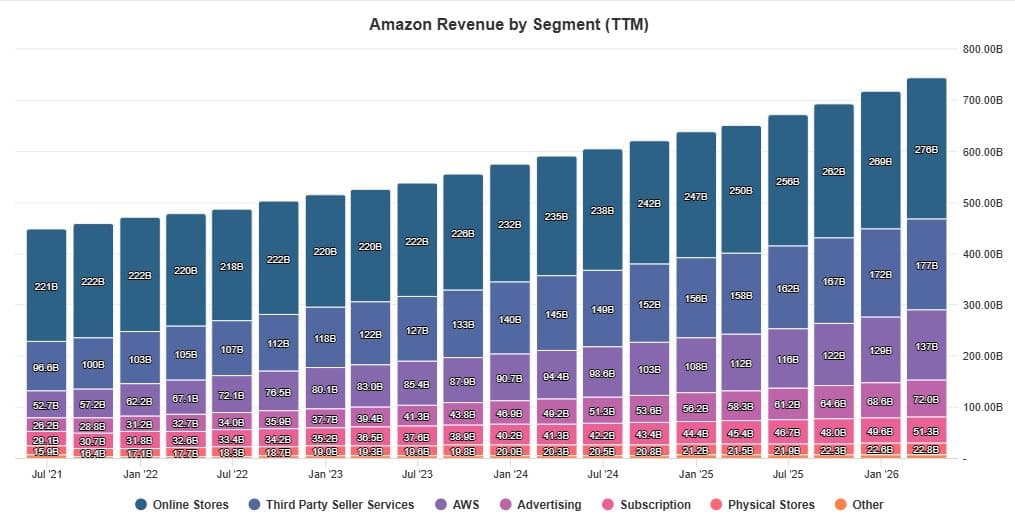
- As of March 31, 2026, Amazon generated USD 742.78 billion in TTM revenue across all business segments.
- Online Stores remained the largest segment with USD 276.13 billion, followed by Third-party Seller Services (USD 177.23 billion) and AWS (USD 137.05 billion).
- Advertising generated USD 71.96 billion, while Subscription Services, Physical Stores, and Other Services contributed USD 51.33 billion, USD 22.81 billion, and USD 6.27 billion, respectively, demonstrating Amazon’s diversified revenue portfolio.
- As of March 31, 2026, Amazon’s revenue is led by online stores at 37.18% and third‑party seller services at 23.86%, followed by AWS at 18.45% and advertising at 9.69%.
- Subscription services contribute 6.91%, while physical stores and other activities add 3.07% and 0.84%.
By Business Line
- According to Demand Sage, in Q1 2026, Amazon’s Online Stores generated USD 64.3 billion, followed by Third-party Seller Services at USD 41.6 billion, AWS at USD 37.6 billion, Advertising Services at USD 17.2 billion, and Subscription Services at USD 13.4 billion.
- Physical Stores contributed USD 5.8 billion, while the Other segment generated USD 1.6 billion; among all business lines, AWS recorded the highest growth at 28%, followed by Other (25%), Advertising Services (24%), Subscription Services (15%), Third-party Seller Services (14%), Online Stores (12%), and Physical Stores (5%).
By Products, Services, and Sales Trends
- Net product sales reached USD 71.3 billion, up 11.58% from USD 63.9 billion, while net service sales grew to USD 110.2 billion, up 20.31% from USD 91.6 billion.
- During H1 2025, Amazon recorded USD 323.4 billion in net sales, compared with USD 291.3 billion in H1 2024, reflecting 11% growth. Product sales reached USD 132.2 billion (8%), while service sales increased to USD 191.2 billion (13%).
- Amazon’s quarterly revenue exceeded USD 140 billion from Q1 2024 through Q1 2026, rising from USD 143.3 billion to USD 181.5 billion and peaking at USD 213.4 billion in Q4 2025.
- Excluding foreign exchange effects, Q1 2026 growth was 8% in North America, 5% internationally, and 17% for AWS.
Amazon Web Services (AWS) Sales Revenue Statistics
- Amazon Web Services (AWS) generated USD 37.587 billion in net sales during Q1 2026, compared with USD 29.26 billion in Q1 2025.
- AWS revenue reached USD 35.579 billion in Q4 2025, USD 33.006 billion in Q3 2025, and USD 30.873 billion in Q2 2025.
(Resources: demandsage.com)
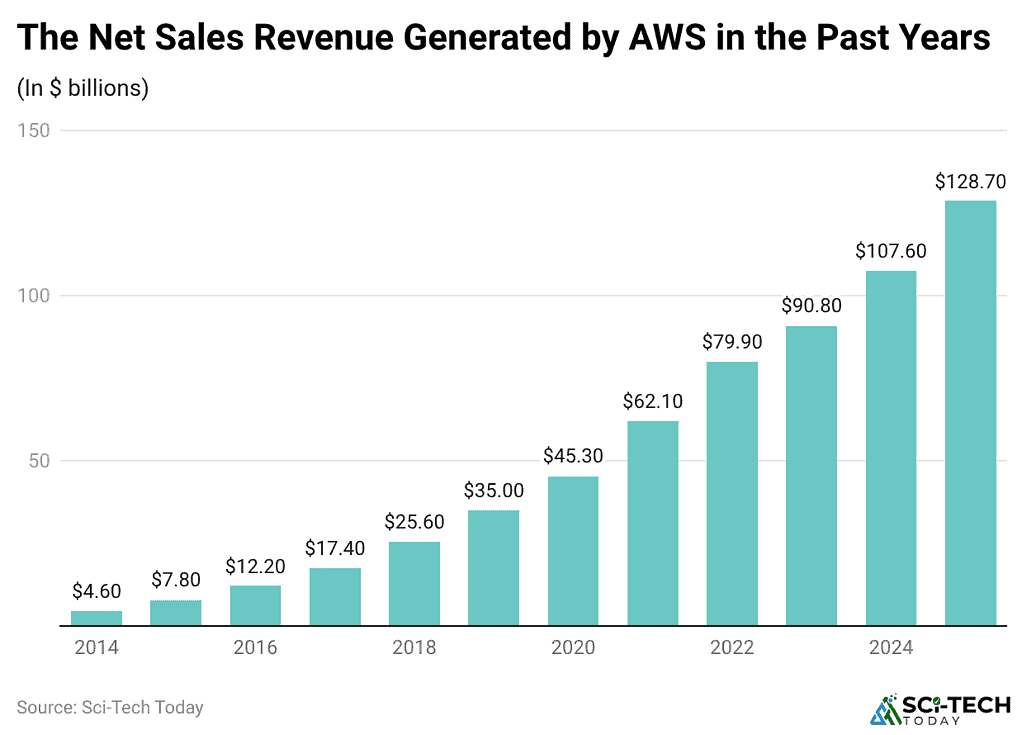
- For the full year 2025, AWS generated USD 128.7 billion in annual revenue.
Amazon Subscription Services Revenue
- In Q1 2026, Amazon’s subscription services revenue reached USD 12.4-13.4 billion, growing by approximately 12%-15% compared with 2025.
- Amazon generated USD 49.61 billion in subscription revenue during 2025.
- Subscription revenue remained above USD 10 billion annually over the past 3 years.
- In 2024, Amazon earned USD 44.3 billion from subscription services.
- Subscription revenue increased by USD 5.31 billion between 2024 and 2025.
Amazon Core User Base and Customer Value
- Yaguara reported that Amazon has approximately 310-315 million active consumer accounts worldwide in 2026, including around 230-255 million users in the United States.
- Global Prime membership has surpassed 240-250 million users, while the average customer spends about USD 3,231 annually on Amazon.
- Based on customer spending, Amazon’s user base represents nearly USD 1 trillion in yearly gross merchandise volume.
Amazon Users by Country Statistics
(Source: worldpopulationreview.com)
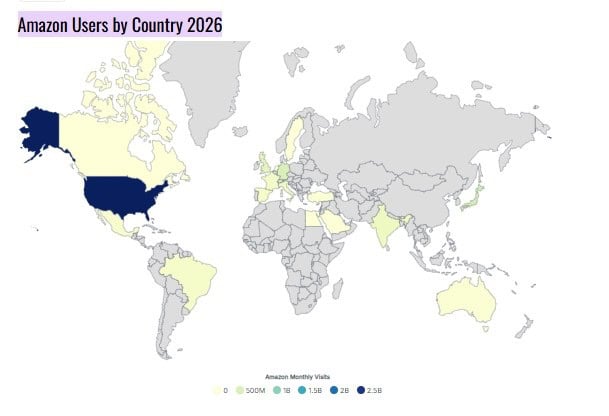
- The United States leads Amazon traffic in 2026 with 2.8 billion monthly visits, making it the platform’s largest user market.
- Japan ranks second with 548.2 million monthly visits, followed by Germany with 501.9 million.
- The United Kingdom records 388.7 million visits, while India reaches 263.6 million monthly visits.
- Italy completes the top 6 markets with 233.6 million monthly visits, showing Amazon’s strong global customer presence.
By Usage, Traffic, and Customer Loyalty
- Amazon.com receives around 2.3-2.7 billion unique visits per month in 2026, and the shopping app has about 197 million monthly active users globally.
- Around 52%-56% of consumers begin online product searches on Amazon, 57%-70% compare prices, and 73%-75% discover new brands through the platform.
- Amazon generates approximately USD 9,395 in sales per second, or about USD 33.8 million per hour, with 99% of customers returning as repeat buyers.
The following is a table showing why people prefer using Amazon:
| Reason | Percentage of users |
| Easy return process | 43.7% |
| Best Pricing | 49.2% |
| Prime membership | 65.7% |
| Broad collection of items | 69% |
| Fast and free shipping | 80% |
(Reference: capitaloneshopping.com)
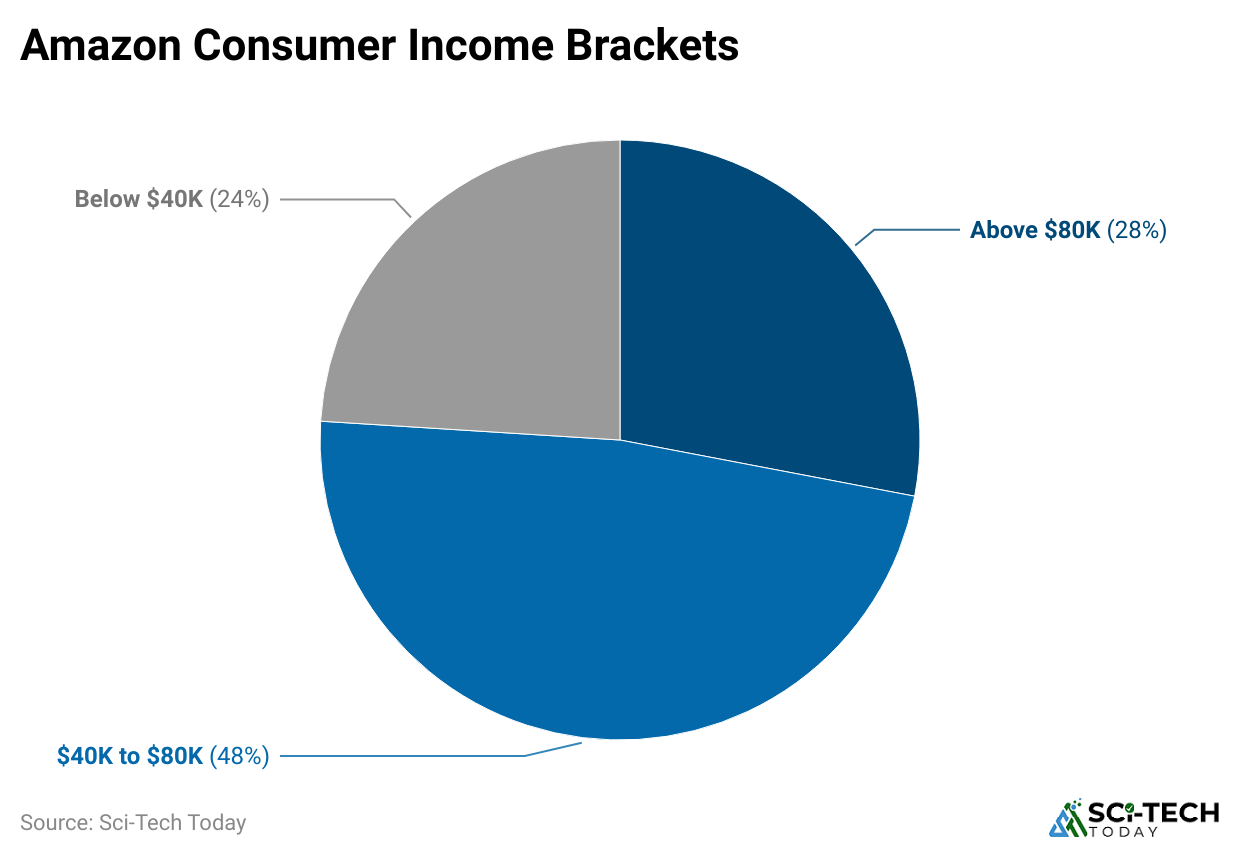
- In the above chart, we can see the Amazon Consumer Income Brackets.
- As per Amazon Statistics, around 75% of Amazon users are female.
- Nearly 24% of Amazon users are male, and 1% are identified as female or male.
- 38% of Amazon users stay in the suburbs, as per Amazon Statistics.
- Almost 34% of Amazon users are urban dwellers, whereas 29% are rural.
- Amazon users are generally middle-income earners, and 48% have a yearly salary between $40,000 to $80,000.
- Around 28% of Amazon users are from high-income households, and 24% are from low-income households, earning less than $40,000 each year.
(Reference: capitaloneshopping.com)
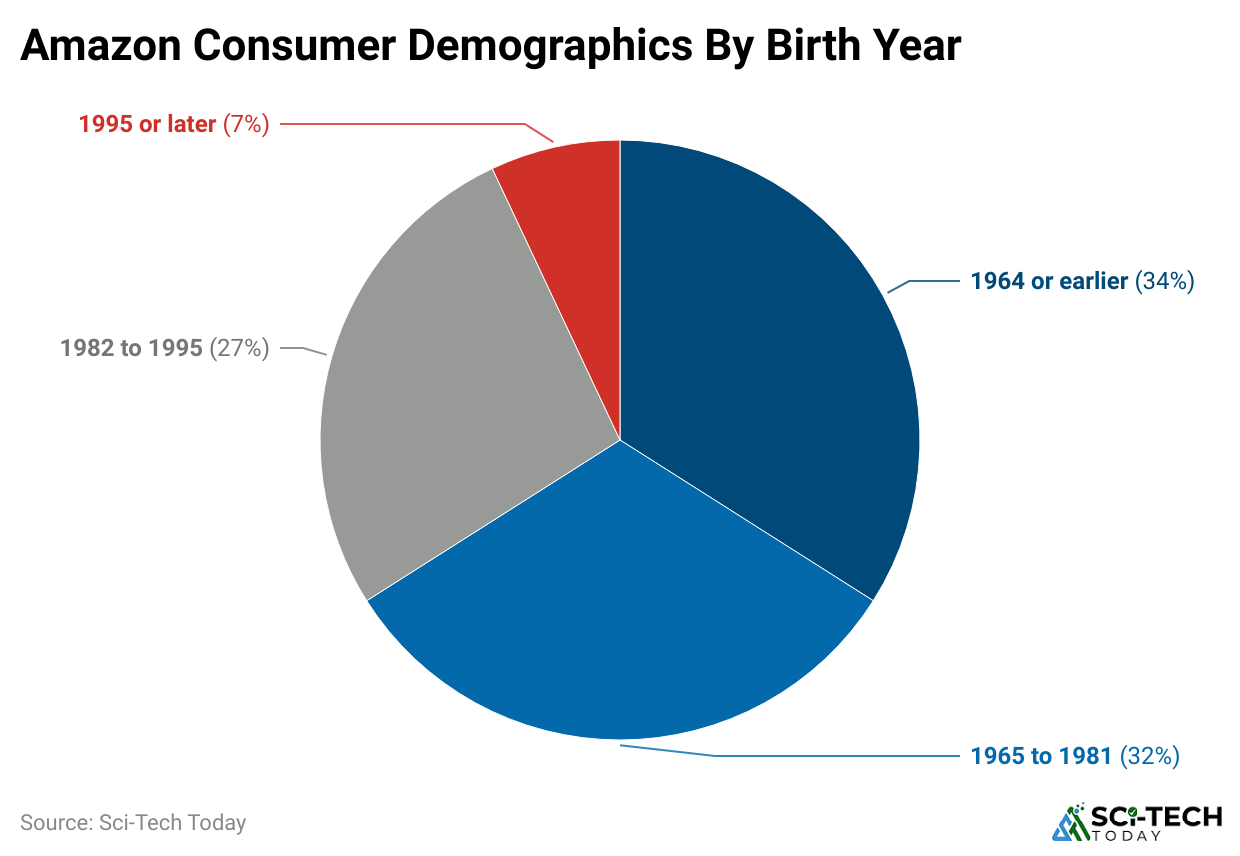
- In the above chart, we can see the Amazon users’ demographics by birth year.
- 32% of Amazon shoppers were born before 1965, according to Amazon Statistics.
- Of all age groups, those born before 1965 are the least likely to shop on Amazon, with just 56.6% making purchases.
- 27% of Amazon customers were born between 1982 and 1995, while only 7% were born after 1995.
- Amazon Statistics stated that 75.2% of people born after 1995 shop on Amazon.
- 4% of people born between 1980 and 1989 shop on Amazon.
- 34% of Amazon customers were born between 1965 and 1981.
Amazon Revenue by Top Countries
- The United States remained Amazon’s largest market, generating USD 426.31 billion in FY2025, with TTM revenue estimated at USD 440 billion in Q1 2026.
- Germany ranked second, contributing USD 40.86 billion in 2025, while its TTM revenue increased to an estimated USD 42-43 billion.
- The United Kingdom generated USD 37.86 billion in FY2025, with TTM revenue estimated at USD 39-40 billion.
- Japan recorded USD 27.40 billion in 2025, and its TTM revenue was estimated at USD 28-29 billion.
- Amazon’s International segment generated USD 161.89 billion in FY2025, rising to an estimated USD 170 billion in the TTM period.
- Other markets, including India, Canada, France, Italy, Spain, and Mexico, collectively generated USD 55.77 billion in 2025, with TTM revenue estimated at approximately USD 68 billion.
The following are the famous International Amazon Sites:
| Domain | Monthly Visits (in millions) | Annual revenue ( in billions) |
| amazon.es | 129 | $5.71 |
| amazon.ca | 150 | $4.12 |
| amazon.com.br | 152 | $4.04 |
| amazon.fr | 153 | $7.92 |
| amazon. it | 160 | $7.37 |
| Amazon.in | 286 | $16.98 |
| amazon.co.uk | 328 | $33.59 |
| amazon.de | 408 | $37.59 |
| amazon.co.jp | 533 | $26.00 |
| amazon.com | 2,200 | $395.64 |
Amazon Traffic Statistics by Overall Website Performance
(Source: semrush.com)
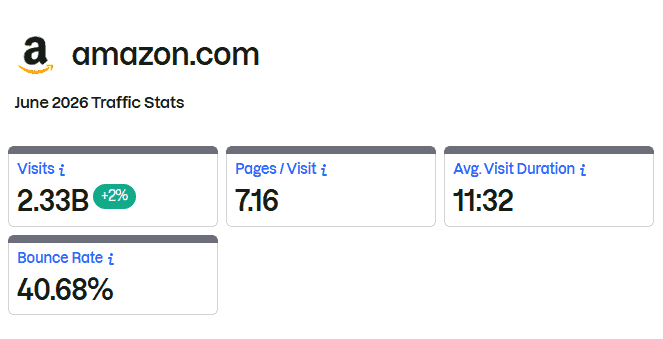
- As of June 2026, Amazon.com recorded 2.33 billion visits, ranking #12 worldwide, #5 in the United States, and #9 in the Online Services category.
- The website maintained an Authority Score of 100.
- Compared with May 2026, website traffic increased by 2.33%.
- Visitors viewed an average of 7.16 pages per visit and spent 11 minutes 32 seconds per session.
- The website recorded a 40.68% bounce rate.
By Device Usage
- Mobile devices generated 57.55% of total traffic, while desktop devices accounted for 42.45%.
By Country
| Country | Share of total traffic | Monthly visits | Desktop share | Mobile share |
| United States | 82.45 | 1.92 billion | 40.04% | 59.96% |
| India | 1.86 | 43.33 million | 31.61% | 68.39% |
| Canada | 0.93 | 21.61 million | 50.42% | 49.58% |
| United Kingdom | 0.90 | 21.03 million | 59.54% | 40.46% |
| Germany | 0.88 | 20.50 million | 55.70% | 44.30% |
Top Traffic Sources
- Direct traffic remained Amazon’s largest source, contributing 67.32% of all visits and increasing by 3.53%.
- Google organic search accounted for 14.74% of traffic, with a slight decline of 0.02%.
- Other leading sources included mail.google.com (1.39%, +5.14%), YouTube (1.25%, -3.05%), and PrimeVideo.com (0.68%, -29.05%).
Top Destinations After Amazon
- After leaving Amazon.com, users most commonly visited Google.com, which received 15.54% of outgoing traffic and recorded 24.46% growth, followed by YouTube with 8.18% of traffic and 111.1% growth.
- Facebook accounted for 3.07% of outgoing visits with 53.81% growth; Media-amazon.com received 2.20% with 9.73% growth, while Instagram recorded the fastest growth at 248.93%.
Amazon Prime Membership and Prime Day Revenue Statistics
- Amazon Prime members reached an estimated 230-250 million globally in 2025 and exceeded 240 million by mid-2026, with the U.S. contributing around 180-200 million subscribers, according to Backlinko.
- Prime membership revenue was approximately USD 49.6 billion in 2025, while Q1 2026 revenue reached about USD 11.8 billion, showing continued double-digit year-on-year growth.
- Prime Day 2025 generated nearly USD 24.1 billion in U.S. online sales, with around 300 million items purchased and average household spending of about USD 180.
- Prime Day 2026, held from June 23-26, became Amazon’s biggest Prime Day event, reaching an estimated USD 26.4 billion in global online spending.
- Prime Day 2026 sales increased by around 23% year on year.
(Reference: backlinko.com)
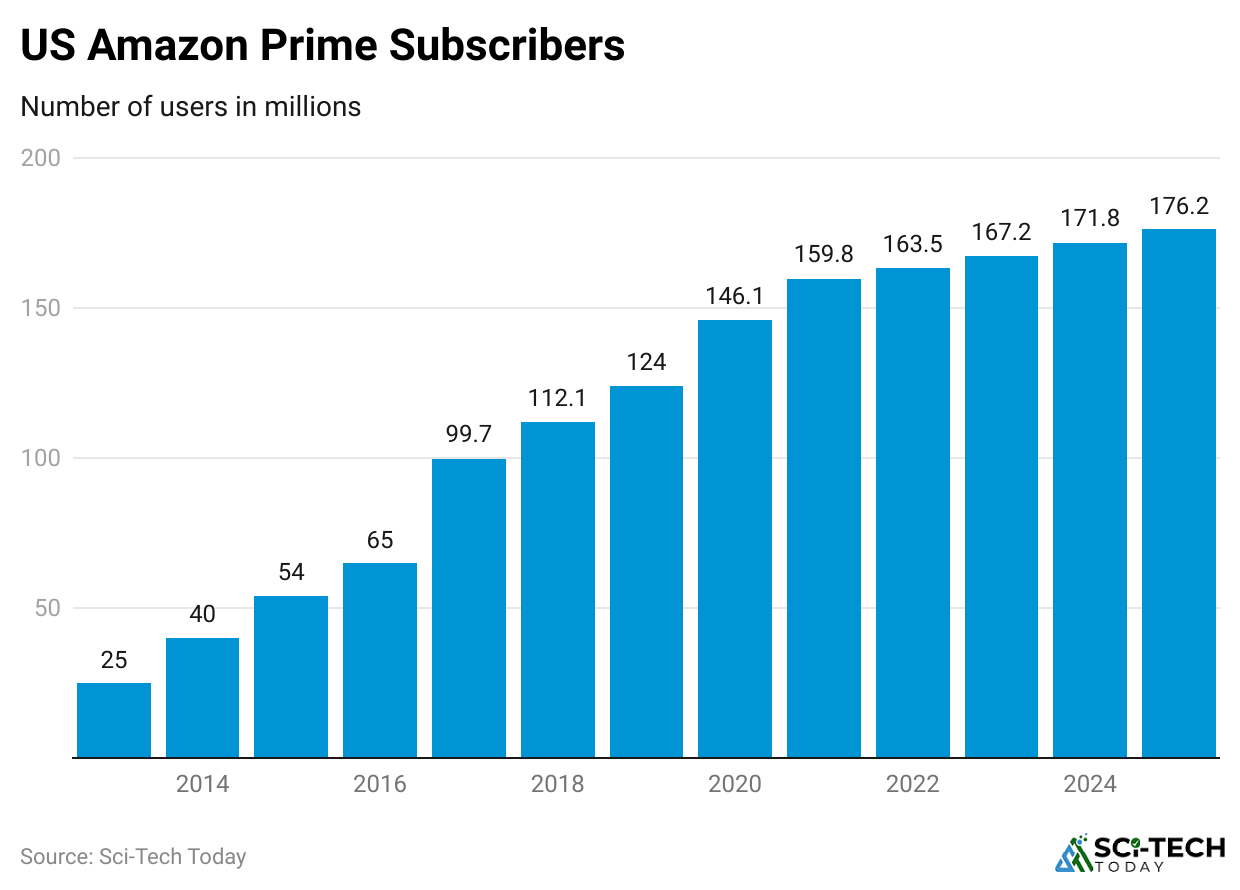
- Growth in Prime subscriptions is expected to slow over the next 2-5 years because Amazon is likely to reach full market saturation in the U.S.
| Years | Number of users |
| 2025 | 168.3 million (estimated) |
| 2024 | 165 million |
| 2023 | 161.7 million |
| 2022 | 157.4 million |
| 2021 | 151.9 million |
| 2020 | 142.5 million |
| 2019 | 124 million |
| 2018 | 112.1 million |
| 2017 | 99.7 million |
| 2016 | 65 million |
| 2015 | 54 million |
| 2014 | 40 million |
| 2013 | 25 million |
- According to Amazon Statistics, almost 81% of U.S. internet users between 18 and 34 have a paid Amazon Prime membership.
- For internet users between 35 and 54 years, just 68% have a Prime subscription.
| Age Group | U.S. Internet Users with Prime |
| 18 to 34 | 81% |
| 35 to 54 | 68% |
| 55+ | 60% |
Amazon Shopping Statistics
- Capital One Shopping Research stated that Amazon.com attracted 2.52 billion global shoppers in March 2026.
- Around 28% of Amazon customers completed their purchases within 3 minutes of shopping.
- Nearly 50% of shoppers spent at least 15 minutes browsing products before making a purchase.
- Free shipping was the main reason 48% of U.S. consumers preferred shopping on Amazon.
- About 44% of shoppers considered Amazon the most convenient e-commerce platform.
- Around 36% of online shoppers used Amazon when they needed products delivered quickly.
- Approximately 73.7% of Amazon customers discovered new products and brands while shopping on the platform.
- In the United States, 74% of Amazon shoppers were Prime members.
Amazon Cross-Shopping Statistics
- 95% of Amazon shoppers also shop at Walmart, and 53% make an Amazon purchase within 1 day of visiting a Walmart store.
- Among those shoppers, 22% chose Amazon over Walmart because of better prices, while 30% preferred Amazon due to better product availability and another 30% because of easier delivery.
- About 76% of Amazon shoppers also shop at Target, and 38% purchase from Amazon within 1 day of visiting a Target store.
- Among Target shoppers, 20% switched to Amazon for better prices, 24% for product availability, and 31% because Amazon offered more convenient delivery.
- 38% of Amazon shoppers also shop at Costco, and 38% make an Amazon purchase within 1 day of shopping at a Costco store.
Amazon Customer Statistics
- Amazon has more than 310 million active customer accounts worldwide, including 255 million consumers in the United States.
- Around 74% of U.S. Amazon customers are Prime members, while the platform has over 200 million Prime subscribers globally.
- About 43% of Americans shop on Amazon at least once a week, showing strong customer engagement.
- Approximately 52% of consumers begin their online product searches on Amazon.
- Amazon enjoys high customer loyalty, with 99% of its shoppers returning to make repeat purchases.
Amazon Customer Demographic and Generation Statistics
- Amazon’s typical customer is a middle-income suburban woman, based on consumer profile data.
- Female shoppers represent 74% of Amazon customers, while 25% are male and 1% identify outside the male/female categories.
- Around 38% of customers live in suburban areas, followed by 34% in urban locations and 28% in rural areas.
- Income data shows 46% of Amazon customers earn USD 40,000 to USD 125,000 annually, while 32% come from high-income households and 21% earn below USD 40,000.
- By generation, 33% of Amazon customers were born before 1965, 31% between 1965 and 1981, 27% between 1982 and 1995, and 8% after 1995.
- Amazon reaches 74% of Baby Boomers, 73% of Generation X, 76% of Millennials, and 72% of adult Generation Z consumers.
Amazon Employee and Productivity Statistics
- Macro Trends stated that Amazon had 1,576,000 full-time and part-time employees worldwide at the end of 2025, increasing 1.29% from 1,556,000 in 2024.
- Around 70% of Amazon’s workforce, or about 1.1 million employees, are based in the U.S. across logistics, corporate, and technology roles.
- According to Forbes, between October 2025 and May 2026, Amazon reduced about 30,000 corporate positions, with at least 16,616 layoffs reported in 2026.
- Amazon’s revenue per employee reached approximately USD 454,900 in fiscal 2025, growing 10.95% year on year due to improved efficiency.
Amazon Device Statistics by Echo / Alexa (Smart Speakers)
- According to Alibaba, Echo Dot (6th Gen) was Amazon’s best‑selling hardware product in 2026, with about 22.7 million units sold globally and roughly 28% year‑on‑year unit growth.
- Around 64% of these Echo Dot units were bought by households that already owned at least one Alexa‑enabled device, underscoring deep ecosystem penetration.
By Kindle e‑readers
- Retail trackers describe Kindles as holding a dominant share of the dedicated e‑reader market in 2026, with several models regularly discounted 20%-37% during Amazon’s Big Spring Sale and Prime Day.
- Mashable report further stated that typical 2026 promotional pricing includes the basic Kindle at USD 85-99.99, Kindle Paperwhite at about USD 124.99-134.99, and Kindle Scribe Colorsoft bundles seeing discounts of USD 120-160 off list prices around USD 480-680.
By Fire tablets and Fire TV/devices
- Amazon’s “Back to School” kids tech campaign in July 2026 offered Fire 7 Kids tablets from USD 70 (down from USD 110) and Fire HD 10 Kids tablets from USD 135-176, with up to 40% discounts.
- 9to5toys report further stated that across Fire tablets and associated kids SKUs, Amazon advertised “up to 40% off” on multiple configurations, reinforcing Fire’s positioning as a mass‑market, low‑cost tablet line.
Summary
Amazon has grown from an online bookstore into one of the world’s largest technology and e-commerce companies. Its strong focus on customer service, fast delivery, cloud computing, and AI keeps it ahead of many competitors. Amazon also continues to expand into new markets and services.
As technology changes, the company is expected to play an even bigger role in online shopping, digital services, and business innovation, making it an important company to watch in the future.
FAQ
Amazon accepts major credit and debit cards, gift cards, Amazon Pay (where available), and other region-specific payment options.
Amazon Prime is a membership offering fast shipping, exclusive deals, streaming entertainment, and other premium shopping benefits.
Yes, Amazon ships internationally to many countries, though product availability varies by destination.

Sources