






Overview
Part-Time Vs Full-Time Employment Statistics: Choosing between a part-time and a full-time job is an important step in your career. Both options have their own benefits and challenges. A full-time job usually offers a steady income, employee benefits, and better career growth. On the other hand, a part-time job gives you more flexibility, making it a good choice for students, parents, freelancers, or anyone looking for a better work-life balance. The right option depends on your financial needs, career goals, and personal lifestyle.
In this guide, you’ll learn the key differences between part-time and full-time employment, along with their pros, cons, salaries, benefits, and career opportunities to help you make the best choice.
Editor Approved
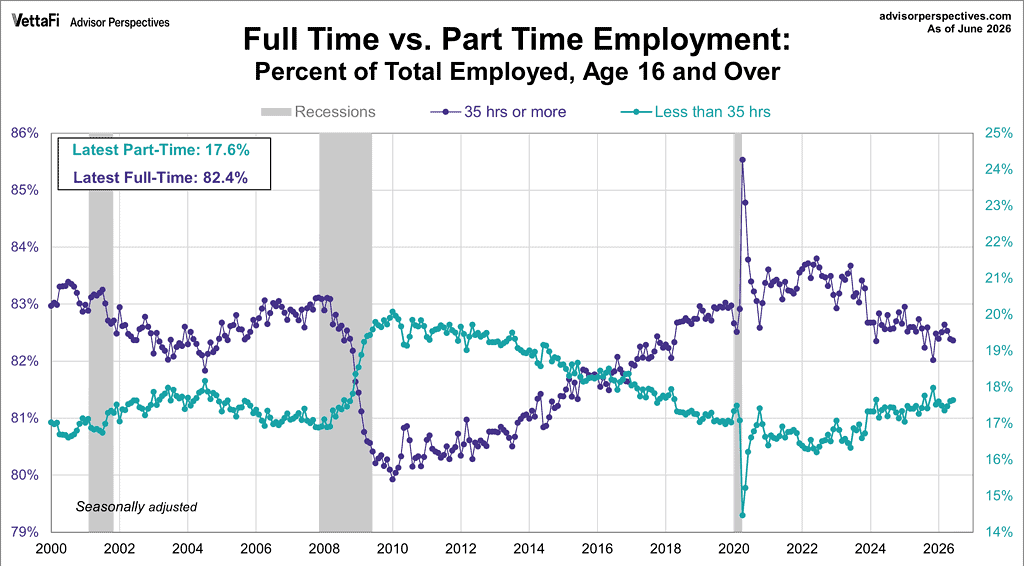
- 82.4% of employed Americans worked full-time in June 2026, while 17.6% worked part-time.
- Part-time employment has remained above 17% since December 2023.
- During the Great Recession, part-time employment reached a record 20.1% in January 2010, while full-time employment dropped to an all-time low of 79.9%.
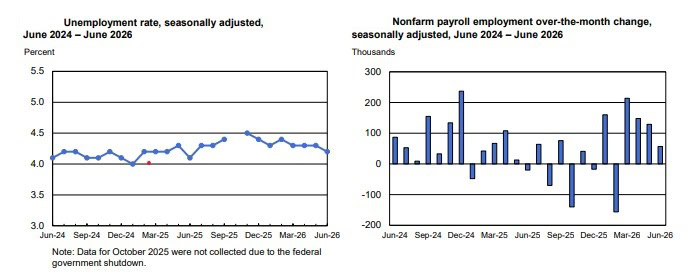
- The U.S. added 57,000 nonfarm jobs in June 2026, while the unemployment rate held steady at 4.2%.
- Around 4.7 million Americans worked part-time for economic reasons in June 2026.
- Professional and business services created 36,000 jobs in June 2026.
- Total U.S. part-time employment peaked at a record 29.45 million workers in November 2025 before easing to 28.63 million by June 2026.
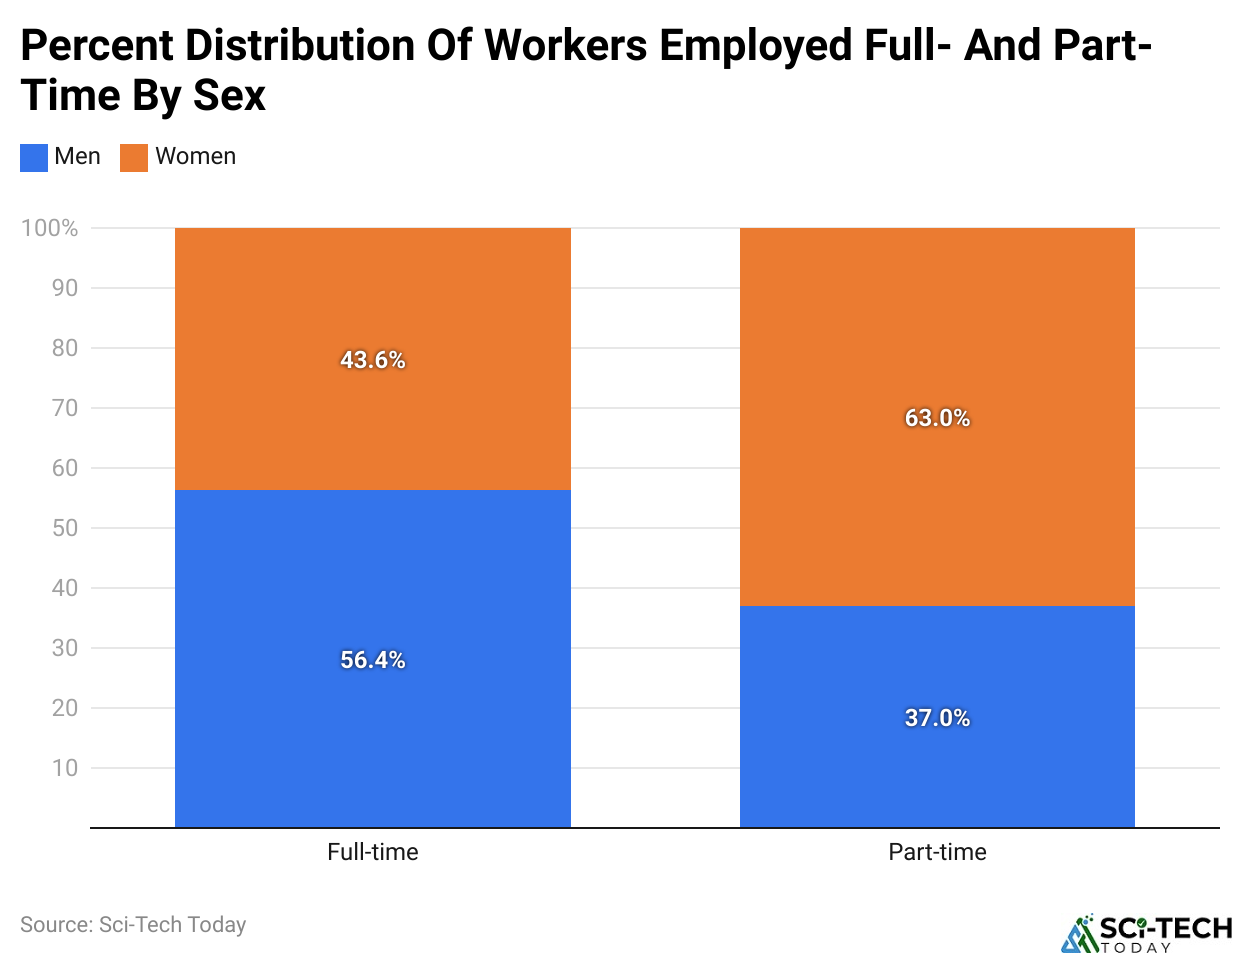
- Women represented 63% of all part-time employees, compared with 37% for men.
- Full-time employees report significantly higher job satisfaction (75% vs. 58%) and stronger job security (82% vs. 60%) than part-time workers.
- Under the Affordable Care Act (ACA), employees working 30 or more hours per week qualify as full-time.
United States Full-Time vs. Part-Time Employment Trends
(Source: advisorperspectives.com)
- The U.S. Labor Department tracks full-time and part-time employment through the monthly Current Population Survey. Workers are classified based on total hours worked, with 35 or more hours per week counted as full-time.
- The data series began in 1968, when only 13.5% of US workers were employed part-time.
- As of June 2026, 82.4% of employed Americans worked full-time, while 17.6% worked part-time.
- Since December 2023, full-time employment has remained below 83.0%, while part-time employment has stayed above 17%.
Impact of Economic Recessions
- During the 2008-2009 Great Recession, full-time employment declined sharply while part-time employment increased.
- After the September 15, 2008, bankruptcy of Lehman Brothers, the trend accelerated.
- In January 2010, part-time employment reached a record 20.1%, while full-time employment fell to an all-time low of 79.9%.
- Full-time employment gradually recovered after the recession and continued improving through the COVID-19 period.
- Unlike earlier recessions in the early 1990s and early 2000s, full-time employment unexpectedly peaked in April 2020 during the COVID-19 recession.
- Only about 3% of part-time workers had shifted from full-time employment during the pandemic.
Part-Time Employment Trends
(Source: advisorperspectives.com)
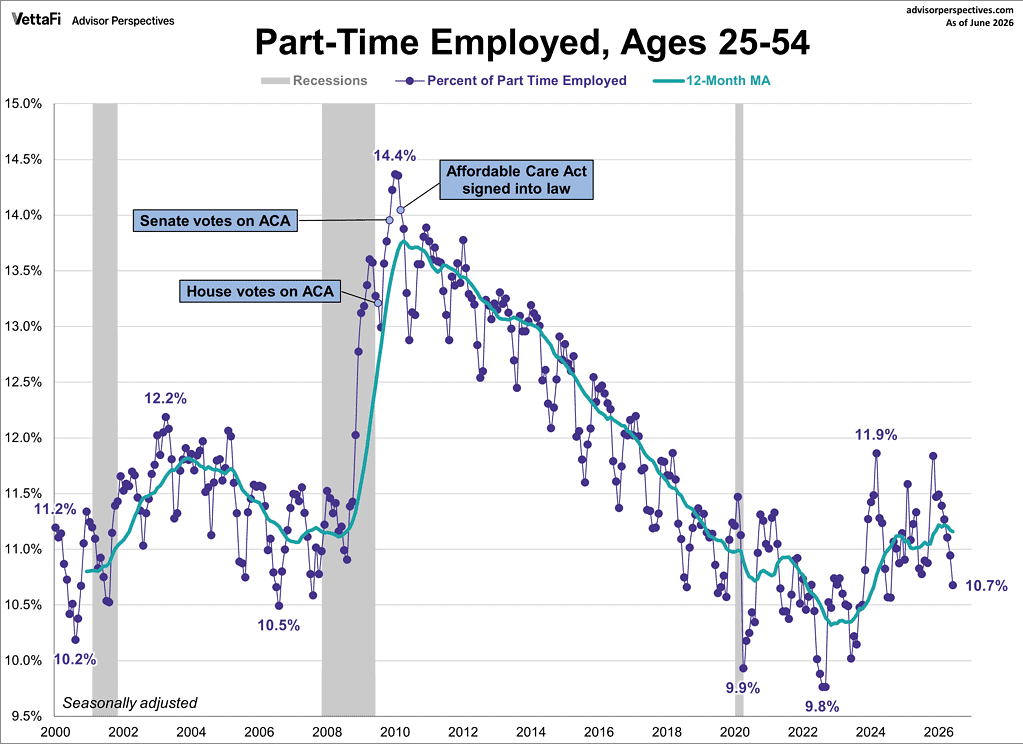
- As of June 2026, part-time employment among the 25-54 age group stood at 10.7%.
- This is lower than the 11.9% peak seen in 2025, showing a slight easing in part-time work levels.
- The 12-month moving average confirms a gradual decline compared to the sharp 2025 rise from post-pandemic lows near 9.8%.
Typical Full-Time and Part-Time Working Hours by Industry
| Industry | Full-Time Hours | Part-Time Hours |
| Healthcare | 36-40 hours/week | 20-30 hours/week |
| Retail | 35-40 hours/week | 15-25 hours/week |
| Technology | 40 hours/week | 10-30 hours/week |
| Education | 40 hours/week | 15-30 hours/week |
| Hospitality | 35-40 hours/week | 20-30 hours/week |
| Finance & Banking | 40 hours/week | 15-30 hours/week |
| Transportation | 40 hours/week | 20-30 hours/week |
| Creative Industries | 40 hours/week | 15-25 hours/week |
By Region
| Country | Full-Time Hours (per week) | Part-Time Hours (per week) |
| United States | 40 hours | 20 to 30 hours |
| Canada | 37.5 to 40 hours | 20 to 30 hours |
| United Kingdom | 37.5 to 40 hours | About 20 hours |
| Germany | 38 hours | 20 to 30 hours |
| France | Capped at 35 hours | 10 to 30 hours (varies by industry) |
| Australia | 38 hours | 15 to 30 hours |
| Japan | 40 to 45 hours | 20 to 30 hours |
| Scandinavian countries | 37 to 40 hours | 20 to 31 hours |
By Age Group
- According to market.biz, in the U.S., workers aged 25-54 are the most likely to work full-time, averaging 40 hours per week.
- Young adults aged 16-24 commonly work part-time and average 20 hours per week, often because they combine work with education.
- Workers aged 55 and older are more likely to choose part-time jobs, typically working 25-30 hours per week.
- Teenagers aged 16-19 usually hold part-time jobs and work around 15-20 hours per week, depending on local labor regulations.
- In the U.K., full-time employees aged 25-49 work an average of 37.5 hours per week, while those aged 16-24 often work part-time for about 20 hours weekly.
- In Canada, workers aged 25-54 average 40 hours per week, while those under 24 typically work 20-30 hours part-time.
- Among workers aged 50+, part-time employment becomes more common, averaging 20-30 hours per week.
- In the U.S., part-time work is especially common among workers aged 18-24, who average 20 hours per week.
United States Labor Market Trends
(Source: bls.gov)
- Nonfarm payroll employment increased by 57,000 jobs in June 2026, while the unemployment rate remained at 4.2%.
- The household survey estimated 7.1 million unemployed people in June.
- Unemployment rates remained largely stable across major groups, including adult men (3.9%), adult women (3.7%), teenagers (14.6%), White workers (3.6%), Black workers (6.6%), Asian workers (3.9%), and Hispanic workers (5.2%).
- The number of long-term unemployed people (jobless for 27 weeks or more) remained at 1.9 million, up 286,000 over the year, representing 27.3% of all unemployed workers.
- The labor force participation rate declined by 0.3% to 61.5%, while the employment-population ratio fell 0.2% to 59%.
- About 4.7 million people worked part-time for economic reasons because they could not find full-time jobs or had reduced working hours.
- Around 6.0 million people outside the labor force wanted a job, including 1.8 million people marginally attached to the labor force and 477,000 discouraged workers.
Industry Employment, Earnings, and Workweek
- The U.S. Bureau of Labor Statistics reported that Professional and business services added 36,000 jobs and have gained 172,000 positions since October 2025.
- Social assistance employment increased by 25,000, including 17,000 jobs in individual and family services.
- Health care added 22,000 jobs, below its previous 12-month average of 38,000, while hospitals contributed 9,000 positions.
- Leisure and hospitality lost 61,000 jobs because of weaker seasonal hiring, while most other major industries recorded little change.
- Average hourly earnings increased by USD 0.13 (0.3%) to USD 37.64, with annual wage growth of 3.5%. Production and nonsupervisory employees earned USD 32.38, up USD 0.07 (0.2%).
- The average private-sector workweek remained 34.3 hours, manufacturing averaged 40.3 hours with 3.2 hours of overtime, and production workers averaged 33.7 hours.
- Payroll gains for April were revised from 179,000 to 148,000, and May from 172,000 to 129,000, reducing total employment by 74,000 across both months.
Employment Rates by Gender in Major Economies
| Country | Male Employment Rate | Female Employment Rate | Gap Share |
| Sweden | 82% | 79% | 3% |
| Germany | 79% | 74% | 5% |
| United Kingdom | 79% | 72% | 7% |
| United States | 78% | 67% | 11% |
| Japan | 84% | 73% | 11% |
| India | 75% | 25% | 50% |
| Saudi Arabia | 79% | 33.7% (LFPR) | 45+% |
| Global Average | 69.5% | 46.4% | 23.1% |
Distribution Percentage Of Part-Time Vs Full-Time Employment Statistics By Sex
(Reference: dol.gov)
The above analyses of the United States of America in 2024 are detailed in the table:
| Full-time Employee | Part-time Employee |
| Women(53,727) | Women(15,508) |
| Share (43.6%) | Share (63%) |
| Men (69,461) | Men (9,099) |
| Share (56.4%) | Share (37%) |
By Race
|
Race
| Full-time Employee | Part-time Employee | ||
| Men | Women | Men | Women | |
| White | 55,284 (88.5%) | 40,507 (76.6%) | 7,162 (11.5%) | 12,388 (23.4%) |
| Black | 7,331 (87.4%) | 7,775 (82%) | 1,060 (12.6%) | 1,706 (18%) |
| Asian | 4,552 (90.3%) | 3,557 (80.9%) | 489 (9.7%) | 839 (19.1%) |
| Hispanic | 13,184 (88.7%) | 8,505 (76.7%) | 1,673 (11.3%) | 2,590 (23.3%) |
| Total | 69,461 (88.4%) | 53,727 (77.6%) | 9,099 (11.6%) | 15,508 (22.4%) |
Percentage of Employed By Ethnicity
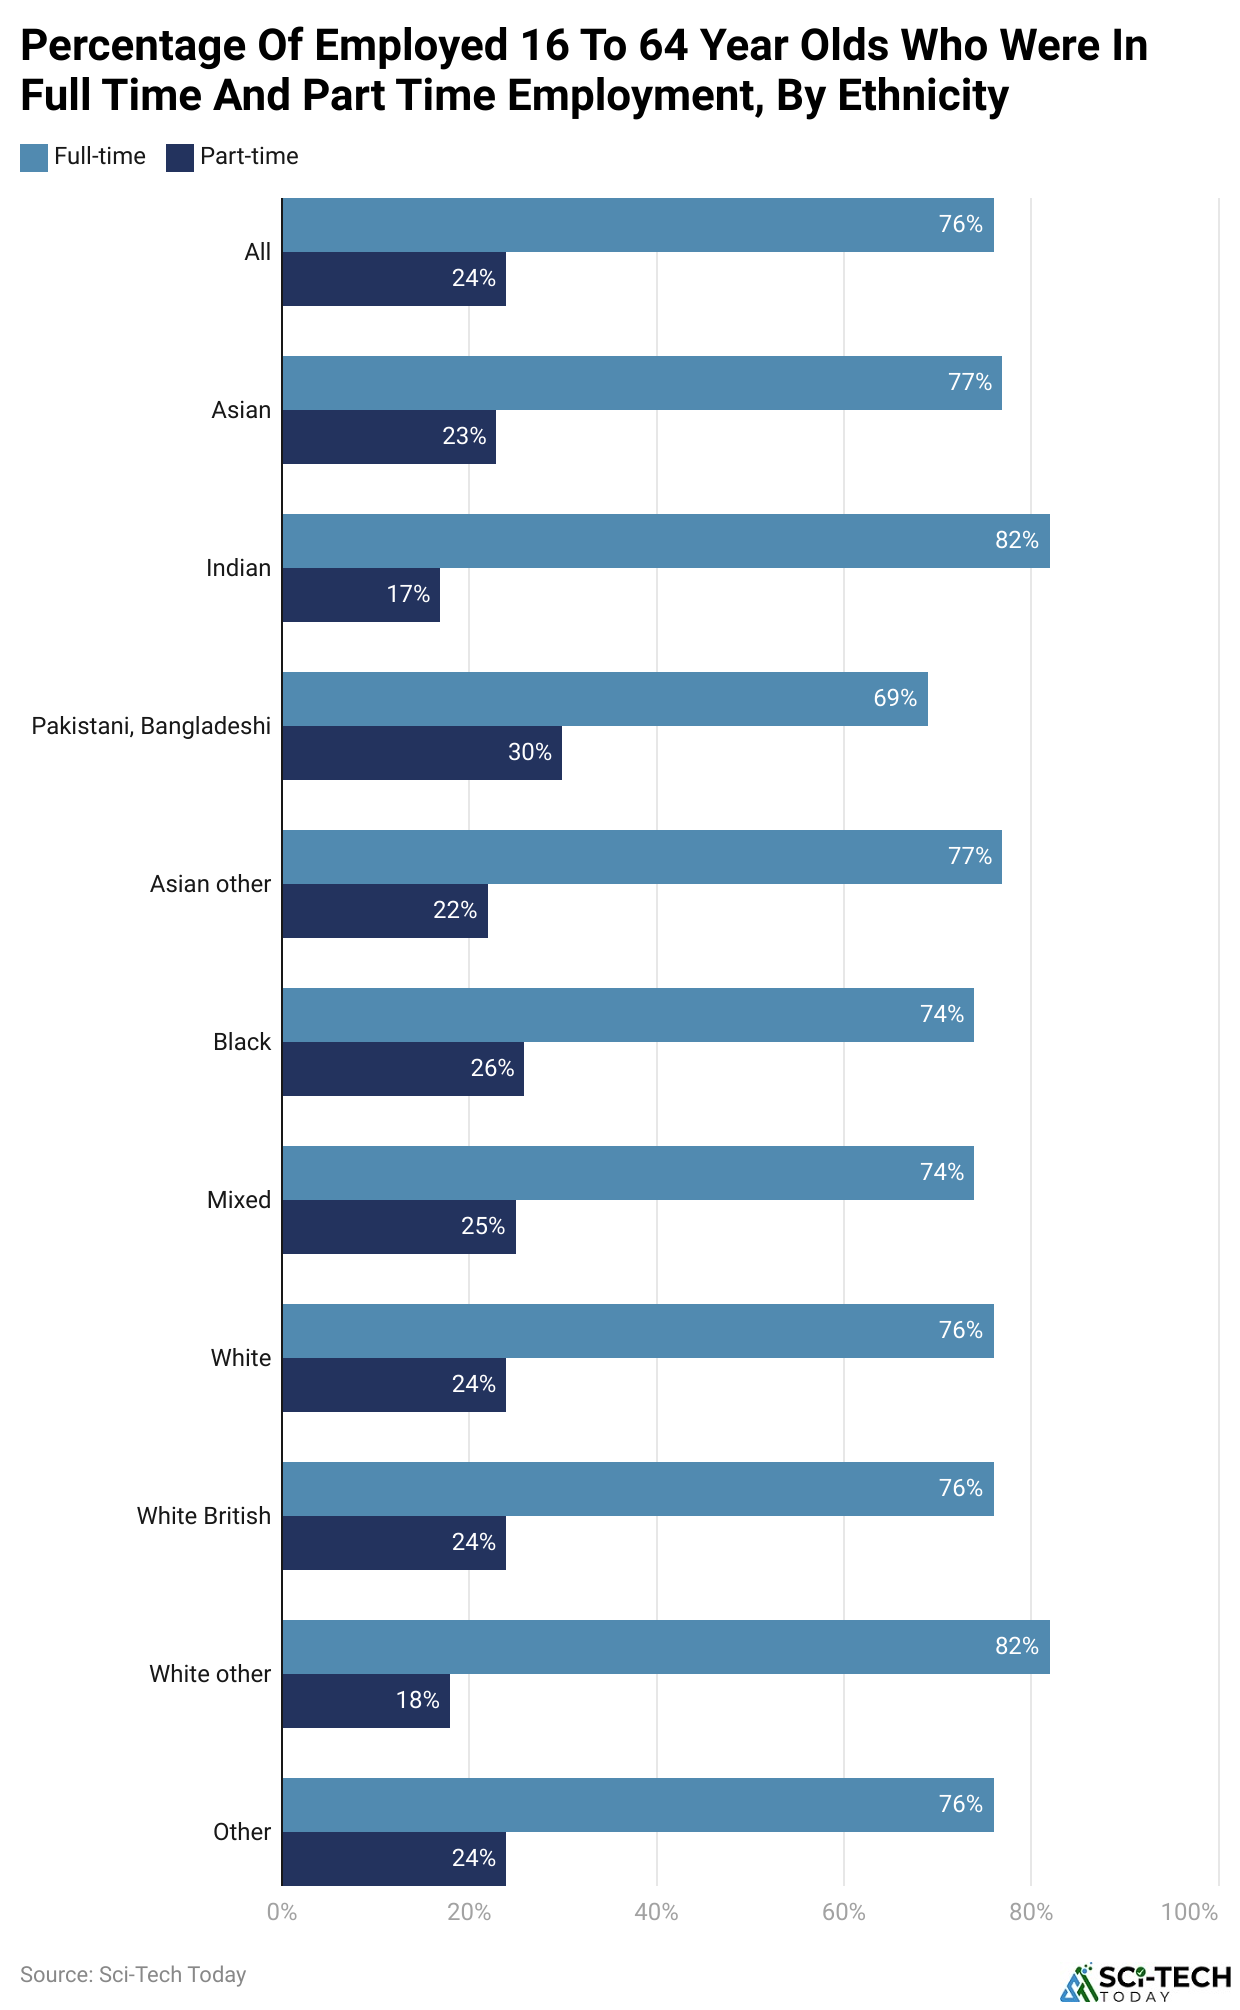 (Reference: ethnicity-facts-figures.service.gov.uk)
- Part-time vs full-time Employment Statistics show that Indians and other white people have the largest share in full-time employment at 82%, followed by Asians at 82%.
- Meanwhile, Pakistani and Bangladeshi workers secured the highest share of part-time employment, 30%.
Furthermore, other ethnicities’ share of full and part-time employment is stated below:
| Ethnicity | Full-time | Part-time |
| All | 24% | 76% |
| Asian | 23% | 77% |
| Indian | 17% | 82% |
| Pakistani and Bangladeshi | 30% | 69% |
| Asian other | 22% | 77% |
| Blank | 26% | 74% |
| Mixed | 25.0% | 74% |
| White | 24% | 76% |
| White British | 24% | 76% |
| White Other | 18% | 82% |
| Other | 24% | 76% |
Labor Force Participation Rate Statistics, 2025
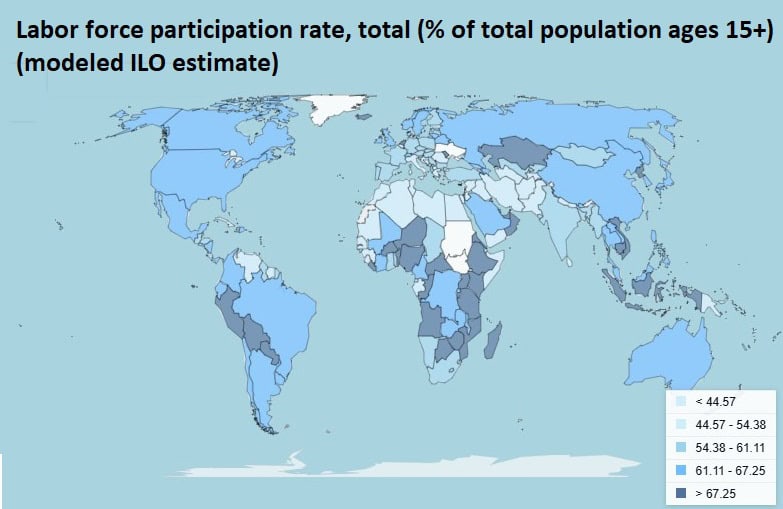
(Source: data.worldbank.org)
| Country | LFPR Rate |
| Qatar | 87% |
| Madagascar | 85% |
| Thailand | 84% |
| Somalia, Fed. Rep. | 84% |
| Tanzania | 84% |
| Solomon Islands | 84% |
| Nigeria | 83% |
| Korea, Dem. People’s Rep. | 82% |
| Cambodia | 82% |
| Niger | 80% |
| Uganda | 80% |
| Vanuatu | 58% |
| Mozambique | 79% |
| Liberia | 77% |
| Burundi | 78% |
| Eritrea | 78% |
| Myanmar | 55% |
| Benin | 76% |
| Angola | 75% |
| The Bahamas | 74% |
Comparison Between Part-Time And Full-Time Employee Consideration In 2026
| Criterion | Full-Time Employee | Part-Time Employee |
| Hours worked per week | Typically 35-40+ hours/week; ACA full-time: ≥ 30 hours/week or ≥ 130 hours/month. | Typically 1-34 hours/week; often employer-defined cutoff < 30-35 hours/week. |
| Annual working hours | Benchmark 2,080 hours/year (40×52), with effective working time ≈ 2,000-2,008 hours after holidays. | Example patterns: 1,560 hours/year at 30 hours/week; 1,040 hours/year at 20 hours/week. |
| PTO | Structured PTO (e.g., 10-20 days/year vacation plus sick leave and holidays), full accrual based on FT hours. | PTO often prorated by hours; common eligibility threshold ≥ 20 hours/week; below that may have limited or no PTO. |
| Health benefits eligibility | ACA mandate: employers with ≥50 FTE must offer health coverage to employees ≥ 30 hours/week or ≥ 130 hours/month. | No federal mandate; health coverage can be offered at employer discretion. Carriers often require ≥ 20 hours/week for eligibility; ACA does not require coverage below 30 hours/week. |
| Wage payment | Typically salary-based, monthly or biweekly pay; payroll taxes withheld (FICA, federal and state/local). | Typically hourly wage, paid per hour worked; same payroll tax withholding obligations. |
| Job security | Generally higher job security, stable schedules, long-term continuity, broader benefits. | Generally lower job security, variable schedules, fewer benefits; used to flex staffing. |
| Overtime eligibility | Non-exempt FT employees earn overtime pay when working > 40 hours/week (jurisdiction-specific). | Non-exempt PT employees also earn overtime if they exceed legal thresholds (e.g., > 40 hours/week); schedules usually kept below. |
Part-Time Vs Full-Time Employment Statistics By Employment Laws Applied to Both
| Names of employment laws | Current Statistics, 2024 |
| Fair Labor Standards Act (FLSA) – USA | It is estimated that about 65 million workers in the U.S. are covered by the FLSA, with 24% working part-time. |
| Overtime violations have been reduced by 8% since the law’s stricter enforcement. | |
| Employment Rights Act 1996 – U.K. | The number of claims made by part-time workers for unfair dismissal increased by 12%. |
| About 6 million part-time employees in the U.K. benefit from these protections. | |
| Part-Time Workers (Prevention of Less Favourable Treatment) Regulations 2000 – U.K. | 60% of employers reported better retention of part-time workers due to increased awareness of fair treatment regulations. |
| Part-time employment accounts for 27% of the total workforce in the U.K. | |
| Affordable Care Act (ACA) – USA | The number of part-time workers receiving health insurance increased by 15% in 2024 due to ACA enforcement. |
| 80% of employers with 50+ employees now provide healthcare options to part-time workers. | |
| Equality Act 2010 – U.K. | Reports of workplace discrimination against part-time workers decreased by 7%. |
| The act benefits 42% of the workforce in the U.K., including part-time and full-time employees. | |
| Family and Medical Leave Act (FMLA) – USA | 25% of FMLA leave claims in 2024 came from part-time employees. |
| Over 55 million workers are eligible for FMLA, and 60% of eligible part-time workers are aware of their rights under the law. | |
| National Minimum Wage Act 1998 – UK | 3.5 million part-time workers in the U.K. benefited from minimum wage increases. |
| The compliance rate for part-time wage payments increased by 5% in the past year. | |
| Occupational Safety and Health Act (OSHA) – USA | Workplace injuries for part-time workers decreased by 10% due to better compliance with OSHA standards. |
| OSHA covers around 130 million workers, including part-time employees. | |
| Working Time Regulations 1998 – U.K. | Part-time workers taking legal rest breaks increased by 9%. |
| Over 9 million part-time workers in the U.K. benefit from these regulations. | |
| Employment Standards Act – Canada | 20% of the Canadian workforce is part-time, and the number of employment law violations reported by part-time workers dropped by 6% due to better enforcement. |
| The ESA covers 18 million workers across the country. |
(Source: reclaim.ai)
United States Full-Time Employees Statistics
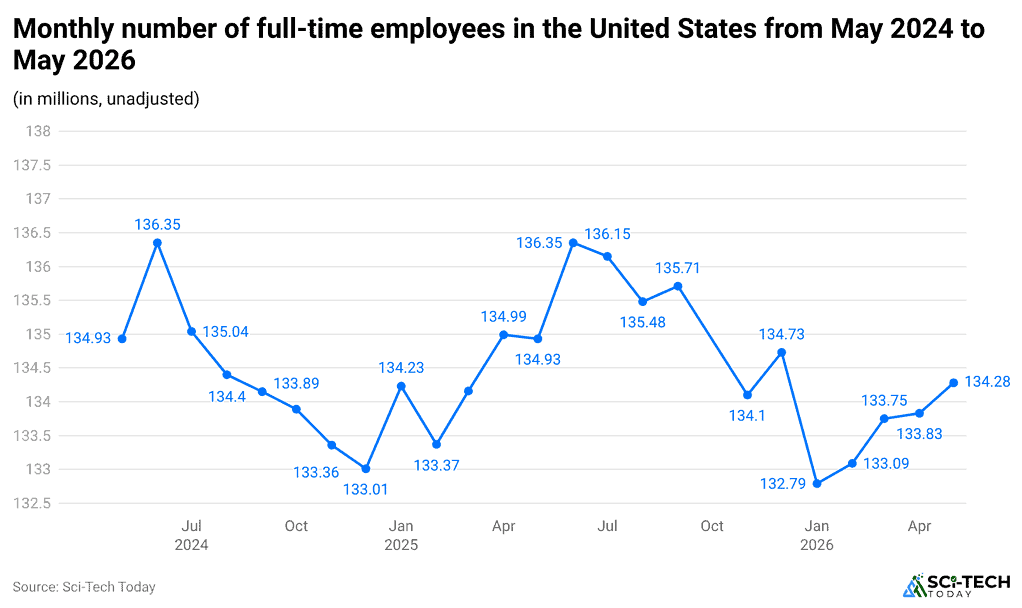
(Reference: statista.com)
| Month | Number of full-time employees (millions) |
| May 2025 | 134.99 |
| June 2025 | 136.35 |
| July 2025 | 135.48 |
| August 2025 | 134.71 |
| September 2025 | 134.10 |
| October 2025 | 132.79 |
| November 2025 | 133.75 |
| December 2025 | 134.28 |
| January 2026 | 134.73 |
| February 2026 | 134.10 |
| March 2026 | 132.79 |
| April 2026 | 133.75 |
| May 2026 | 134.28 |
U.S. Part-Time Employment Trends
- BLS Employment Situation further stated that in January 2026, 4.888 million people worked part-time for economic reasons, down from 5.341 million in December 2025 but 410,000 higher than January 2025.
- Slack business conditions accounted for 3.219 million, while 1.357 million could only find part-time jobs. Part-time employment for noneconomic reasons reached 22.929 million.
- BLS Table A-8 stated that in June 2026, part-time employment for economic reasons declined to 4.681 million, down 124,000 from May 2026.
- Among June’s economic part-time workers, 3.010 million cited slack work or business conditions, while 1.409 million said they could only find part-time work.
- Part-time employment for noneconomic reasons fell from 22.853 million in May 2026 to 22.618 million in June 2026.
- Total part-time employment reached a record 29,452 thousand workers in November 2025 before easing to 28,626 thousand in June 2026, down 53 thousand from May.
- From 1968-2026, average part-time employment was 21,609.23 thousand, while the record low was 10,086 thousand in January 1968.
Minimum Wages By State, 2026
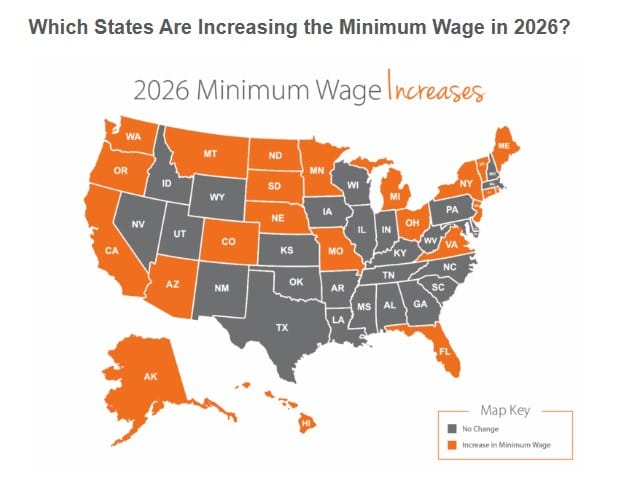
(Source: paycor.com)
- As of 2026, many U.S. states increased their minimum wages, while several continued to follow the federal minimum wage of USD 7.25.
- The highest minimum wage is in Washington, D.C. (USD 17.95), followed by Washington (USD 17.13), New York (USD 17.00 in New York City, Long Island, and Westchester; USD 16.00 elsewhere), Connecticut (USD 16.94), and California (USD 16.90).
- Oregon has regional rates of USD 16.30 (Portland metro), USD 15.05 (standard), and USD 14.05 (non-urban).
- New Jersey sets USD 15.92 for businesses with 6 or more employees and USD 14.23 for businesses with fewer than 6 employees and seasonal workers.
- States including Arizona (USD 15.15), Illinois (USD 15.00), Maryland (USD 15.00), Missouri (USD 15.00), Nebraska (USD 15.00), Florida (USD 15.00, effective September 30, 2026), and Hawaii (USD 16.00) also have higher wage floors.
Job Satisfaction And Job Security Statistics On Part-Time Vs Full-Time Employment
| Part-time Employment | Full-time Employment | |
| Full-time employment has higher job satisfaction. | 58% | 75% |
| Job security is stronger for full-time employees | 60% | 82% |
| Paid benefits and vacation time | 30% | 90% |
| Work-life balance challenges for part-time workers | 45% | 25% |
| Part-time workers face job insecurity | 40% | 20% |
| Career advancement opportunities | 50% | 50% |
| Job satisfaction differences by age and gender | 70% | 55% |
| Earnings and income stability | 60% | 40% |
| Stress levels | 40% | 20% |
Types of Part-Time Jobs and Income Statistics, 2024
| Job Type | Average Hourly Income |
| Retail Salesperson | USD 14.50 |
| Food Service Worker | USD 12.60 |
| Customer Service Representative | USD 17 |
| Driver (Delivery/Rideshare) | USD 20 |
| Tutor/Teacher’s Aide | USD 18 |
| Administrative Assistant | USD 19.50 |
Types of Full-Time Jobs and Income Statistics, 2024
| Job Type | Average Hourly Income |
| Healthcare | USD 81,400 |
| Information Technology | USD 105,550 |
| Engineering | USD 95,060 |
| Finance and Insurance | USD 87,850 |
| Education | USD 61,000 |
| Retail | USD 33,000 |
| Construction | USD 59,290 |
| Manufacturing | USD 79,000 |
| Transportation and Warehousing | USD 47,620 |
Several Factors Influence The Demand For Both Part-Time vs Full-Time Employee Differences
Working Hours and Benefits
- Under the Affordable Care Act (ACA), employees working 1–29 hours per week or less than 130 hours per month are generally considered part-time.
- Employees working 30 or more hours per week or 130 or more hours per month are considered full-time for ACA purposes.
- Part-time employees may receive limited benefits, such as flexible schedules or paid time off, depending on the employer.
- Full-time employees are more likely to receive health insurance, paid leave, retirement plans, and other workplace benefits.
- Employers with 50 or more full-time equivalent (FTE) employees must offer affordable health insurance to eligible full-time workers under the ACA.
Employment Rules and Workplace Impact
- Federal law does not set a universal definition of part-time employment outside specific ACA requirements.
- Employers classify workers based on job duties, working hours, and business needs.
- Both part-time and full-time employees are subject to the same payroll tax rules, including FICA, federal income tax, and applicable state or local taxes.
- Part-time employees often help employers manage flexible staffing needs while reducing benefit costs.
- Full-time employees generally provide greater workforce stability, higher productivity, and stronger long-term commitment, although they may face a higher risk of burnout because of longer working hours.
Summary
Both part-time and full-time jobs have their own benefits. A full-time job offers a steady income, better benefits, and more career growth. A part-time job gives you more flexibility and helps you balance work with studies, family, or other responsibilities.
The right choice depends on your goals, financial needs, and lifestyle. By understanding the key differences, you can choose the type of job that best fits your current needs and plans.
FAQ
Although it varies by employer and country, full-time employees typically work 35-40 hours per week.
Part-time employees generally work less than 35 hours per week.
Part-time employment often provides better work-life balance due to shorter working hours, while full-time employment offers greater financial stability and career advancement opportunities.

Sources