






Starter
Social media marketing statistics: You are trying to find where your customers are spending their attention, and the answer isn’t a billboard on the highway or a primetime TV spot. It’s right here, in their pocket, on a vibrant screen, where the content changes every second.
This year, social media marketing is the single largest theatre for customer discovery, communication, and, most critically, conversion. For every serious marketer, brand manager, or business owner, understanding the latest social media marketing statistics isn’t just about knowledge; it’s about having the technical, data-driven roadmap to an estimated USD 276.7 billion in global ad spend.
The landscape is a high-stakes, high-speed game. Algorithms are constantly being optimized by artificial intelligence, consumer trust is being changed by authenticity, and a massive shift to in-app purchasing is changing the very concept of a store.
This is the time of precision marketing, where success is measured in basis points, not broad strokes. I’d like to deliver the most detailed, information-based article on the current state of social media marketing, providing the benchmarks that set the standard for the industry. So, let’s dive deep into the numbers that are making the marketing playbook in 2026. Let’s get started,
Editor’s Hand-Selected Reads
- The active user base is massive, estimated at 41 billion identities worldwide. This represents a global penetration of 65.7% of the world’s total population.
- The social media ecosystem is still expanding, adding new users at a stable annual growth rate of 7%. This continued growth underscores its rising importance as a channel.
- On average, users spend approximately 141 minutes, 2 hours, 21 minutes on social platforms every day.
- Global social media advertising spend is projected to exceed USD 276.7 billion in 2025. This positions it as the fastest-expanding major advertising channel.
- Mobile devices are projected to account for a commanding 83% of total social ad spend by 2029. This confirms the complete shift to a mobile-first marketing strategy.
- Social media now solidifies its position by capturing 30% of all total digital ad spending. It remains a central and indispensable pillar in the digital media mix.
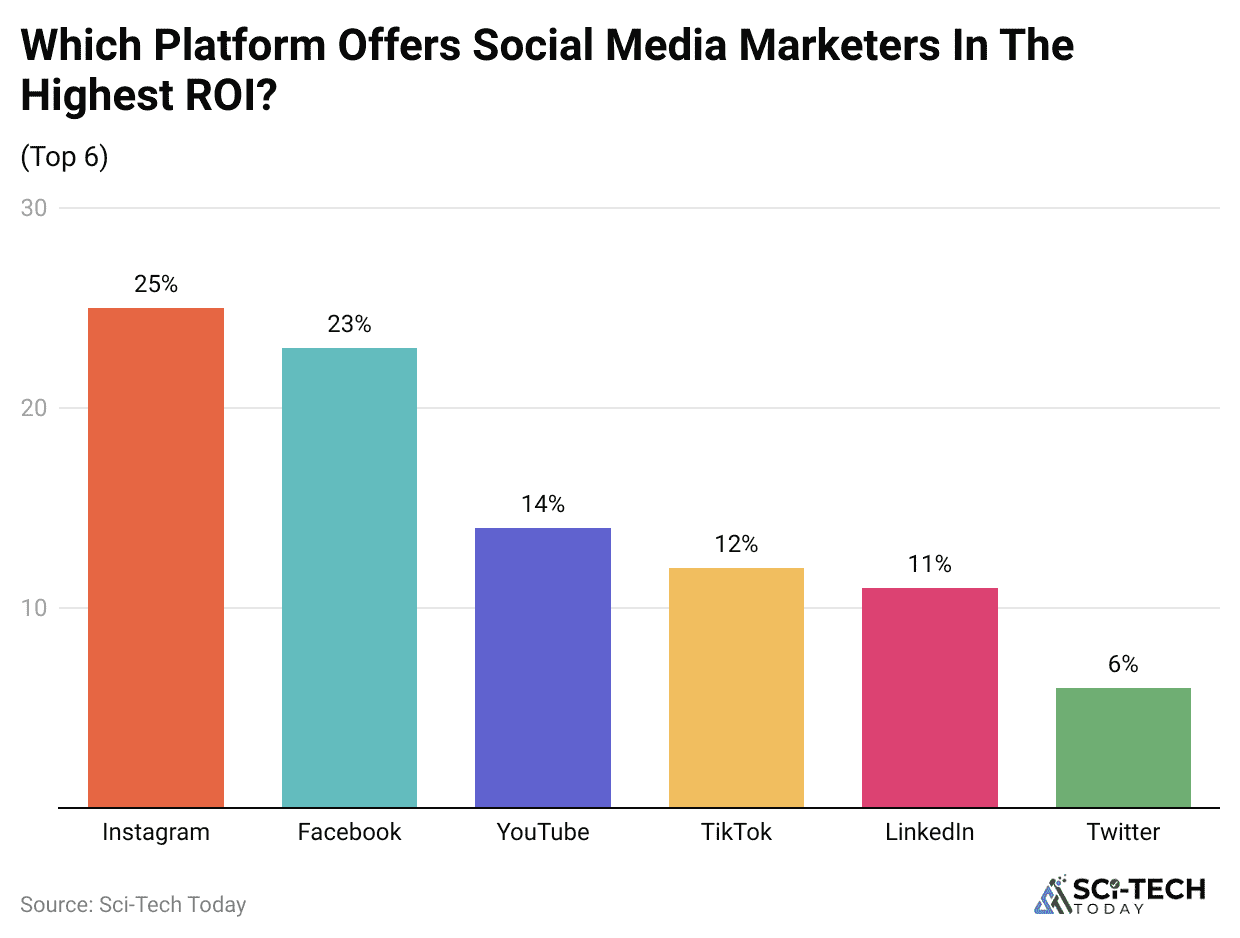
- Influencer marketing continues to demonstrate high profitability, generating an average return of USD 5.20 for every USD 1 invested. This is driven by the perceived authenticity of third-party recommendations.
- The average cost per lead on paid social for B2B campaigns is substantial, standing at around USD 310. This emphasizes the need for highly qualified and precise targeting in B2B efforts.
- The average cost-per-click for Facebook traffic campaigns is economical at approximately USD 0.83 across industries.
- A compelling 80% of online users have made at least one purchase after seeing an advertisement on social media.
- 58% of consumers report discovering new businesses directly through social media. This now surpasses both traditional search and TV advertising for brand discovery.
- An overwhelming 81% of users admit to making impulse buys influenced by social content. This behavior highlights the power of immediate, in-feed content for sales.
- 54% of consumers actively research products and services on social media before making a final purchasing decision.
- Facebook remains the largest social network globally, with 07 billion active users monthly. It is the most-used platform by an estimated 86% of global marketers.
- A striking 3% of Instagram users fall within the desirable 18 to 34 age range. This makes it vital for brands focused on youth B2C markets.
- Carousel posts outperform other formats, seeing the highest average engagement rate at 92%. This shows that multi-image, highly visual content is the key to engagement.
- The video platform is highly effective for commerce, converting 8% of its users into buyers. This signals its major role in the social commerce boom.
- Smaller creators under 100k followers enjoy superior organic engagement rates, soaring up to an estimated 5%. This is more than double the industry average, rewarding authentic content.
- YouTube provides the single largest potential audience for ads globally, reaching 53 billion users. Its short-form product, YouTube Shorts, is driving an impressive 5.91% engagement rate.
- A significant 78% of people prefer learning about new products or services through short video content.
- 82% of B2B marketers rank LinkedIn as their top channel for generating high-quality leads. This makes it the undisputed king of professional social media marketing.
- A notable 80% of Pinterest users report being in a shopping mindset while browsing the platform.
- With 553 million MAUs, it provides a high-intent audience for direct commerce.
- User-Generated Content UGC receives an average of 7x higher engagement than content published directly by a brand.
- 86% of consumers state that a brand’s authenticity is a critical factor when deciding which companies to support and buy from.
- Global sales from social commerce are projected to hit a massive USD 1.2 trillion by 2025. This clearly indicates that the window for in-app purchasing is rapidly expanding.
- 48% of social media users have made a purchase directly through a social media application. This statistic fundamentally blurs the lines between simple browsing and buying.
- A challenging 45% of consumers will actively share a negative experience they’ve had with a brand directly on social media.
Origin of Social Media Marketing’s Decade of Explosive Growth
(Reference: nasdaq.com)
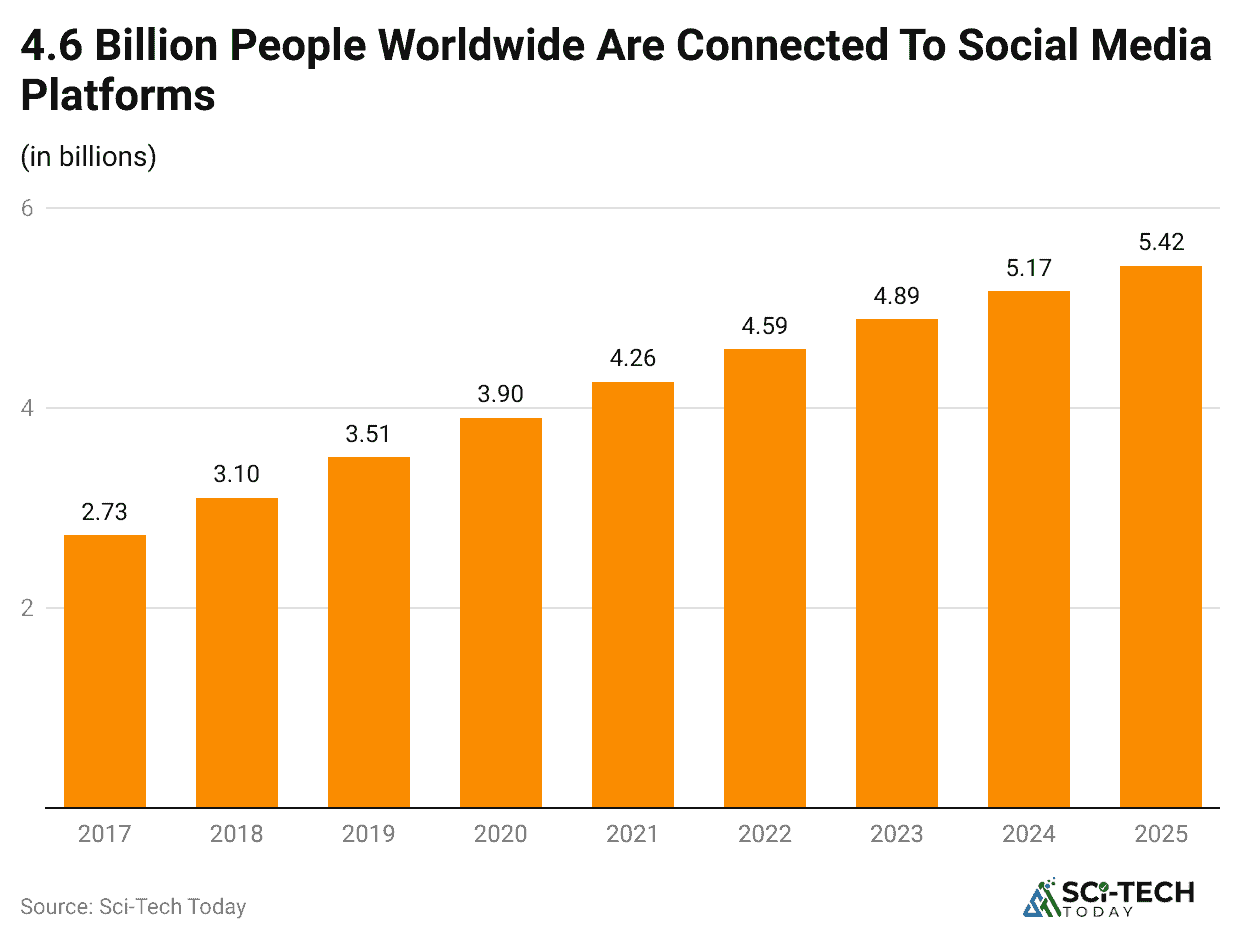
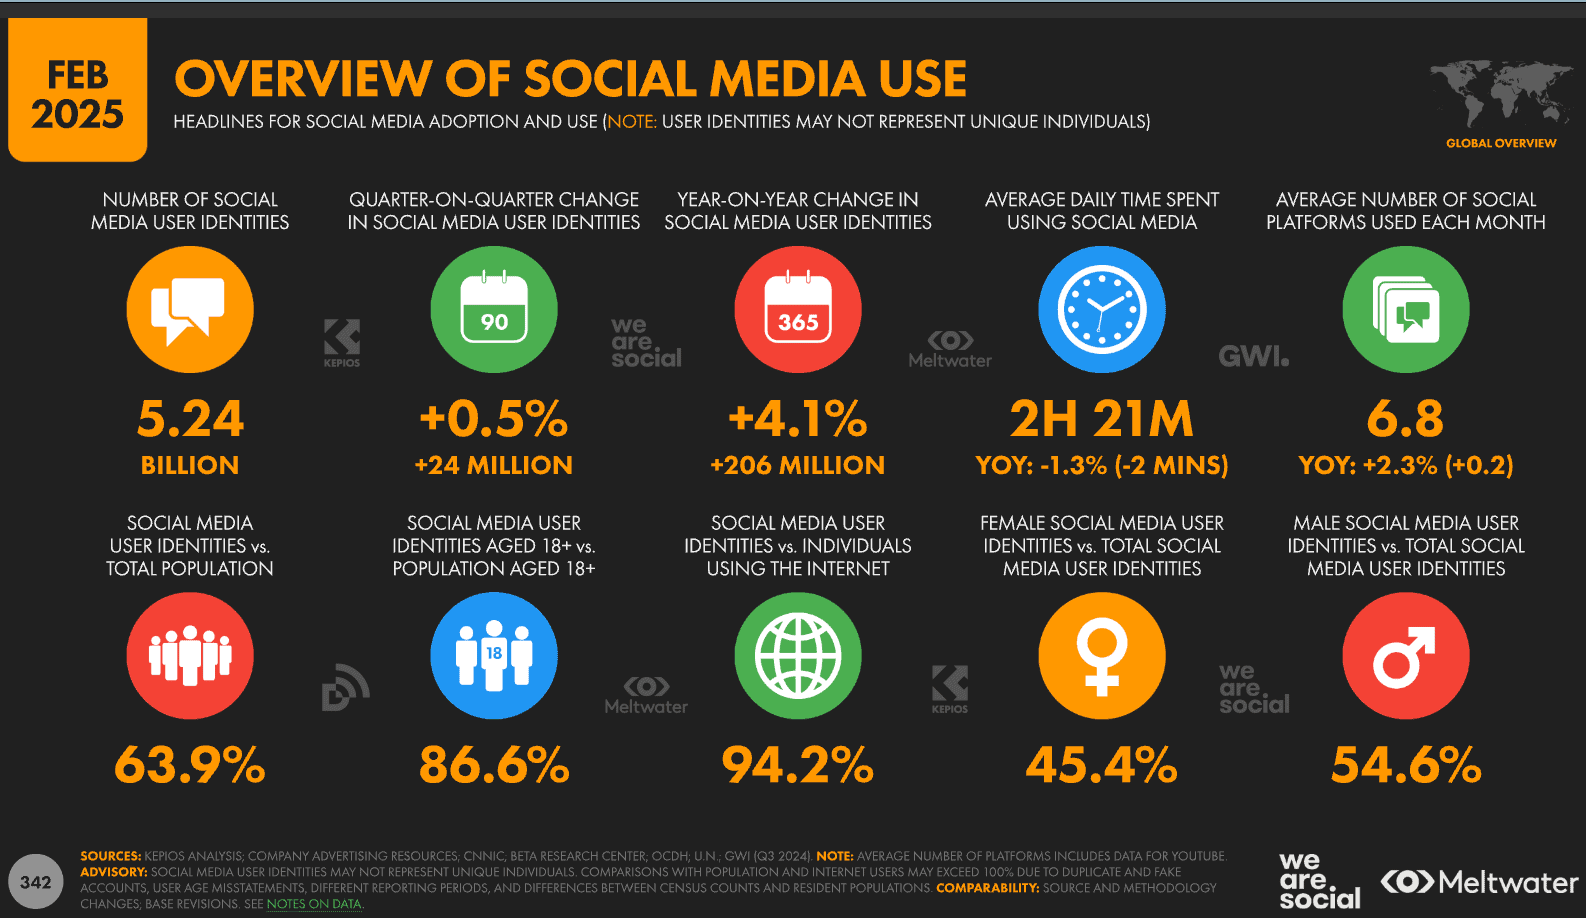
- The total number of global social media users is estimated to be over 5.41 billion in 2025, which represents approximately 65.7% of the world’s total population.
- This is a massive leap from the estimated 2.08 billion users recorded a decade ago in 2015, showing a growth factor of over 2.5 times in just ten years.
- The annual growth rate for new social media users has recently settled around 4.7%, adding about 241 million new user identities to the ecosystem over the last 12 months.
- In terms of sheer user attention, the global average time spent on social media stands at approximately 141 minutes per day, which translates to about 18 hours and 46 minutes per week, the equivalent of spending more than one full working day on platforms.
- The financial commitment mirrors this audience growth: global social media advertising spend is projected to surpass USD 276.7 billion in 2025, making it the fastest-expanding major advertising channel with a recent growth rate of 10.9% year-over-year.
| Total Global Users | 5.41 billion active identities |
| Global Penetration | 65.7% of the world’s total population |
| Annual Growth Rate Users | 4.7% new users added annually |
| Avg. Time Spent Daily | 141 minutes 2 hours 21 minutes |
| Projected Ad Spend | USD 276.7 billion globally in 2025 |
Mobile-First Money Pipeline By Ad Spend and ROI Statistics
(Reference: singlegrain.com)
- A dominant 83% of total social media advertising spending is projected to be generated through mobile devices by 2029, reflecting the complete shift to a mobile-first user experience.
- Social media ads now account for approximately three dollars for every ten dollars spent on all digital advertising, solidifying their position as a central pillar in the digital media mix.
- On average, marketers are now spending an estimated USD 46.47 per user to reach their target social audiences, which is a significant increase from just USD 3.50 per user a decade ago.
- Influencer marketing, a specific subset of social media marketing, is now generating an average return of USD 5.20 for every dollar invested, demonstrating its continued profitability as a trusted third-party channel.
- For B2B lead generation, the average cost per lead on paid campaigns across social media platforms is a substantial USD 310, emphasizing the need for highly qualified, targeted campaigns to justify the expense.
- In the B2C world, the average cost-per-click CPC for Facebook Ads traffic campaigns is around USD 0.83, which is generally less than the industry average of USD 4.22 across all digital channels.
| Mobile Ad Spend Share | Projected 83% of total social ad spend by 2029 |
| Digital Ad Pie Share | 30% of all digital ad spending is on social media |
| Avg. Influencer ROI | USD 5.20 generated for every USD 1 invested |
| Avg. B2B Paid CPL Industry | Around USD 310 per lead on paid social |
| Facebook Ads Avg. CPC Traffic | Approximately USD 0.83 per click across industries |
Digital Marketing Outsourcing Statistics
- The Global Digital Marketing Outsourcing Market is expected to reach around USD 74.76 billion by 2034, increasing from USD 25.4 billion in 2024, with a steady growth rate of 11.4% CAGR between 2025 and 2034.
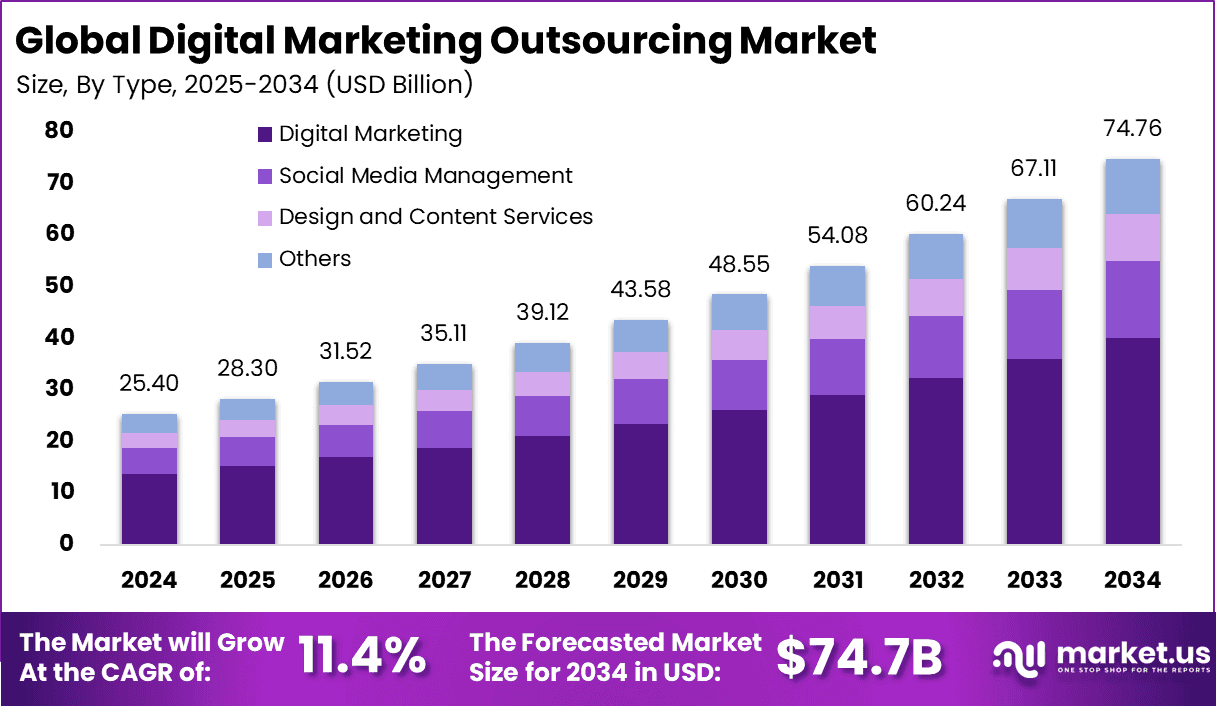
- In 2024, North America led the global market with a 38.6% share, earning nearly USD 9.8 billion in revenue.
- Insights from ExplodingTopics show that 92% of G2000 companies rely on IT outsourcing to reduce costs and focus on key business operations.
- In the Philippines, outsourcing plays a major economic role, contributing about 9% to the country’s GDP, highlighting its strong impact on the economy.
- Approximately 37 percent of small businesses around the world outsource certain activities to become flexible and gain expertise from specialists.
- The growth of the outsourcing industry in China is happening rapidly, as more than 1 million workers are being employed by the industry each year.
- The U.S. market is projected to reach USD 8.82 billion by 2034, growing at a 10.3% CAGR, reflecting steady demand for outsourced digital marketing services.
- In 2024, digital marketing services made up 53.7% of the total market, showing their importance as a main outsourced function.
- The IT and Telecommunications sector held a 23.8% market share, emphasizing its high dependence on third-party digital services to remain efficient and competitive.
AI in Digital Marketing Statistics
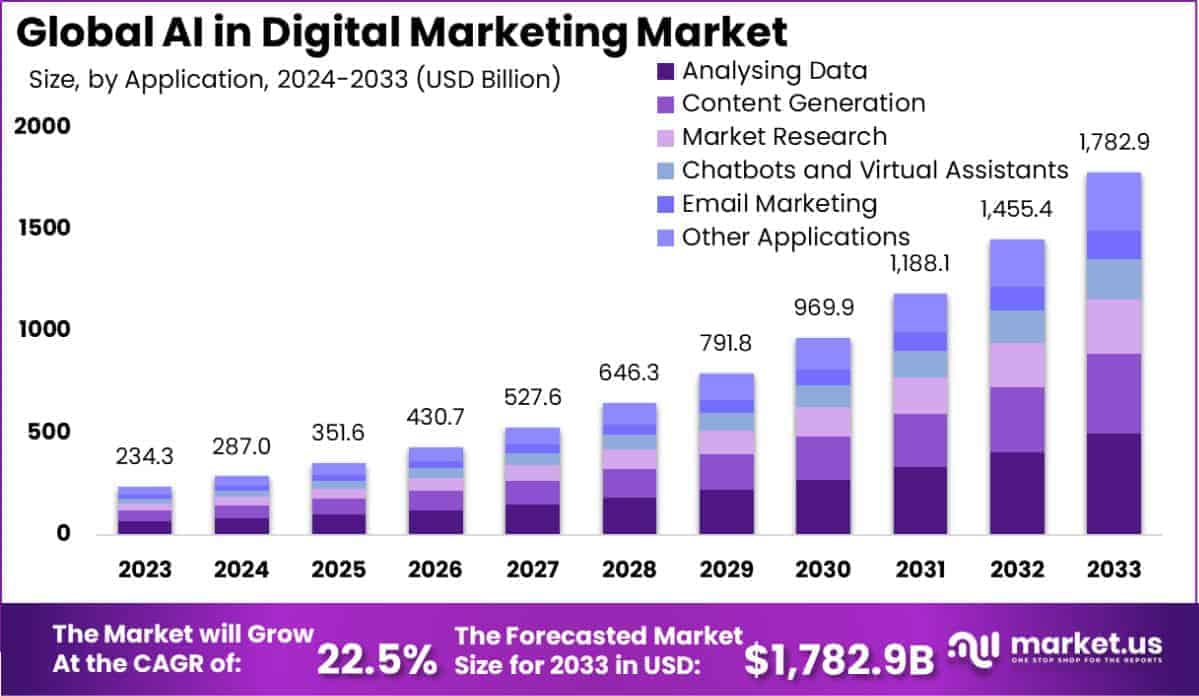
- The Global AI in Digital Marketing Market is estimated to reach USD 1,782.9 billion by 2033, rising from USD 234.3 billion in 2023, with a steady growth rate of 22.5% between 2024 and 2033.
- The use of AI in mobile marketing has become vital, as there are about 5.22 billion unique mobile users worldwide, creating a massive audience for digital marketers.
- Around 61% of digital marketers believe that focusing on SEO strategies is essential to maintain visibility and engagement across different online platforms.
- Over 53% of emails get opened from mobile phones, underlining how essential it is for companies to create mobile-oriented marketing campaigns.
- 86% of businesses use videos in their marketing campaigns, pointing to the trend towards engaging interactive forms of advertising.
- Lead nurturing has been proven to raise the level of sales by 20% in six to nine months’ time, showing the effectiveness of personalized marketing and customer interaction.
- Just 10% of B2B marketers consider influencer marketing a good approach to raising sales, suggesting that many companies might have to reconsider their marketing spending.
- The share of the data analysis application sector was 24.7% in 2023 and thus constituted the leading area of the use of AI in the Digital Marketing Market.
- The retail and consumer goods industry also led the market in 2023, holding a 20.5% share, as these sectors increasingly rely on AI tools for personalized promotions and customer insights.
- North America remained the leading region in the same year, securing a 38.1% market share and generating around USD 89.2 billion in revenue from AI-driven digital marketing solutions.
Consumer Behaviour – How Users are Interacting and Buying?
(Reference: mdpi.com)
- Over 53% of emails get opened from mobile phones, underlining how essential it is for companies to create mobile-oriented marketing campaigns.
- 86% of businesses use videos in their marketing campaigns, pointing to the trend towards engaging interactive forms of advertising.
- Lead nurturing has been proven to raise the level of sales by 20% in six to nine months’ time, showing the effectiveness of personalized marketing and customer interaction.
- Just 10% of B2B marketers consider influencer marketing a good approach to raising sales, suggesting that many companies might have to reconsider their marketing spending.
- The share of the data analysis application sector was 24.7% in 2023 and thus constituted the leading area of the use of AI in the Digital Marketing Market.
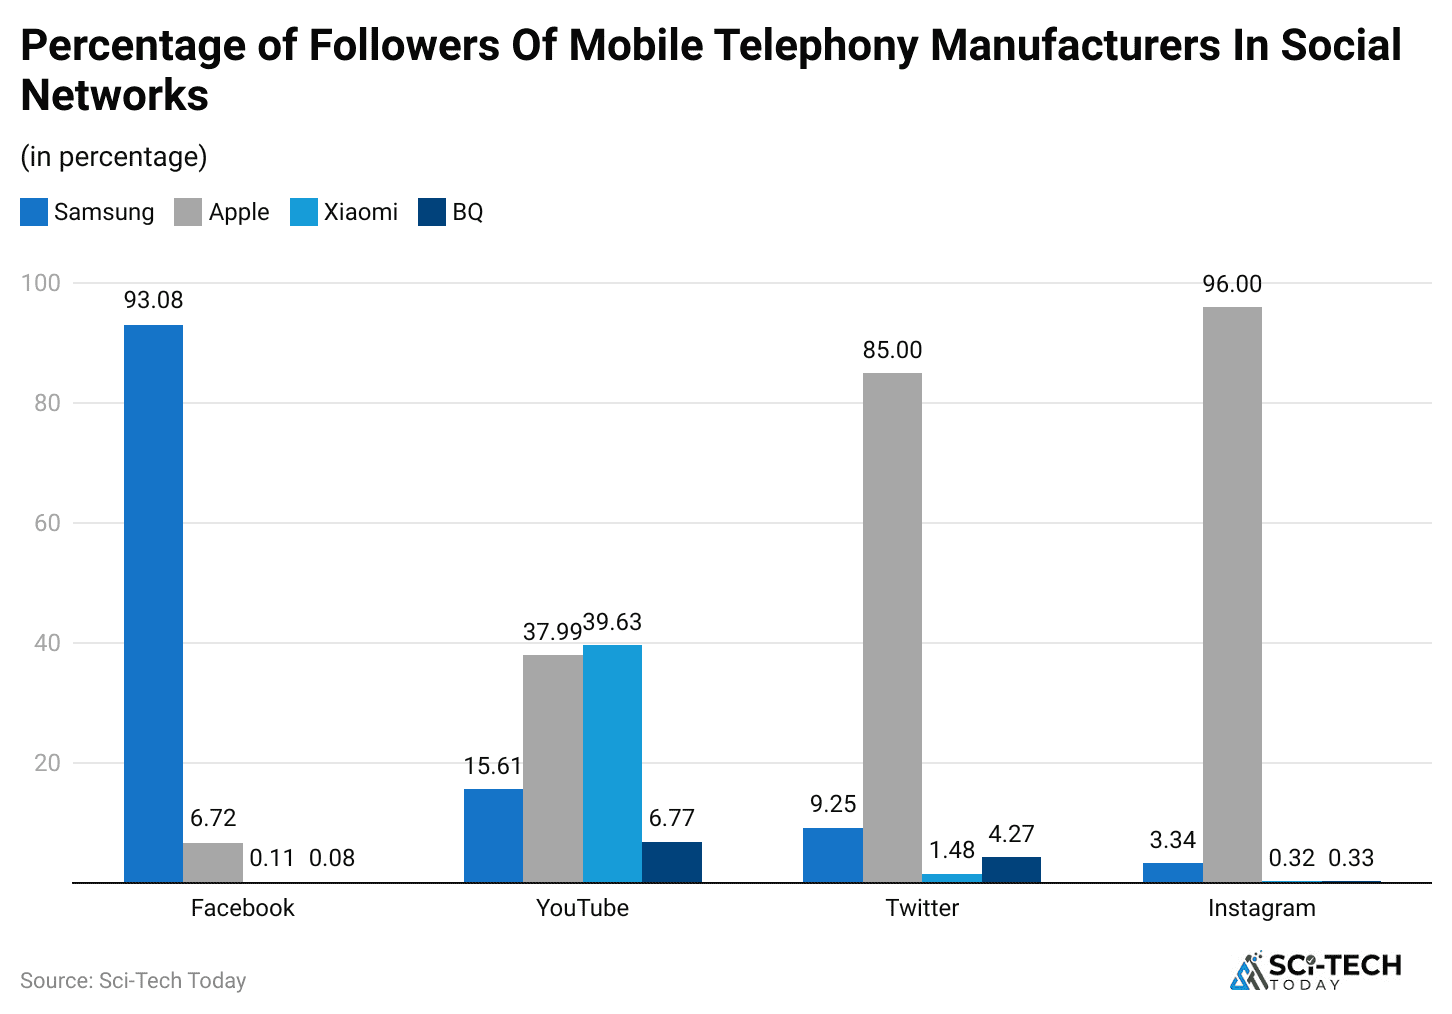
| Purchase after Social Ad | 80% of online users have made a purchase after viewing an ad |
| Primary Discovery Channel | 58% of consumers discover new businesses on social media |
| Impulse Purchase Rate | 81% of users make impulse buys influenced by social content |
| Brand Interaction Increase | 48% of consumers interact with brands more often than before |
| Purchase Research Tool | 54% of consumers research products on social media before buying |
Platform Giant – Detailed Network Statistics 2025
(Reference: backlinko.com)
Meta: Facebook, Instagram, and Threads
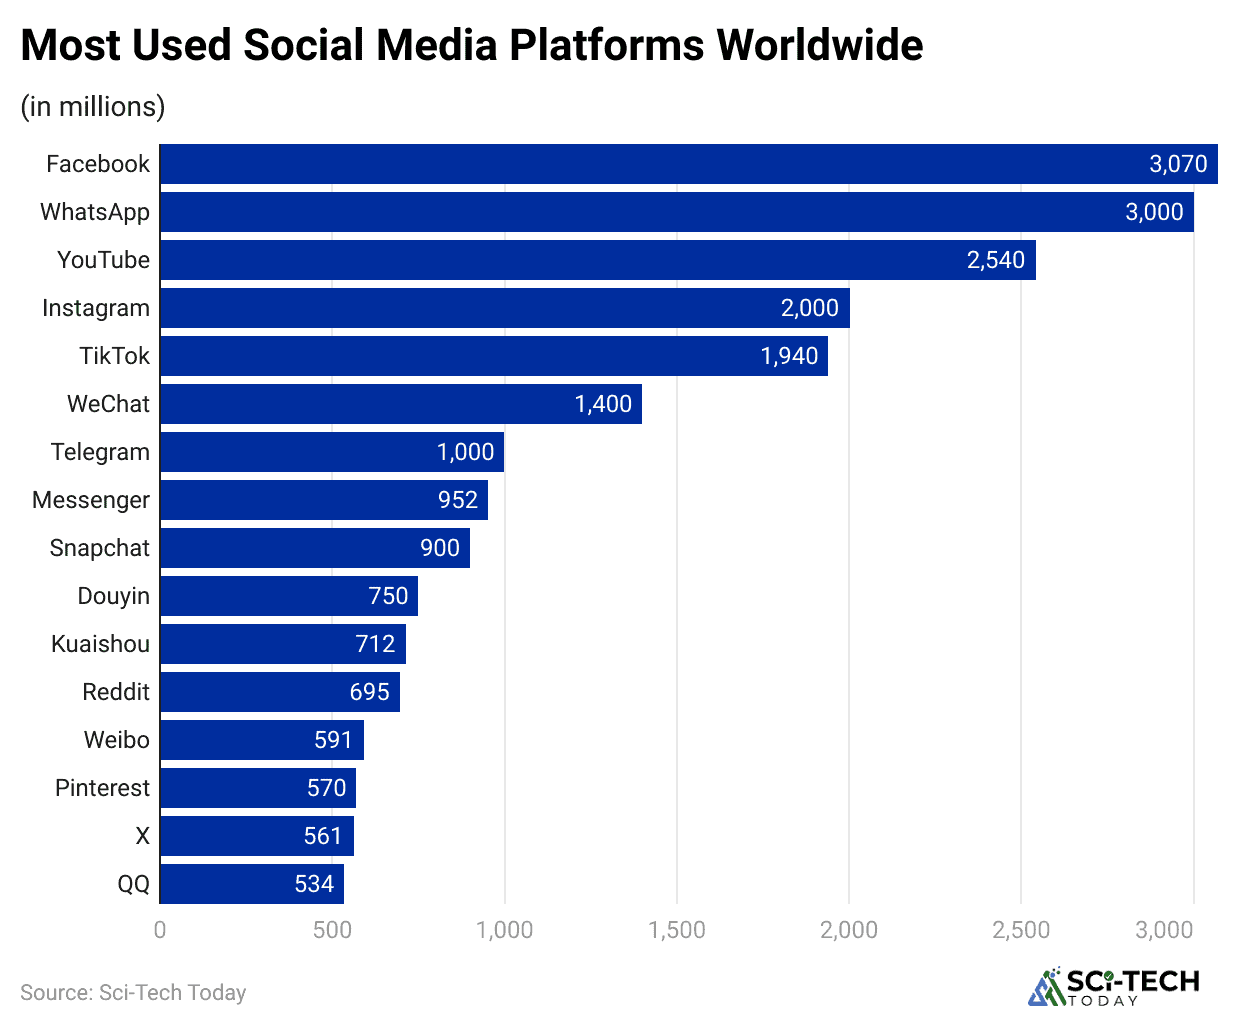
- Facebook remains the largest social network globally, boasting approximately 3.07 billion monthly active users MAUs, and is the most-used platform by an estimated 86% of marketers worldwide.
- Instagram has solidified its reach with over 2 billion MAUs, and a striking 62.3% of its users fall within the highly desirable 18 to 34 age range, making it vital for youth-focused B2C brands.
- Despite a sharp drop in median engagement to a lower rate of about 0.61% in early 2025, Instagram carousel posts continue to outperform others, seeing an average engagement rate of 1.92%.
- The newest entrant, Threads, has quickly scaled up to an estimated 275 million MAUs by late 2024, with its primary demographic also being the 25 to 34 age group, hinting at its potential for real-time conversation.
- Engagement is higher for women on these Meta platforms, with 43.3% of Facebook’s and 47.3% of Instagram’s adult ad reach identifying as female.
| Facebook MAUs | 3.07 billion active users monthly, Global Leader |
| Instagram Key Demographic | 62.3% of users are aged 18 to 34 |
| Instagram Top Content | Carousel posts with a 1.92% average engagement rate |
| Threads MAUs Late 2024 | 275 million monthly active users |
Short-Form Video – TikTok and YouTube Shorts
- TikTok has achieved a colossal user base of approximately 1.58 billion active monthly users, and it converts users into buyers at a highly effective rate of about 43.8%, a major win for social commerce.
- The organic engagement rate on TikTok is still superior to other platforms, with smaller creators under 100k followers seeing rates soar up to an estimated 7.5%, which is more than double the industry average.
- YouTube is the global leader in sheer ad reach, with a massive potential audience of 2.53 billion users, and its short-form product, YouTube Shorts, is now driving an impressive 5.91% engagement rate.
- A significant 78% of people state a clear preference for learning about new products or services through short video content, cementing video’s role as the definitive content format.
- The average user on video-centric platforms is spending a substantial 95 minutes per day watching content on TikTok alone, highlighting the platform’s unique time-sink potential for brands.
| TikTok Buyer Conversion | Converts 43.8% of users into buyers |
| TikTok Organic Engagement | Up to 7.5% for smaller accounts |
| YouTube Global Ad Reach | 2.53 billion potential users |
| Product Discovery Preference | 78% prefer short videos for new product learning |
Professional and Visual – LinkedIn and Pinterest
- For business-to-business (B2B) social media marketing, LinkedIn is still the uncontested leader, as 78% of B2B marketers rank it as one of the top channels that can provide quality leads.
- On LinkedIn, visual and in-depth content drives the best results: multi-image carousel posts pull a high 6.6% engagement rate, significantly higher than text-only updates.
- Pinterest maintains a unique position as a high-intent, visually focused discovery engine with approximately 553 million MAUs and a notable 10% year-over-year growth in early 2025.
- The user base on Pinterest is heavily skewed toward women, with roughly 69.4% of its users identifying as female, making it a critical channel for fashion, home, and beauty brands.
- The platform’s strength is in shopping: an estimated 80% of Pinterest users report being in a shopping mindset while browsing, providing a warmer audience for direct commerce.
| LinkedIn B2B Preference | 78% of B2B marketers rank it as a top lead channel |
| LinkedIn Top Content | Multi-image carousels with 6.6% engagement |
| Pinterest MAUs | 553 million monthly active users |
| Pinterest Shopping Intent | 80% of users are in a shopping mindset |
The New Marketing Playbook – Trends and Content Performance
(Source: smartinsights.com)
Short-Form Video and UGC Dominance
- Short-form video is the most influential type of social content, and 93% of marketers have reported plans to increase the amount of time they dedicate to social media marketing efforts in 2025.
- UGC is the ultimate catalyst for engagement, being engaged with 8.7 times more often than branded content that is created and posted directly by the company.
- A high need for authenticity, with 86% of consumers saying the authenticity of the brand is a key element in deciding on which companies to support and purchase from.
- Over 50% of tech companies state that having a robust community presence on social media is a key element in their marketing strategies.
Social Media Advertising and ROI Statistics
- Revenue generated from social media commerce is forecasted to reach USD 1 trillion in 2028.
- Social ads’ revenues are estimated to reach USD 276.72 billion in 2025.
- For each dollar invested, Influencer marketing was found to generate an ROI of USD 5.78 in 2025.
- Our recent video marketing stats show that marketers make use of short video formats such as TikTok, Instagram Reels & YouTube Shorts for improved ROI.
- Average ROAS is anticipated to be 2.4x for TikTok ads.
- Companies that reply within 24 hours in case of crisis or queries from customers are seen reducing reputation damage by 30%.
B2B and Lead Generation Performance
- Over half of all B2B marketers, 53%, now specifically choose social media marketing as a core channel for driving sales results and lead generation across their campaigns.
- Content marketing generally is a high-performing lead generation channel, costing just USD 92 per lead on average, which is significantly less than the estimated organic cost per lead of USD 409.07 across all channels.
- 84% of B2B buyers rely on social media as a primary source of information during their purchase decision process, proving that social channels are influential even for complex, high-value deals.
- 33% of salespeople have reported that social media platforms are a source of the highest quality leads they receive in their pipeline.
| UGC Engagement vs. Brand | 8.7x higher engagement for User-Generated Content |
| Authenticity Factor | 86% of consumers prioritize brand authenticity for support |
| B2B Marketer Social Focus | 53% use social for driving lead generation results |
| Avg. Content CPL | USD 92 per lead for content marketing |
The New Retail Landscape – Social Commerce and Reputation
(Source: accenture.com)
The Social Commerce Boom
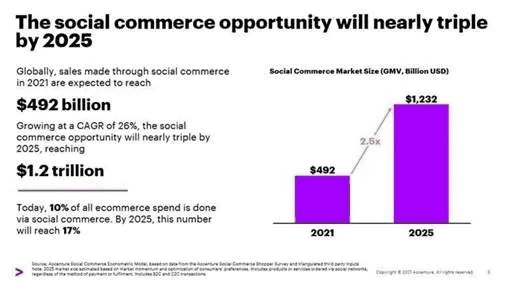
- Global social commerce sales are projected to reach a massive USD 1.2 trillion by 2025, a clear signal that the window for in-app purchasing is rapidly expanding beyond simple clicks.
- Approximately 48% of social media users have made a purchase directly through a social media application, fundamentally blurring the lines between browsing and buying.
- In the United States, Facebook’s add-to-cart rate for social commerce stands at a respectable 34.1%, indicating a high propensity for users to move from discovery to purchase intent quickly.
- 71% of consumers are significantly more likely to purchase a product if they see positive reviews or recommendations directly on a social media platform, emphasizing the power of social proof.
Reputation and Customer Service
- An extremely tough 45% of consumers would go on to share their negative experience with the brand on social media. This makes it a very mission-critical task of managing the brand’s reputation.
- An extremely demanding 76% of consumers are looking to get customer service and support through social media. In essence, the social media channels have become the primary means of contact between consumers and the brand.
- Nearly 90% of social media consumers have already contacted brands via social media. This demonstrates how the conversation has become the battleground of customer relations.
- Since crisis management is always a concern, an extremely tough 53% of consumers expect responses from the brand to their negative comments or feedback in just one week.
| Global Social Commerce Value | Projected USD 1.2 trillion by 2025 |
| In-App Purchase Rate | 48% of users have purchased directly through a social app |
| Facebook Add-to-Cart Rate US | 34.1% for social commerce |
| Negative Sharing Rate | 45% of consumers will share a negative brand experience |
Wrapping Up
Overall, this data from 2025 is an instruction manual for effective social media marketing. It’s not enough to be present; you have to be precise, authentic, and fast. The competition for attention is fiercer than ever, and only those who commit to a successful strategy will capture the exponentially growing revenue.
The mandate is simple: stop relying on intuition and start leveraging this data. The average person is using nearly 7 different social platforms monthly, demanding a diversified presence. Short-form video is a requirement, with 78% of people preferring it for product education.
And most importantly, the massive financial projections- the USD 276.7 billion in ad spend and the USD 1.2 trillion in social commerce- show that the market is rewarding precision, authenticity, and conversion-focused content. I hope you like this article. Thanks for staying up till the end.

Sources