
Introduction
Technology Growth Statistics: Technology is advancing faster than ever and changing the way we live every day. The growth has both positive and negative impacts, like affecting how people work, talk to each other, learn, and even relax. Advanced tools, including artificial intelligence, cloud systems, smartphones, and smart gadgets, have become part of our daily routine. Ideas, plans, and initiatives that once took many years to develop are now becoming reality in a very short time, that promoted innovation, global connections, and the need for faster, easier solutions.
The influence of technology is not limited to business and money; it also enables improvements in education, healthcare, government services, and social life. At the same time, this rapid growth also created many challenges, including data security, ethical concerns, and unequal access.
Hopefully, the overall report will help you understand the importance of technology and its evolution, so we can enjoy its benefits while managing its risks responsibly.
Editor’s Choice
- In 2025, Wi-Fi IoT, Bluetooth IoT, and cellular IoT technologies together accounted for a 80% of total IoT connections globally.
- In the same period, the global technology market has reached USD 5.8 trillion, growing at a 5.2% annual rate.
- As of 2026, the global base of active IoT devices is expected to reach around 23.9 billion.
- There are 90,904 AI companies worldwide, including 29,618 in the United States, which also attracts 63% of global AI investment.
- In North America, total technology spending reached USD 1.94 trillion in 2025.
- The total global IT spending is projected to reach USD 6,084.085 billion in 2026, reflecting an overall growth rate of 9.8% across all IT segments.
- In 2025, the highest IT spending was observed in Latin America, with a strong growth rate of 9%.
- North American and European businesses are expected to allocate their IT budgets to software and hardware projects, with hardware receiving the largest share at 19% of the total IT budget.
- Between 2023 and 2027, most companies are expected to adopt digital platforms and apps (86.4%), education and workforce development technologies (80.9%), and big-data analytics (80.0%).
- Digital identity and biometric systems are now adopted by 42% of financial institutions to strengthen security standards.
Global Technology Market Growth Statistics
- According to sqmagazine.co.uk, the global technology market has reached USD 5.8 trillion in 2025, growing at a 5.2% annual rate.
- North America accounted for the highest global technology spending, contributing about 34% of total worldwide demand.
- In 2025, the Asia-Pacific region is expected to record strong momentum, with the technology market expanding by 7.1%.
- The enterprise software segment will reach approximately USD 915 billion.
- Consumer hardware sales are expected to decline by 2.3%, including smartphones and wearables.
- Europe’s technology industry grew by 4.9% in 2025, reaching USD 1.3 trillion.
- Africa’s technology market is on track to surpass USD 180 billion, while Latin America grown by 6.2%.
- Meanwhile, global IT services revenue is expected to cross USD 1.5 trillionby 2026.
Key Drivers of Technological Advancement
- Artificial Intelligence is the main growth force in 2025, with 64% of companies actively using at least one AI system in operations.
- Remote and hybrid work continue to drive demand for collaboration tools, creating a USD 96 billion market.
- Venture capital funding in automation is up 38% year-over-year.
- Global semiconductor production is projected to grow 12.4% to USD 648 billion.
- G20 governments will invest over USD 330 billion in tech research and development.
- Cloud-native development is a top priority for 72% of CTOs in 2025.
- AI chip projects attracted more than USD 14 billion in new funding.
- In the same period, the global funding for quantum computing research reached USD 7.2 billion.
- Digital twin adoption rate increased to 22% in manufacturing firms.
Global IoT Connectivity Growth And Technology Trends
(Source: iot-analytics.com)
- In 2025, Wi-Fi IoT, Bluetooth IoT, and cellular IoT technologies together accounted for a 80% of total IoT connections globally.
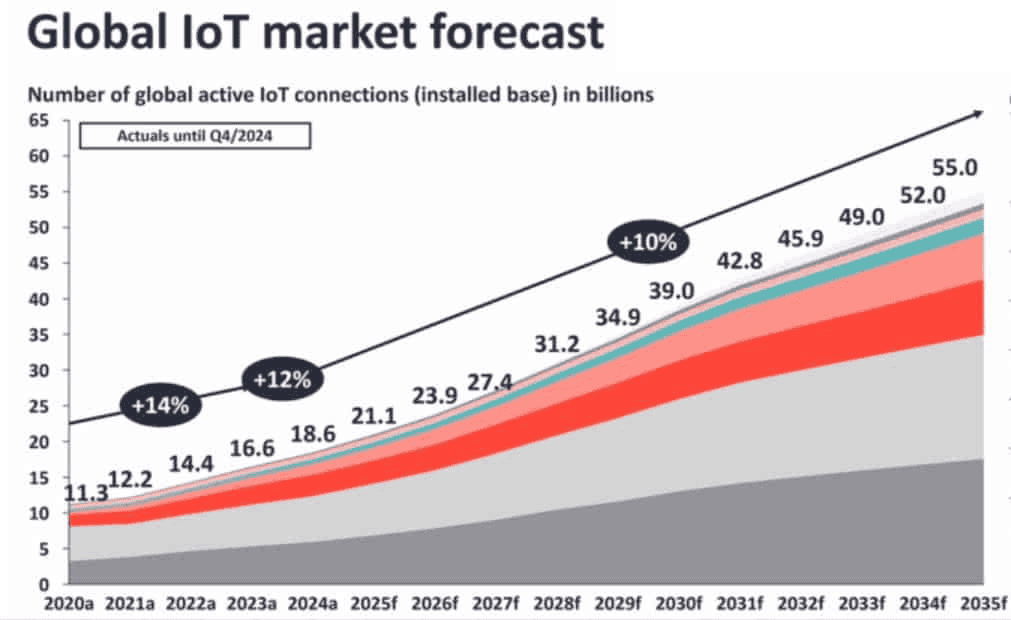
- As of 2026, the global base of active IoT devices is expected to reach around 23.9 billion.
- Additionally, global IoT connections are expected to expand to about 55.0 billion devices by 2035, with an average CAGR of around 10% from 2025 to 2035.
- Wi-Fi remained the dominant technology, accounting for 32% of global IoT connectivity, followed by Bluetooth (24%) and cellular IoT (22%).
- Nearly 20% of Gen Z workers fear AI could replace their jobs soon.
- There are 90,904 AI companies worldwide, including 29,618 in the United States, which also attracts 63% of global AI investment.
- About 78% of businesses and 90% of tech workers already use AI tools in their daily work.
- Digital payments, e-commerce, cloud computing, AR/VR, and IoT adoption increased rapidly, with cloud usage above 90%, e-commerce nearing USD 8 trillion, and 21.1 billion IoT devices active globally by 2025.
Global Technology Adoption Trends
- According to nogentech.org, Japan is ranked as the most technologically advanced country, with a population of about 125 million and a GDP of USD 4.21 trillion.
- China has the largest number of internet users at 1.11 billion, followed by India with 806 million and the United States with 322 million.
- Tokelau has only 660 internet users, making it one of the least digitally connected regions.
- Global AI spending is rising fast, increasing from USD 283 billion to USD 325 billion by 2026, with annual growth of about 15%.
- Generative AI spending reached USD 644 billion in 2025, growing 76.4% year over year.
Digital Technology Growth Trends
- A report by Itransition found that about 83% of enterprises regard AI as a core strategic priority by the end of 2025.
- The Internet of Things (IoT) ecosystem is rapidly expanding, with around 21.1 billion connected devices.
- At the same time, around 70% of new applications are expected to be built using low‑code/no‑code tools by 2025.
- Globally, an estimated 6 billion people, nearly three‑quarters of humanity, will be online, with about 5.78 billion using mobile phones.
- Demand for tech talent remains strong, with the global developer population forecast to exceed about 28.7 million by 2025.
AI And Machine Learning Growth Trends
- sqmagazine.co.uk further stated that the AI market reached USD 407 billion in 2025, rising from USD 317 billion in 2024.
- NLP solutions are used by 62% of enterprises, while generative AI in product development is up 48% since January 2025.
- AI ethics tools are adopted by 28% of Fortune 500 firms, and 59% of data teams depend on MLOps platforms.
- Patent filings crossed 55,000 in Q2 2025, up 12% year-on-year.
- AI creates 31% of brand marketing content, supports 41% of recruitment screening, and SMB AI adoption grew 37%, mainly in chatbots and analytics.
Enterprise Digital Transformation Trends And Impact
- McKinsey reported that 92% of enterprises were running digital transformation programs in 2025.
- 48% of industrial firms adopt automation and robotics, while 61% of organisations invest in next-generation ERP systems, according to Deloitte.
- Customer Data Platforms are used by 58% of marketing teams to enable real-time personalisation.
- Digital twin adoption increased by 40% in manufacturing-led sectors.
- About 73% of enterprises now provide digital reskilling, and the average ROI from transformation reached 178%.
- Remote IT tools support 66% of IT departments, legacy system removals rose 31%, and 87% of S&P 500 firms have a Chief Digital Officer, up from 69% last year.
Regional Comparison of Technology Growth In 2025
| Region / Country | Key Growth Insight |
| North America | Total technology spending has reached USD 1.94 trillion. |
| Asia-Pacific | The technology sector is projected to grow by 7.1% year over year. |
| China | The tech industry value is forecasted at USD 960 billion. |
| India | Technology exports are set to exceed USD 208 billion. |
| Latin America | The region recorded 6.2% growth. |
| Africa | The digital economy reached USD 180 billion. |
| Middle East | Investments in AI and smart cities surpassed USD 14 billion. |
| Canada | Technology employment increased by 8.7% through innovation partnerships. |
| Australia | Startup funding reached USD 6.2 billion, up 34% from last year. |
IT Spending Growth Statistics By Segments
- According to Gartner, total global IT spending is projected to reach USD 6,084.085 billion in 2026, reflecting an overall growth rate of 9.8% across all IT segments.
| IT Segment | Spending (USD billion) | Growth Rate |
| Data Centre Systems | 582.446 | 19.0% |
| Devices (PCs, mobiles, etc.) | 836.275 | 6.8% |
| Software | 1,433.037 | 15.2% |
| IT Services | 1,869.269 | 8.7% |
| Communications Services | 1,363.058 | 4.5% |
By Regions
(Reference: sqmagazine.co.uk)
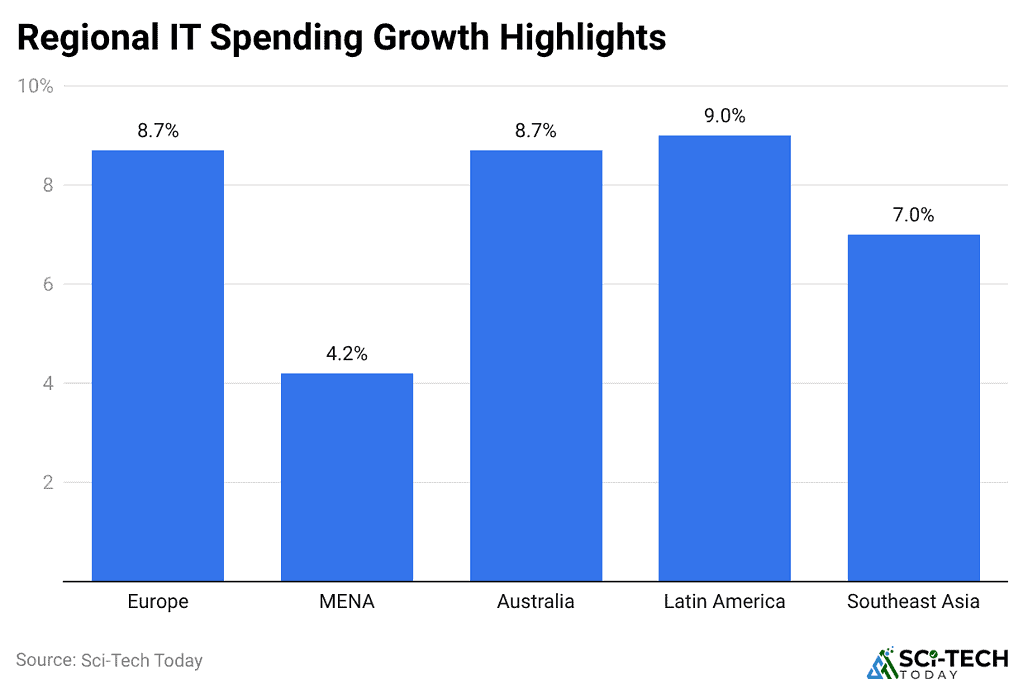
- In 2025, the highest IT spending was observed in Latin America, with a strong growth rate of 9%.
- Europe and Australia separately reported 8.7% technology growth rates, while Southeast Asia followed with a healthy 7% growth rate.
- In contrast, the Middle East and North Africa (MENA) region records slower growth at 4.2%.
IT Budget Growth Analyses For North American And European Businesses In 2025
(Source: aiprm.com)
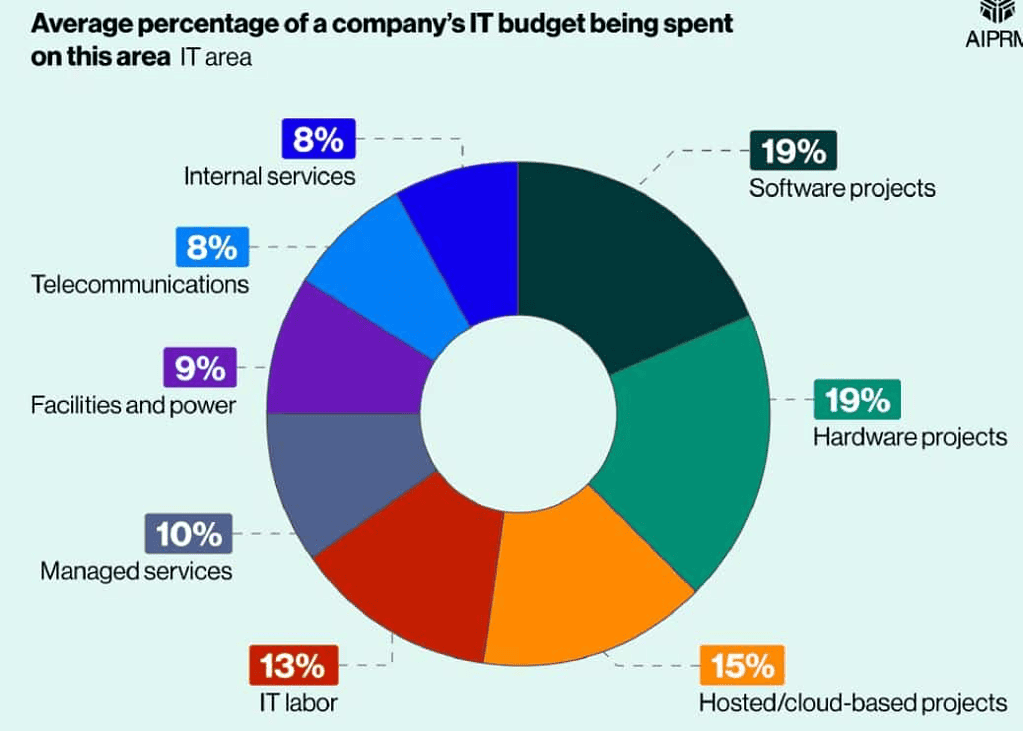
- In 2025, North American and European businesses are expected to allocate their IT budgets to software and hardware projects, with hardware receiving the largest share at 19% of the total IT budget.
- Hosted or cloud-based projects accounted for 15%, followed by IT labour at 13%.
- Managed services accounted for 10%, while facilities and power are expected to account for 9%.
- Telecommunications and internal services each consumed up to 8% of the IT budget.
Top 10 Tech Companies By Market Cap
- A report published by Tech Booky at the beginning of 2026 found that Nvidia leads with a market value of about USD 4.5 trillion, followed by Alphabet at USD 3.9 trillion, Apple at USD 3.84 trillion, and Microsoft at USD 3.55 trillion.
- Other major firms include Amazon (USD 2.63 trillion), TSMC (USD 1.65 trillion), Meta (USD 1.63 trillion), Broadcom (USD 1.58 trillion), Tesla (USD 1.45 trillion), and Saudi Aramco USD 1.52 trillion. However, it is not a pure tech company.
Technology Adoption Rate By Companies
(Reference: aiprm.com)
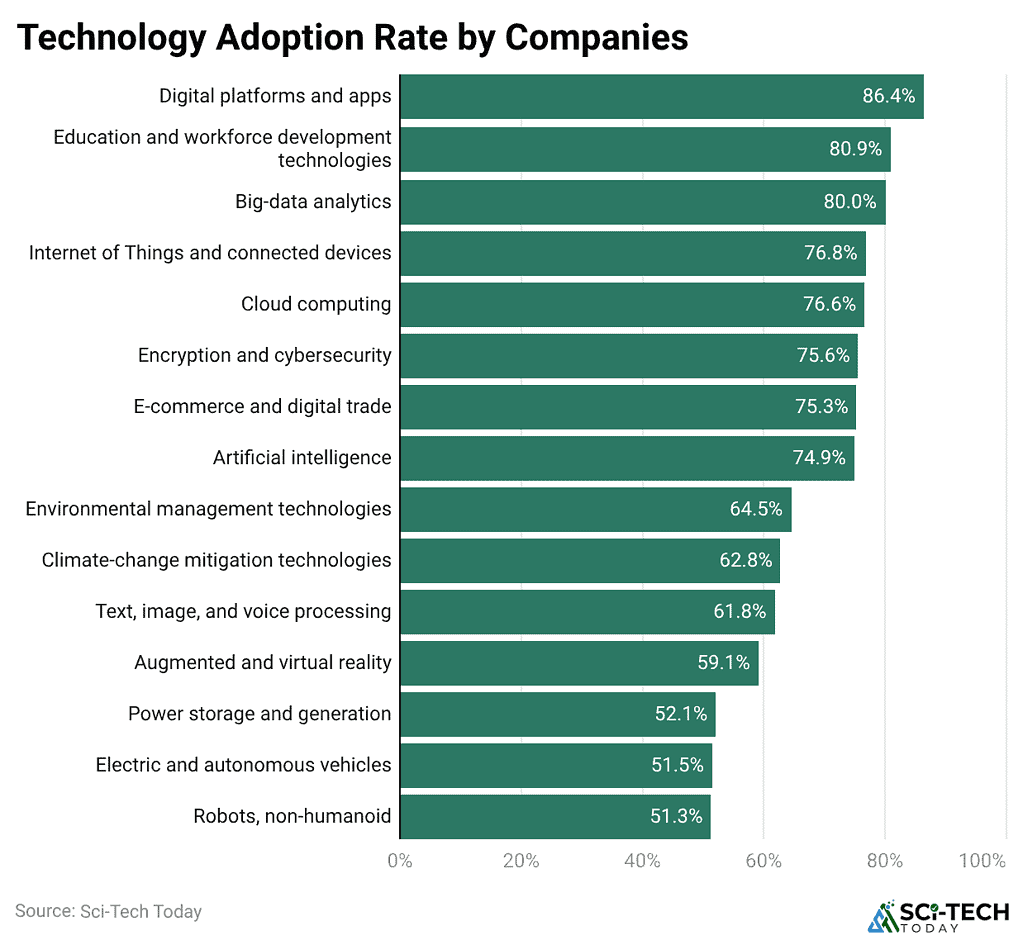
- Between 2023 and 2027, most companies are expected to adopt digital platforms and apps (86.4%), education and workforce development technologies (80.9%), and big-data analytics (80.0%).
- Other most prominent technologies followed by Internet of Things (IoT) and connected devices at 76.8%, cloud computing at 76.6%, encryption and cybersecurity at 75.6%, e-commerce and digital trade at 75.3%, artificial intelligence at 74.9%, environmental management technologies at 64.5%, climate-change mitigation technologies at 62.8%, text, image, and voice processing at 61.8%, augmented and virtual reality at 59.1%, power storage and generation at 52.1%, electric and autonomous vehicles at 51.5%, and non-humanoid robots at 51.3%.
U.S. Technology Workforce Trends
- census.gov report further stated that the U.S. tech sector employs 12.8 million people in 2025, equal to 8.1% of the total workforce.
- Job openings reached 682,000 in Q1 2025, led by AI and cybersecurity roles.
- Average tech pay increased to USD 122,000, up 4.6% year over year.
- Remote roles account for 48% of postings, with hybrid work the dominant model.
- AI jobs grew 28%, while women’s representation increased to 32%.
- Over 430,000 learners joined tech apprenticeships, layoffs fell 14%, retention improved 11%, and freelance tech work jumped 35%.
By Working Habits of U.S. Professionals
- According to AIPRM, 45% of technology professionals work for technology companies, while 55% work for companies in non-technology sectors.
- 61% of employees at technology companies hold tech roles, including IT support, software development, and web design.
- 39% of employees at technology companies work in non-tech roles, including sales, marketing, or HR.
Impact of Key Supply Chain Technology Trends, 2025
| Supply Chain Technology Trend | Major Impact | Minor Impact |
| Big Data and Analytics | 36% | 41% |
| Supply Chain Digitalisation | 36% | 39% |
| Process Standardization | 43% | 28% |
| Cloud Services | 39% | 26% |
| Artificial Intelligence | 26% | 35% |
| Sustainability Technologies | 30% | 30% |
| Robotic Process Automation (RPA) | 17% | 43% |
| Blockchain | 17% | 28% |
Recent Development In Technology Growth
- A report published by sqmagazine.co.uk in 2025 stated that open-source AI tools recorded 54% growth rate.
- Digital identity and biometric systems are now adopted by 42% of financial institutions to strengthen security standards.
- Global investment in space technology reached USD 16.8 billion.
- Voice-based AI is integrated into 71% of newly released smart devices.
- Major technology firms committed USD 9.2 billion to university-led research programs.
- Wearable health technology became a USD 58 billion market, driven by real-time monitoring.
- 19% of Web3 developers use decentralised storage platforms.
- Around 47% of enterprise developers use low-code and no-code tools.
- Digital therapeutics platforms are reimbursed across 32 countries, confirming strong healthcare adoption.
Conclusion
After completing the article on Technology Growth Statistics, it is clear that technology is playing a major role in shaping today’s world. It has made daily tasks easier, improved the way people connect, and created new opportunities in areas such as learning, health, and work. However, rapid technological growth also raises many problems, such as privacy risks, safety issues, and unequal access for some people.
Appropriate implementation of technology, along with extra care and responsibility, society can turn these changes into positive outcomes and build a better future for all.
FAQ
Technology is advancing rapidly due to new ideas, wide internet availability, growing demand for smart tools, and ongoing research.
It speeds up communication, reduces effort, saves time, and helps people study, work, shop, and stay connected more easily
Modern technology strongly supports areas such as education, healthcare, business, transport, communication, and entertainment.
The main challenges include online safety risks, privacy concerns, job changes, and unequal access to digital resources.
By creating strong laws, promoting digital education, protecting user data, and encouraging responsible use of technology.
