





Overview
Android phones statistics: Android has cemented its status as the dominant force in the global mobile landscape since the platform’s initial release in 2008. This study offers a thorough analysis of the market for Android phones in 2025 and 2026, emphasizing important trends, advancements in the industry, and consumer behaviour. With a 72.77% market share as of 2025, Android phones continue to rule the worldwide smartphone scene, according to data.
This article provides a comprehensive analysis of the Android phone market, meticulously detailing everything from its immense user base to the intricate hardware trends changing its future. If you need to understand the true scale and direction of Android Phones, this is the only statistical resource you will need. So, let’s get into the data.
The Editor’s Ultimate Picks
- The Global Smartphone Market is projected to reach approximately USD 876.00 billion by 2032, climbing from USD 602.8 billion in 2025, showcasing a robust Compound Annual Growth Rate CAGR of 70% during the forecast period from 2023 to 2032.
- The Android operating system currently commands a colossal 9% share of the global mobile OS market, solidifying its position as the preferred platform for the majority of the world’s smartphone users.
- The total active user base for Android Phones has recently surged past 6 billion individuals worldwide, illustrating the platform’s enduring, widespread demand and accessible nature.
- Android controls 72.77% of the global smartphone market as of 2025.
- Despite the average global price for an Android smartphone hovering around USD 254, high-end flagships from top manufacturers are increasingly pushing the Average Selling Price ASP higher in developed markets.
- The average price of Android smartphones in 2025 is around USD 300, still much lower than the iPhone’s USD 800+ average price point.
- On average, Android users spend about 3 hours and 45 minutes on their devices daily.
- In the United States, which is traditionally an iOS-dominated region, nearly 42% of all smartphone users still choose an Android device for their daily mobile experience.
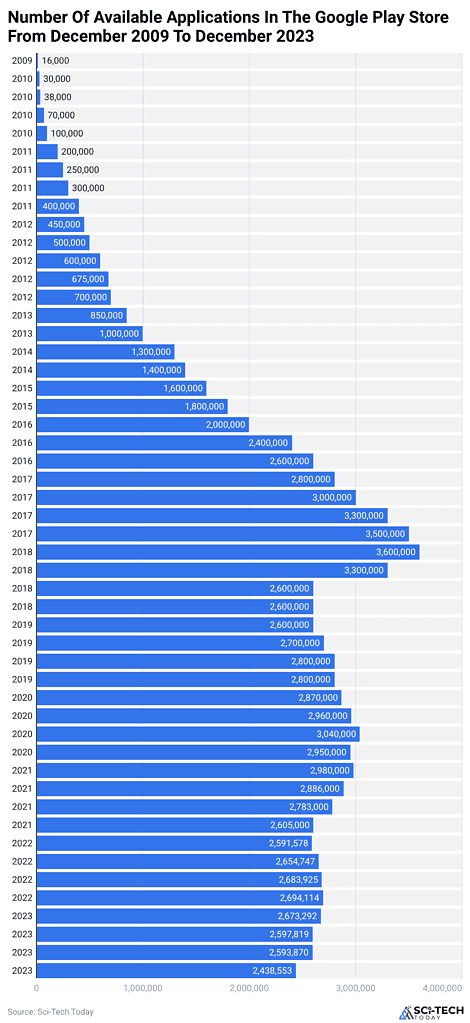
- There are over 3.9 million apps available on the Google Play Store as of 2025, up from 2.67 million in early 2023.
- The latest broadly deployed Android versions in 2025 are Android 14 and 15, with Android 15 at around a 17% share and Android 14 at 13%, while Android 16 follows in late 2025/2026.
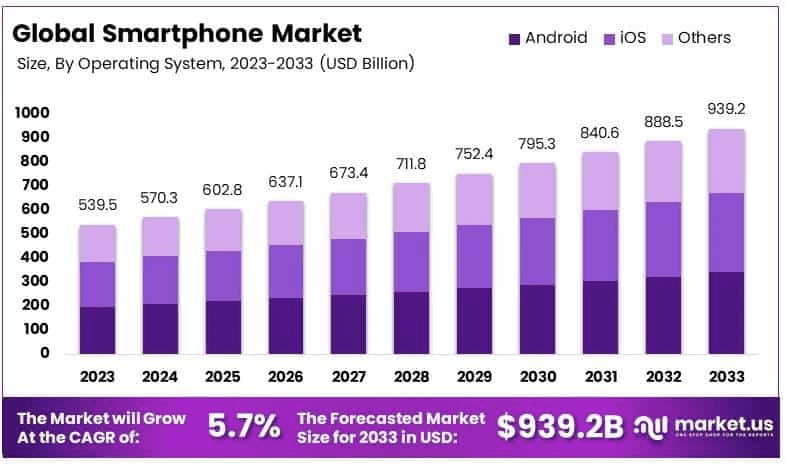
Android Phones Market Share
(Source: market.us)
Financial and Market Dominance
- The total market value for smartphones is on track for massive expansion, with projections showing a climb from USD 602.8 billion in 2025 to a substantial USD 939.2 billion by 2033.
- This strong growth forecast represents a healthy Compound Annual Growth Rate CAGR of 5.7% over the decade spanning from 2025 to 2033.
- The Android operating system maintains a commanding global lead in the market, capturing a dominant share of 63.4% of all active smartphones due to its open-source flexibility and widespread adoption by manufacturers.
- When it comes to where people buy their devices, the Original Equipment Manufacturer OEM store segment, which includes official brand stores and online channels, accounts for the largest piece of the pie at 47.6%.
Regional and Technology Adoption
- North America is a major financial hub for the market, making up a significant 42.6% of the global value, which translates to a massive USD 229.83 billion due to high spending on premium devices and established 5G networks.
- Meanwhile, the Asia Pacific APAC region, led by countries like China, India, and South Korea, is the fastest-growing market.
- The global shift to high-speed connectivity is accelerating rapidly: by the end of 2025, an estimated 45% of the world’s 5.3 billion active smartphones will be 5G-ready, which is a huge jump from the current figure of 15%.
Competitive Landscape
- In Q1 2025, Samsung again led the global smartphone market, shipping around 60.6 million smartphones, driven by the Galaxy S25 Ultra and refreshed Galaxy A series, matching or slightly exceeding its Q1 2024 volume
- These top-tier Samsung flagships are heavily emphasizing Artificial Intelligence and advanced display development.
- In Q1 2025, Xiaomi shipped around 42 million smartphones globally, a 2.7% year-over-year increase, while in China its shipments surged nearly 40% YoY to 13.3 million units, allowing it to reclaim the top spot in its home market.
| Market Value 2025 | USD 602.8 Billion | 2025 |
| Market Value 2033 | USD 939.2 Billion |
2033 Forecast |
|
Growth Rate CAGR | 5.7% | 2024 to 2033 |
| Android Market Share | 63.4% |
Latest Data |
|
Leading Sales Channel | 47.6% | Latest Data |
| North America Market Share | 42.6% USD 229.83 Billion |
Latest Data |
|
5G Readiness 2024 | 45% of 5.3 billion phones | 2024 Projection |
| Samsung Q1 2024 Sales | 60 million Units |
Q1 2024 |
|
Xiaomi Shipment Increase | 27.4% YoY |
Q1 2024 |
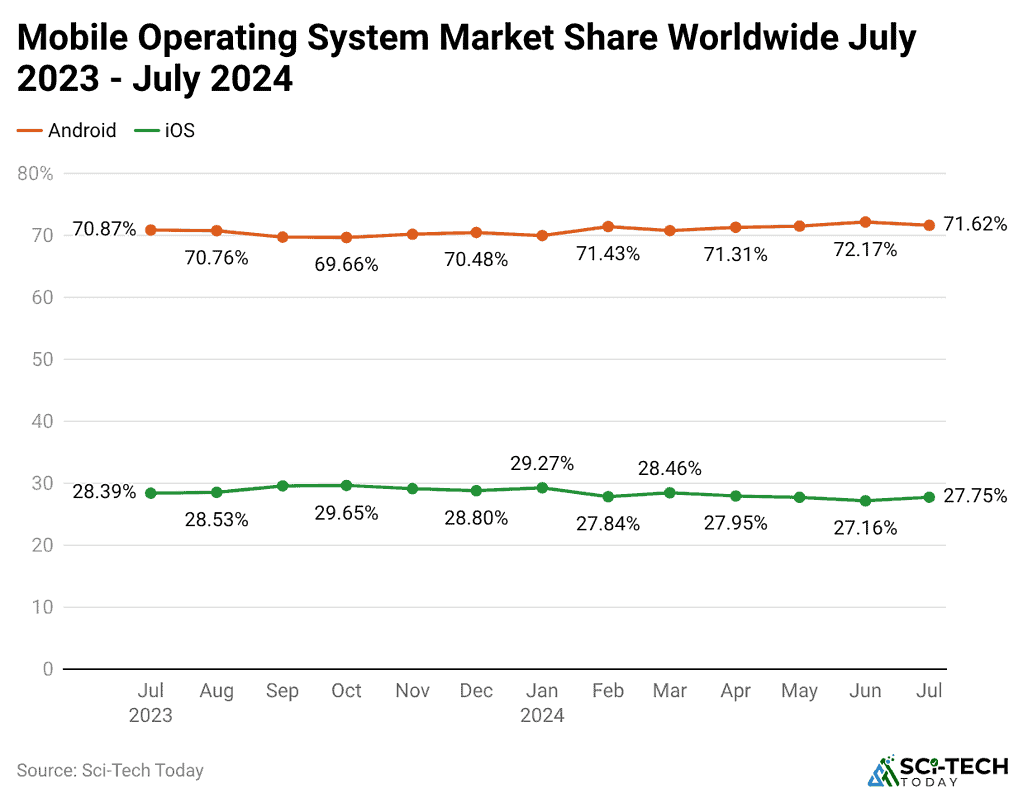
Mobile Operating System Market Share Statistics
(Reference: gs.statcounter.com)
- Android maintained a dominant global market share throughout the period, starting at 72.15% in January 2025 and ending around 72.77% by late 2025, reinforcing its position as the world’s leading mobile operating system.
- iOS maintained a consistent but smaller share, starting at 27.37% in January 2025 and ending around 28% by late 2025, indicating relative stability despite minor fluctuations.
- Android still saw short-term dips in some months of 2025 but remained above 70% overall, while iOS peaked near 29.1% before easing slightly later in the year.
- iOS reached its peak market share of 29.27% in January 2024, marking its strongest performance over the 13 months.
- Android showed a steady upward trend from January 2024 (69.83%) through July 2024, climbing to 72.17% in June before settling at 71.62% in July, indicating renewed momentum.
- iOS experienced a gradual decline after its January 2024 peak, dropping to 27.16% by June 2024, before slightly recovering to 27.75% in July.
- The gap between Android and iOS remained relatively consistent throughout the year, generally hovering around a 43% point difference, highlighting Android’s substantial and sustained global lead.
- Despite minor month-to-month fluctuations, both operating systems demonstrated overall market stability, with Android consistently controlling roughly 70% of the global mobile OS market and iOS maintaining just under 30% throughout the 13 months.
Foldable Smartphones Market Statistics
(Source: market.us)
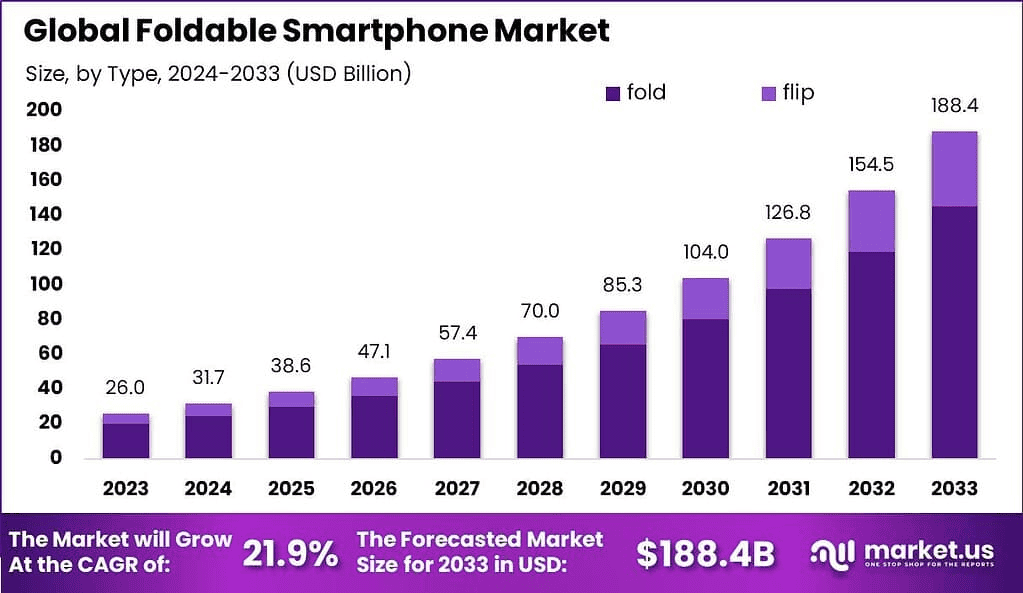
- The foldable market is projected for explosive financial growth, expected to surge from USD 38.6 billion in 2025 to a monumental USD 188.4 billion by 2033.
- This astonishing growth is reflected in an exceptionally high Compound Annual Growth Rate CAGR of 21.9% from 2025 to 2033, a rate far exceeding that of the traditional smartphone market.
- Global shipments of these novel devices reached around 20 million units in 2025, marking a substantial 25% YoY increase that highlights the fast-paced consumer adoption.
- Experts project that this rapid adoption will only accelerate, with foldable smartphone shipments expected to increase by an even higher 38% globally in 2025.
Applications in the Google Play Store
(Reference: statista.com)
- Google Play was initially launched in October 2008 as Android Market. Serving as Google’s official app store, it provides users with a vast selection of applications and digital media, including music, magazines, books, films, and TV shows.
- According to Android phone statistics, as of 2025 the top‑grossing Android apps worldwide are still predominantly mobile games, with titles like Coin Master, Garena Free Fire, and PUBG Mobile (alongside newer hits) leading the rankings.
- This dominance of gaming apps is no surprise, as Android phone statistics now estimate that gaming apps contribute roughly 75% of Google Play’s app revenues by 2025, up from the 70% share previously projected for 2024, highlighting the significant role of gaming in the Android ecosystem.
Form Factor and Regional Preferences
- The most popular form factor for these devices is the Flip Device, which folds horizontally like a clamshell: 67% of all owned foldables fall into this category.
- The larger, book-style Foldable Devices, which open up to provide a tablet-sized screen, make up the remaining 33% of the market share
- In 2025, the Inward Folding Smartphones design, where the main screen is protected when closed, held the largest segment share in 2023 at 62.1%, a preference driven by key technological developments in the hinges and displays.
- The APAC region is the engine for this market, leading the way in 2025 by capturing 44% of the market share and generating USD 18 billion in revenue.
Manufacturer and Consumer Behaviour
- Despite its rapid growth, foldable smartphones still represent a small percentage of total devices, accounting for only 1% of all smartphones held across major developed markets.
- Huawei overtook Samsung as the world’s largest foldable smartphone vendor, capturing approximately 48% of global shipments in H1 2025 (about 8.9 million units) compared to Samsung’s 20% share.
- In a key metric, 46% of US consumers have already stated a preference for Samsung foldable smartphones.
- Consumer preference in the US is clear: 49% of consumers there prefer the smaller, vertical flip-type foldables over the larger, book-type designs.
| Foldable Market Value 2024 | USD 31.7 Billion | 2024 |
| Foldable Market Value 2033 | USD 188.4 Billion | 2033 Forecast |
| Foldable Growth Rate CAGR | 21.9% | 2024 to 2033 |
| Global Shipments | 15.9 Million Units | 2023 |
| Shipment Growth YoY | 25% Increase | 2023 vs. 2022 |
| Projected Shipment Growth | 38% Increase | 2024 Forecast |
| APAC Market Share | 45.9% USD 11.9 Billion | 2023 |
| Global Market Penetration | 1% of total smartphones | Latest Data |
Number of Active Android Devices
- Globally, the Android user population lies between 3.5 and 4.2 billion users, depending upon whether the calculation counts active smartphone users, other Android-enabled devices, or devices per user.
- In 2025, the number of Android smartphone users is 4.2 billion, up from 3.9 billion in 2024.
- Some sources put the figure of active users at 3.5 billion, a conservative estimate.
- The number of active Android devices exceeds 3 billion, while iPhones number 1 billion.
- The world’s number of smartphone users reaches about 4.88 billion in 2024, many of whom own more than one device.
- Active installations of Android smartphones exist in 190 countries worldwide.
Key Players in the Android Phone Market
(Reference: enterpriseappstoday.com)
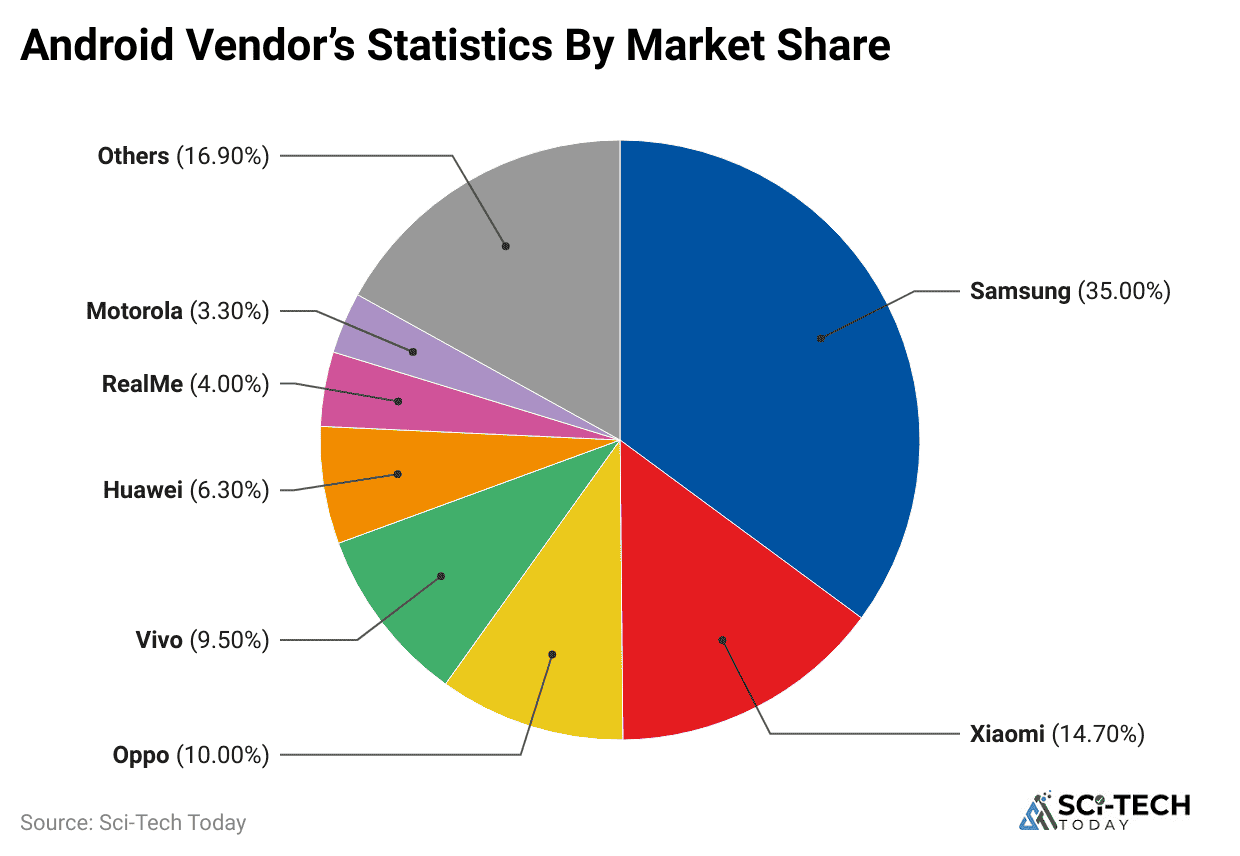
- Samsung is the perennial Android phone market leader, frequently commanding anywhere from 20% to over 30% of the global Android shipment volume, driven by its diverse portfolio spanning from the budget Galaxy A series to the premium S and Z Fold lines.
- Xiaomi has firmly established itself as the second-largest Android phone vendor, often capturing around 15-16% of the market share by excelling with high-specification, aggressively priced devices, especially in Asian and European markets.
- The Chinese manufacturers OPPO and Vivo together represent a substantial portion of the global shipments, typically contributing a combined market share of over 20% to the total Android phone volume, demonstrating powerful regional influence.
- Newer entries and established regional powerhouses like Transsion Holdings, which owns brands like TECNO and Infinix, have shown remarkable, rapid growth in emerging markets, often achieving a top 5 global ranking in quarterly shipment reports.
- Google’s own Pixel line, while highly visible for setting the pure-Android standard, holds a relatively small market share globally but continues to grow, serving as the benchmark for software and Artificial Intelligence integration across the ecosystem.
| Samsung | 25% to 30% |
| Xiaomi | 15% to 16% |
| OPPO | 10% to 12% |
| Vivo | 9% to 11% |
Android Phone Sales Statistics
(Reference: sellcell.com)
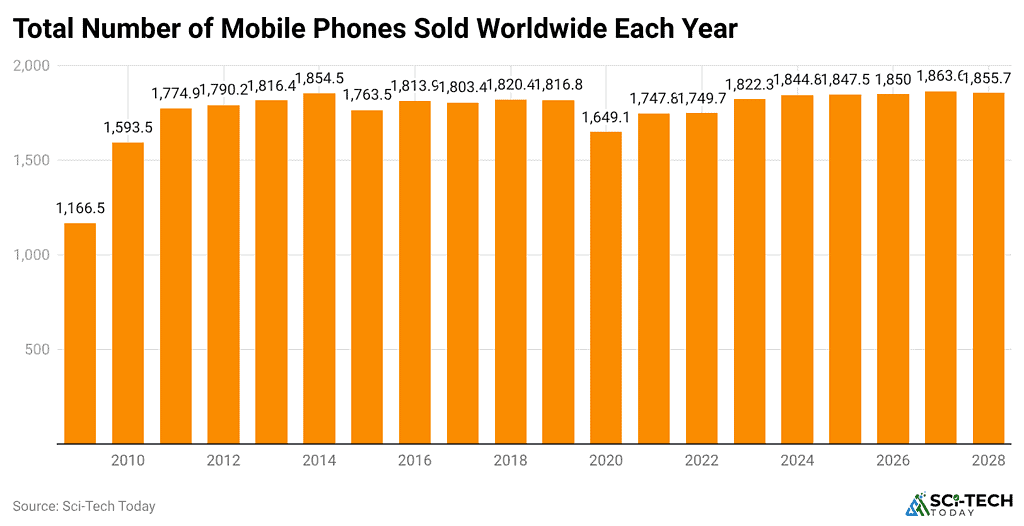
- Sales are projected to rise slightly in 2025 to 1,847.5 million units, indicating steady market stability as manufacturers continue to innovate with new features and technologies.
- By 2025, it is expected that nearly 87% of all mobile users in the United States will own a smartphone, a significant increase from the 27% of mobile users in 2010. By 2026, mobile phone sales are forecasted to reach 1,850 million units, marking a modest but consistent upward trend as global smartphone penetration continues to expand.
- In 2027, sales are expected to peak at 1,863.6 million units, representing the highest projected volume within the forecast period, likely driven by upgrade cycles and emerging market demand.
- By 2028, sales are projected to slightly decline to 1,855.7 million units, suggesting the global mobile phone market may be approaching a saturation point after years of steady growth.
Adoption Rates of Android Phone Versions
(Source: medium.com)
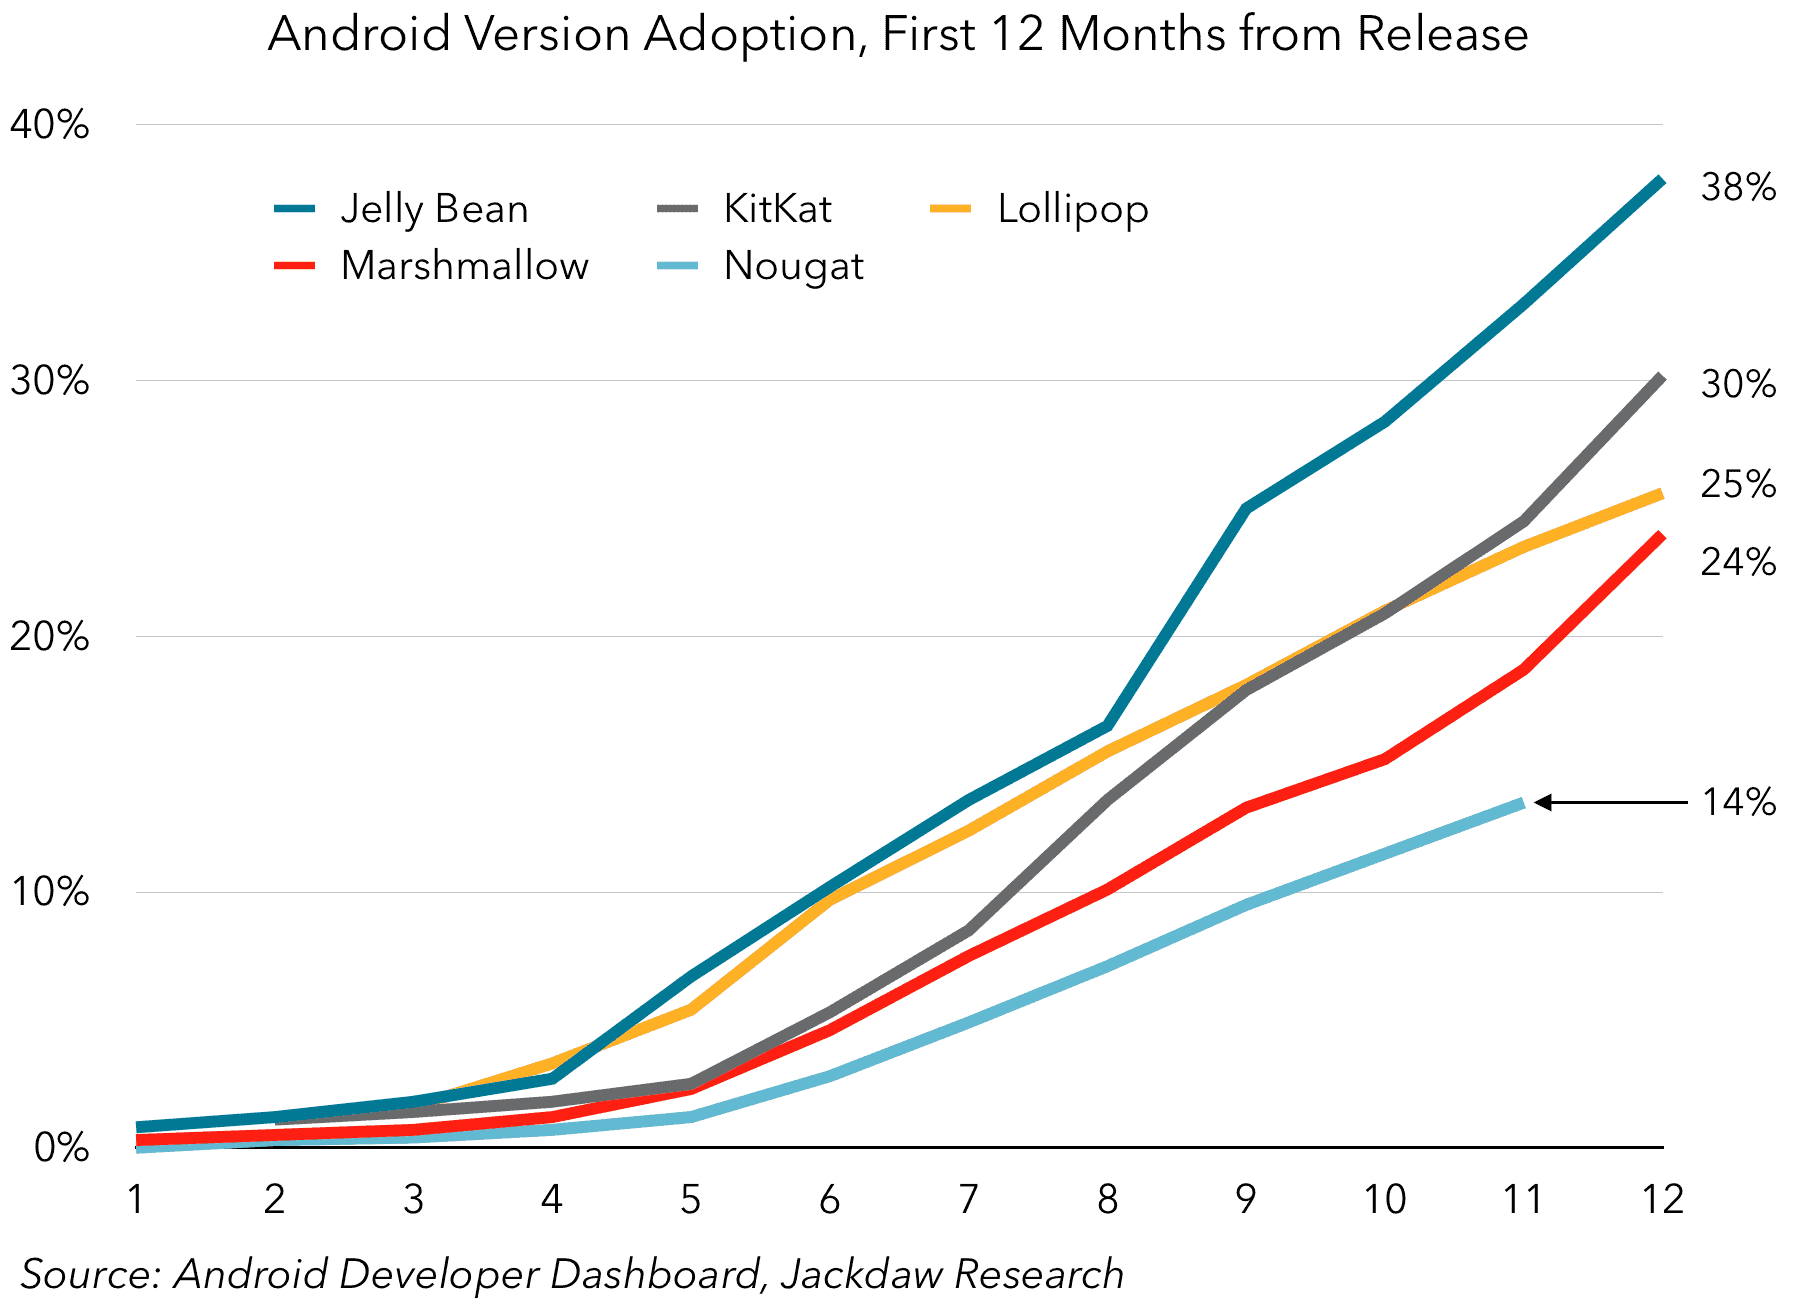
- In the most recent data cycles, newer versions like Android 15 and Android 16 have quickly climbed the ranks, with Android 15 alone capturing a notable share of over 42.87% of all active Android devices by mid-2025, showcasing faster OEM updates.
- A significant portion of the user base, however, still runs on older, highly stable versions; for example, Android 11 and Android 12 collectively maintain a substantial joint share of around 40% to 50% of the installed device base.
- The challenge of fragmentation is highlighted by the fact that even versions as old as Android 10 still account for close to 10% of active devices, posing continuous security and developer compatibility issues.
- This staggered adoption rate is directly tied to the manufacturing process, where older, cheaper Android Phones continue to be sold with older OS versions, particularly in price-sensitive markets.
- The faster uptake of the newest versions is mainly due to the flagship and premium mid-range Android Phones receiving prompt updates from manufacturers like Samsung, Google, and OnePlus within the first few months of a new OS release.
| Android 15 | 42.87% |
| Android 13 | 30.33% |
| Android 12 | 20.58% |
| Android 11 | 19.98% |
| Android 10 & Older | Approx. 19% |
iPhone vs Android Smartphone Sales by Country
- In China, the sales percentage of iPhones was 61.5%, which is slightly more than that of Android, which was 60%.
- The percentage for the US is clearly dominated by Android with 41%, while the sales percentage of iPhone stands at 17.3%.
- In India, there is dominance of Android with 95%, while iPhone’s sales percentage was 57%.
- Android dominates in two out of the three markets mentioned above.
Android App Retention Rates
(Reference: statista.com)
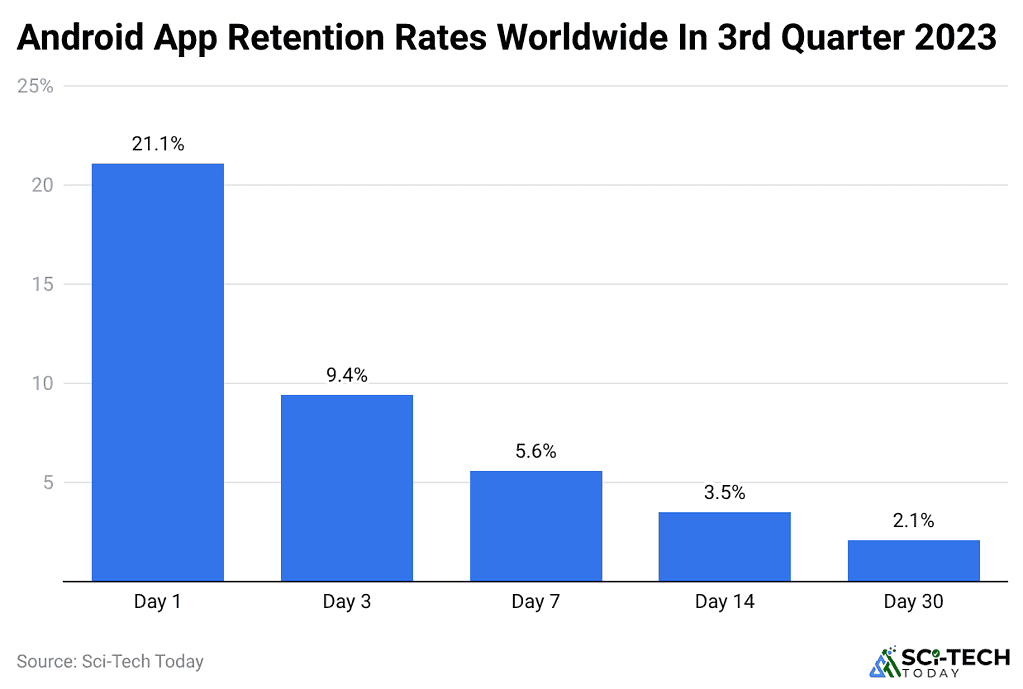
- During the third quarter of 2025, the retention rate for Android apps after 30 days from installation was approximately 2.8%, according to Android phone statistics. Retention for Android apps was around 23% just one day after download, and it dropped to about 5–6% after seven days, broadly in line with earlier benchmarks.
- As of 2025, about 96.9% of all Android apps are available for free, while only 3.1% require payment. Android phone statistics also show that the number of free apps on the Google Play Store has consistently remained higher than the number of paid apps during the examined period.
Demographics and Regional Variations of Android Phone Users
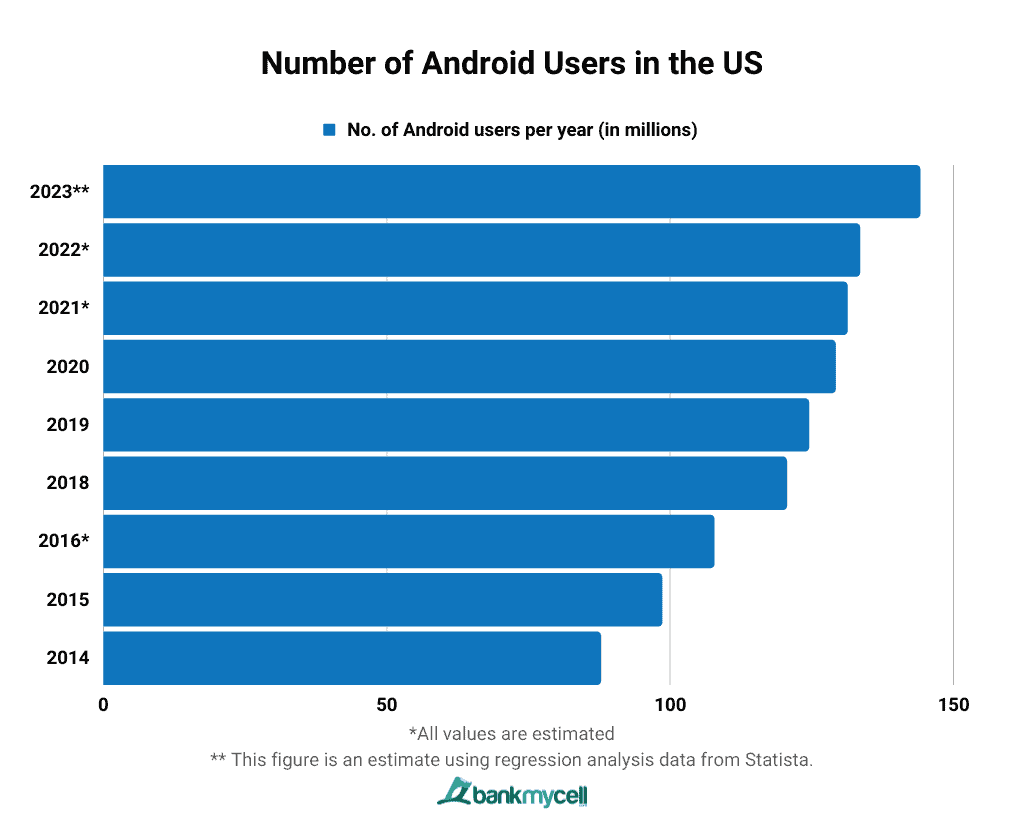
- Globally, Android Phones attract a significant skew toward a younger user base, with individuals aged 18 to 24 being the largest segment, often accounting for approximately 70% of all platform users in demographic surveys.
- The gender distribution shows a slight, but consistent, male bias, with roughly 57% of all Android users identifying as male, compared to 43% who identify as female, a pattern that holds across multiple international surveys.
- In the United States, there’s an interesting age crossover: the 45 to 54 age group shows a near-even split between iOS and Android, whereas the 55 and older demographic shows a clear preference for iPhones.
- The affordability factor of Android Phones is an important one in emerging economies, since in such regions the market share of the operating system may even exceed 85%, especially in heavily populated nations like India and Brazil, serving as a portal to the World Wide Web for millions.
- On the other hand, the US and Japan remain the two most lucrative markets for the iOS operating system, as the latter commands a market share of 55%-60%.
| Global | 73.9% |
| India/Brazil | 85% |
| United States | 42.51% |
| Age 18 to 24 | 70% Preference |
| Gender | 57% Male / 43% Female |
Most Downloaded Android Apps
- ChatGPT topped downloads with 52 million downloads worldwide in July 2025.
- It was followed by TikTok with 39 million and Instagram with 38 million downloads.
- Temu topped the shopping category with 27 million downloads while CapCut clocked 23 million downloads.
- ChatGPT retained its position with 52 million in April 2025, while Tinder hit 60 million downloads in total in 2024.
- TikTok, Instagram, and WhatsApp continued to dominate the list of top three global downloads in 2025.
- The social category contributed 31% of global downloads while shopping apps such as Amazon, SHEIN, and Flipkart exceeded 2 billion cumulative downloads in 2025.
Android Phone Hardware and Display Trends

(Reference: scoop.market.us)
- Qualcomm remains the undisputed king of Android Phones’ processing power, with its Snapdragon chips commanding a substantial global market share of over 60% in performance benchmarking reports, leading the high-end and premium mid-range segments.
- MediaTek is a strong contender with 21.5% global share due to its ability to produce efficient and affordable chipsets that make the cut with budget/mid-range Android smartphones.
- When it comes to memory, the demands for multitasking among consumers have taken the standards way up there: 8GB RAM is the biggest segment with more than 38.5% of the total market share, while 6GB RAM occupies about 25%.
- The premium market keeps setting benchmarks as 12GB RAM currently holds a market share of 13%, serving the avid gamers and people who run resource-intensive apps on their Android phones.
- The display technology is trending heavily toward fluidity: the high refresh rate of 120Hz now constitutes a massive 37.4% of the market, signalling a clear consumer demand for smoother scrolling and animation on modern Android devices.
| Mobile Processor Share | 60.1% | Qualcomm Snapdragon, focused on performance and flagships. |
| Dominant RAM Size | 38.5% | 8GB RAM, establishing itself as the new standard for the mid-range. |
| Leading Display Refresh Rate | 46.1% | 60Hz, still dominant due to the volume of budget Android Phones. |
| Premium Display Refresh Rate | 37.4% | 120Hz, highlighting the rapid adoption of high-quality, smooth displays. |
Android Phone Application Usage and Ecosystem Statistics
- The Google Play Store hosts well over 2.06 million apps, ensuring that the Android platform provides unparalleled choice and coverage across every possible user need or hobby.
- The consumption of entertainment and communication dominates app downloads, with platforms like TikTok leading the charge with an impressive 672 million downloads, demonstrating huge global interest.
- Social media giants like Instagram and Facebook maintain phenomenal download volumes, with Instagram boasting approximately 548 million downloads and Facebook at 449 million, underscoring their integral role in the Android experience.
- Mobile gaming is a colossal revenue driver, with a staggering 78% of the entire global mobile gaming community utilizing an Android device, a significant majority that drives over 2.2 billion active mobile gamers worldwide.
- Contrary to earlier stereotypes, older demographics are also heavily engaged: about 53% of individuals aged 45 to 54 actively participate in mobile gaming on their Android Phones, illustrating the platform’s broad appeal.
| Total Apps in the Play Store | 2.06 million |
| Leading App Download Count | 672 million |
| Mobile Gamers on Android | 78% |
| Users Who Install a Game on a New Phone | 62% |
E-commerce And Retail Sales
Online Sales Growth:
- In 2025, about 65% of Android phones are purchased online, up from 60% in 2023 and 62% in 2024, as e‑commerce reaches roughly 43% of smartphone revenue overall.
- The trend towards online purchases is expected to continue, with 65% of Android phones likely to be sold online in 2024.
Key E-commerce Platforms:
- Amazon accounts for roughly 28% of global Android phone online sales in 2025, continuing the growth from 25% in 2023 and around 27% in 2024 as its mobile commerce footprint expands.
- Flipkart (India) remains one of the key online channels for Android phones, holding roughly 32% of online Android phone sales in India in 2025, with broader Tier‑2+ city participation rising to about 40% of its smartphone shoppers.
Retail Sales:
- Brick‑and‑mortar stores still play a significant role, especially in emerging markets, contributing around 34% of Android phone sales in 2025, with the offline segment actually regaining share to about 56% of units in India in Q3 2025 even as online remains dominant in many mature markets.
- However, this share is expected to decrease slightly to 35% in 2024 as online sales continue to grow.
Security and Environmental Impact of Android Phones
(Reference: deloitte.com)
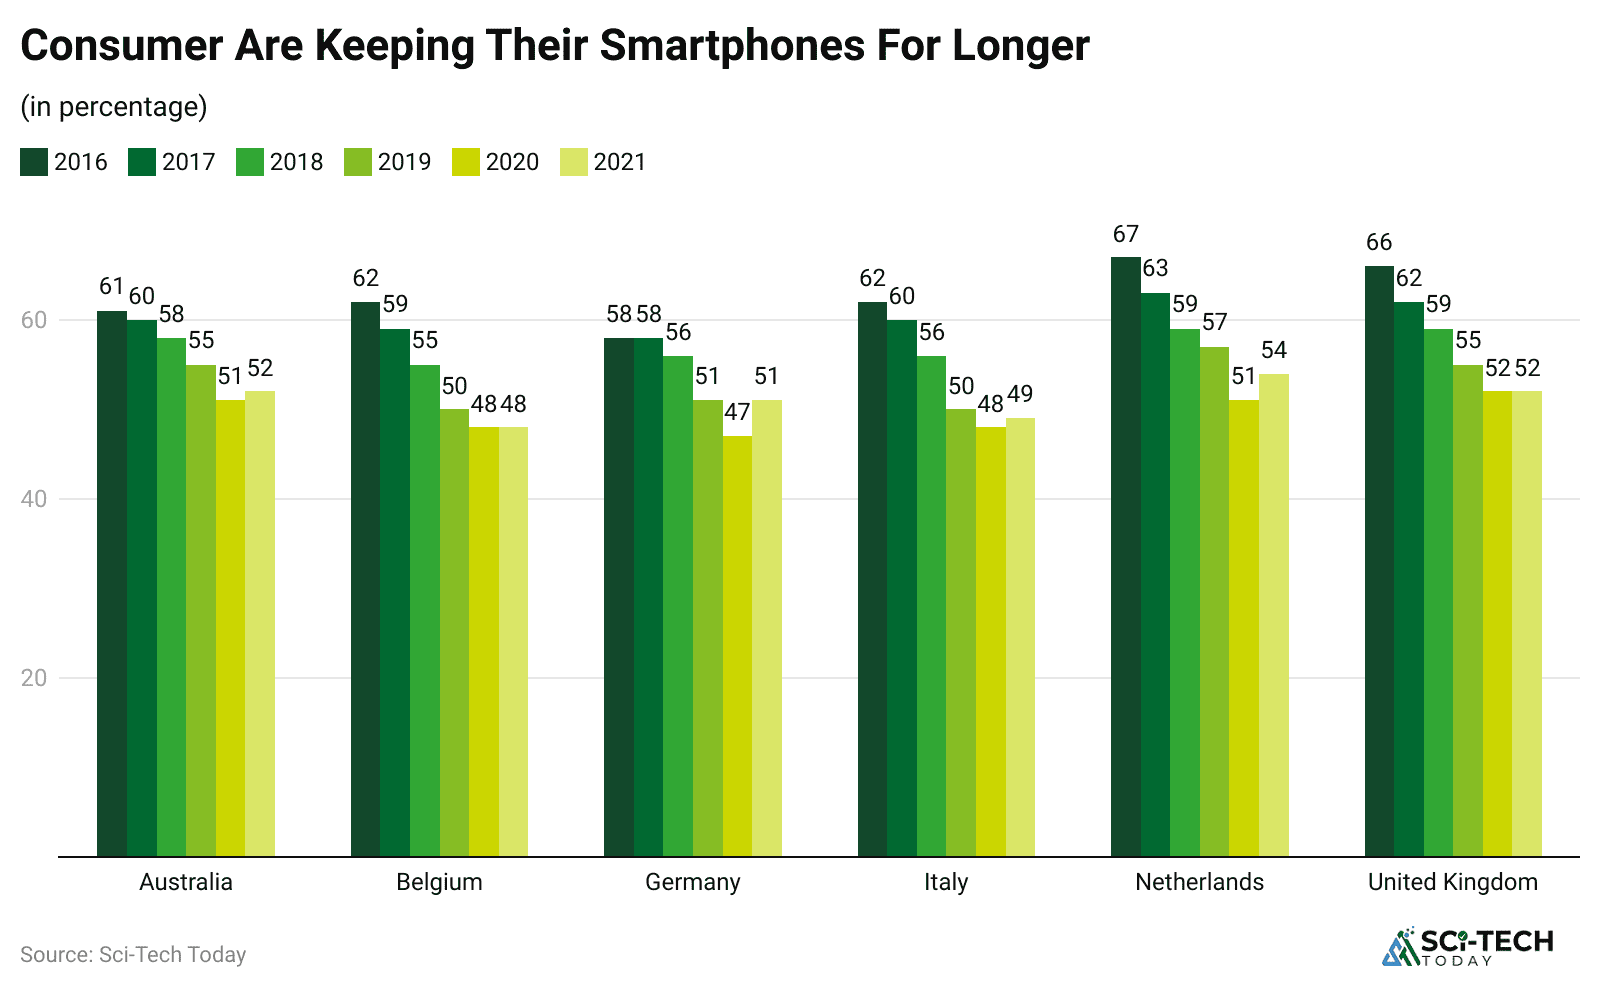
- A significant 85% of Android phone users express primary concern over understanding and configuring the privacy settings for the various Google and third-party services they use, highlighting the complexity of managing data control.
- This concern translates to high engagement with privacy-focused resources; data indicates that Android-related privacy queries consistently hold the foremost position over all other operating systems combined.
- The global installed base of Android Phones and other smartphones is expected to reach 4.7 billion by 2025, with total carbon dioxide equivalent emissions projected at approximately 125 million tons of CO2e for that year.
- A substantial 83% of these emissions come from the manufacturing and transportation of the estimated 1.4 billion new smartphones shipped annually, emphasizing the environmental impact of device turnover.
- Major Android Phone manufacturers have responded with sustainability initiatives, focusing on increasing the use of recycled materials and launching Right to Repair programs to extend device lifecycles and reduce electronic waste.
| User Privacy Concern | 85% |
| CO2e Emissions Total Smartphones, 2025 | 125 million Tons |
| Manufacturing Share of Emissions | 83% |
| Right to Repair | Legislative Action in the U. S |
Future Trends By 5G and Advanced Tech in Android Phones
(Source: polarismarketresearch.com)
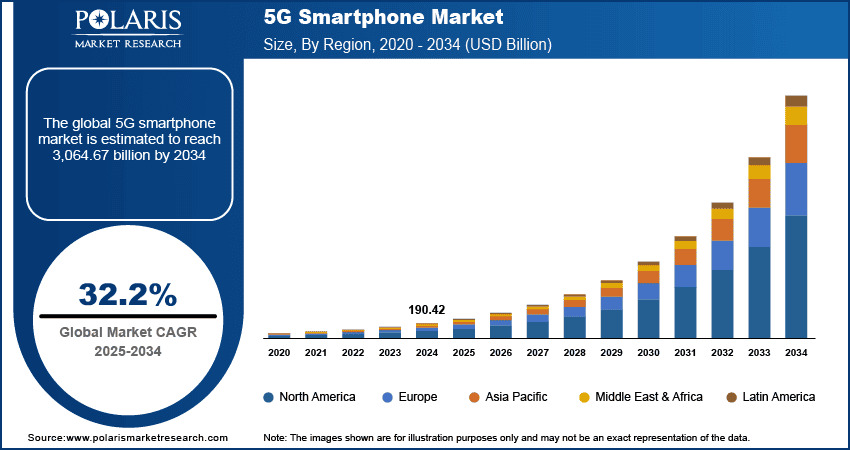
- 5G network adoption is now a dominant feature of the Android Phones landscape, with an estimated 70% of all new Android devices launched since 2023 fully supporting 5G connectivity, dramatically increasing data speeds globally.
- Countries like the United States and Japan are leading in the share of 5G-enabled connections, with 68% of their mobile connections attributed to 5G, while China leads in raw numbers with 866 million 5G mobile connections.
- The introduction of AI-powered features is no longer just a software trick; it is now driven by dedicated hardware, such as Google’s Tensor G3 chip and advanced AI engines in competitor chipsets, enhancing camera systems and on-device processing.
- The foldable display category, pioneered heavily by Android phone manufacturers like Samsung with its Galaxy Z Fold series, continues to mature and is creating a distinct, high-growth segment at the ultra-premium end of the market.
- Significant corporate funding, such as OnePlus securing USD 500 million in R&D, is being poured into enhancing the performance and features of Android devices, focusing on differentiating the user experience beyond mere specifications.
| New Devices with 5G | 70% of all new Android Phones |
| Leading 5G Market Connections | 866 million |
| Foldable Phones | Led by Samsung Z Series |
| AI Integration | Driven by Dedicated Silicon |
Ending
Overall, from this data, we can understand that Android phones are one of the most outstanding scales, with fierce competition and continuous growth. With over 3.6 billion users, a 73.9% market share, and manufacturers like Samsung driving benchmarks, Android is not just an operating system; it is the infrastructure for global mobile life.
The future of Android phones will be changed by its ability to seamlessly integrate next-generation tech like 5G, on-device AI, and advanced foldable hardware, all while addressing critical consumer concerns around data privacy and environmental sustainability. These data prove that Android is positioned to maintain its dominant global role for the foreseeable future, making it the most significant force in consumer technology today. I hope you like this content. Thanks for staying up till the end.
FAQ
The Samsung Galaxy S26 Ultra is the best overall Android phone, offering top-tier performance, an innovative privacy display, and an S Pen. Other top choices include the Google Pixel 10 Pro XL for AI and the OnePlus 15 for speed.
The top five Android phones available right now are the Samsung Galaxy S26 Ultra, Google Pixel 10 Pro XL, OnePlus 15, Samsung Galaxy Z Fold 7, and Google Pixel 10a.
Generally speaking, neither platform is completely immune to threats, but iPhones (iOS) generally offer a stronger, more consistent baseline security out of the box, while Android provides high flexibility and powerful anti-scam features that vary by manufacturer.

Sources