






Opening Remarks
OTT Platform Statistics: Over-the-top media service relates to a media service offered directly to viewers through the Internet, basically provided by third parties without the control or involvement of an Internet service provider (ISP). The term OTT is synonymous with subscription-based video-on-demand (SVOD) services that provide access to television and film content, such as Amazon Prime
OTT passes around satellite television, cable, and broadcast platforms, and the media from those organizations have traditionally acted as distributors or controllers of the content. We shall shed more light on “OTT Platform Statistics” through this article.
Editor’s Pick
- The global OTT video market is projected to generate USD 352.96 billion in revenue in 2026.
- Global OTT market revenue is expected to reach USD 482.76 billion by 2030, growing at a CAGR of 8.14%.
- The United States will remain the largest OTT market, generating USD 154.40 billion in revenue in 2026.
- Global OTT video users are forecast to reach 5.1 billion by 2030.
- OTT video penetration is expected to increase from 55.0% in 2026 to 63.0% by 2030.
- Netflix leads the industry with 325 million paid subscribers, followed by JioHotstar with 300 million in 2026.
- North America holds the largest regional OTT market share at 41%.
- Disney+ is projected to generate USD 11.4 billion in AVOD revenue by 2028, the highest among OTT platforms.
- Global consumer spending on OTT services is expected to reach USD 120.46 billion by 2027.
- People aged 18-24 years make up the largest OTT audience, accounting for 42.7% of all users.
Global OTT Video Market Revenue Statistics
- According to Statista, the global OTT video market is expected to generate USD 352.96 billion in revenue in 2026.
- The market is projected to grow at a CAGR of 8.14% from 2026 to 2030, reaching USD 482.76 billion by 2030.
- OTT video advertising will remain the largest segment, with an estimated market size of USD 236.72 billion in 2026.
- The United States is forecast to lead globally, generating USD 154.40 billion in revenue in 2026.
- The number of OTT video users is expected to reach 5.1 billion by 2030.
- User penetration is projected to increase from 55.0% in 2026 to 63.0% by 2030, while ARPU is expected to reach USD 81.44 in 2026.
OTT Ad-Supported Video Revenue Statistics
- Disney+ is projected to lead the ad-supported video-on-demand (AVOD) market with USD 11.4 billion in revenue by 2028.
- Paramount+ is expected to generate USD 5.4 billion, followed by YouTube with USD 5 billion.
- Hulu U.S. is forecast to earn USD 4.7 billion, while Netflix and Peacock U.S. are each expected to generate USD 4.6 billion.
- HBO is projected to reach USD 4.3 billion; Roku U.S., USD 3.1 billion; Pluto TV U.S., USD 3 billion; Tencent China, USD 2.3 billion; Facebook, USD 2.2 billion; and Others, USD 40 billion.
Different Types of OTT Platforms
The different kinds of OTT (Over-The-Top) platforms serve various entertainment purposes:
- Video Streaming Platforms: These are the most well-known OTT services. They let people watch a wide range of video content, like movies, TV shows, documentaries, and other on-demand videos. Usually, these services are subscription-based. Popular examples are Disney+, Hulu, and Netflix.
- Music Streaming Platforms: Platforms like Spotify and YouTube Music fit into this category. They allow users to stream music, create and listen to playlists, enjoy podcasts, and more, all online. This has greatly reduced the need for traditional physical formats like CDs. These platforms often offer personalized music experiences with custom playlists and suggestions.
- Live TV Streaming: This type of OTT service focuses on live content. Users can watch events as they happen, such as live news broadcasts, sports events like football games, and various live entertainment shows. This brings the immediacy and excitement of live TV to the Internet.
- Gaming OTT Platforms: A newer addition to the OTT world, these platforms mix traditional entertainment content with interactive gaming experiences. Users can both watch shows and play games on the same service. An example is Netflix, which launched Netflix Games in 2021, aimed at mobile users.
The rise and variety of OTT platforms show a big change in how people consume entertainment. They offer more flexibility, variety, and personalized content across different types of media.
Global OTT Market Outlook
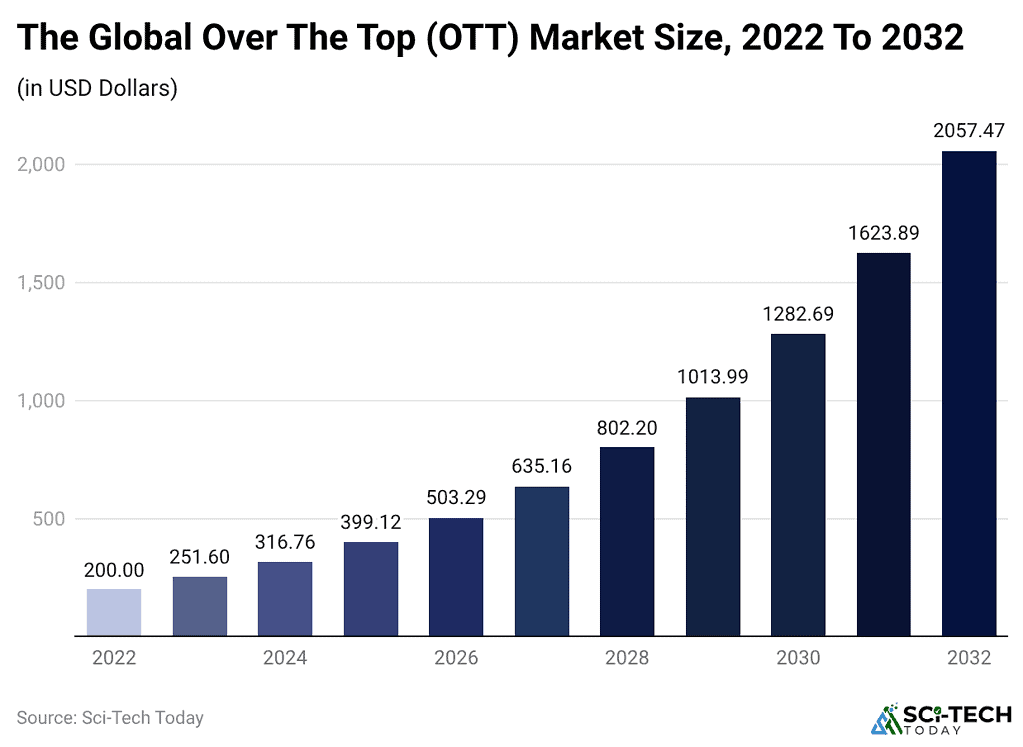
(Reference: precedenceresearch.com)
- In 2025, the market will reach USD 399.12 billion.
- In 2026, it will increase to USD 503.29 billion with steady growth.
- By 2032, it will expand significantly to USD 2057.47 billion.
Global OTT Devices and Services Market
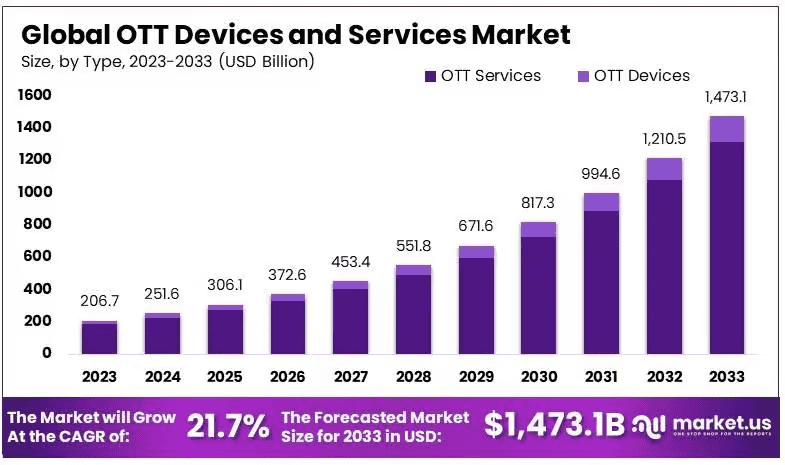
(Source: market.us)
- In 2026, the market size is projected at USD 372.6 billion.
- By 2033, the market is forecast to reach about USD 1473.1 billion, supported by a 21.7% CAGR.
United States OTT Market Share by Platform
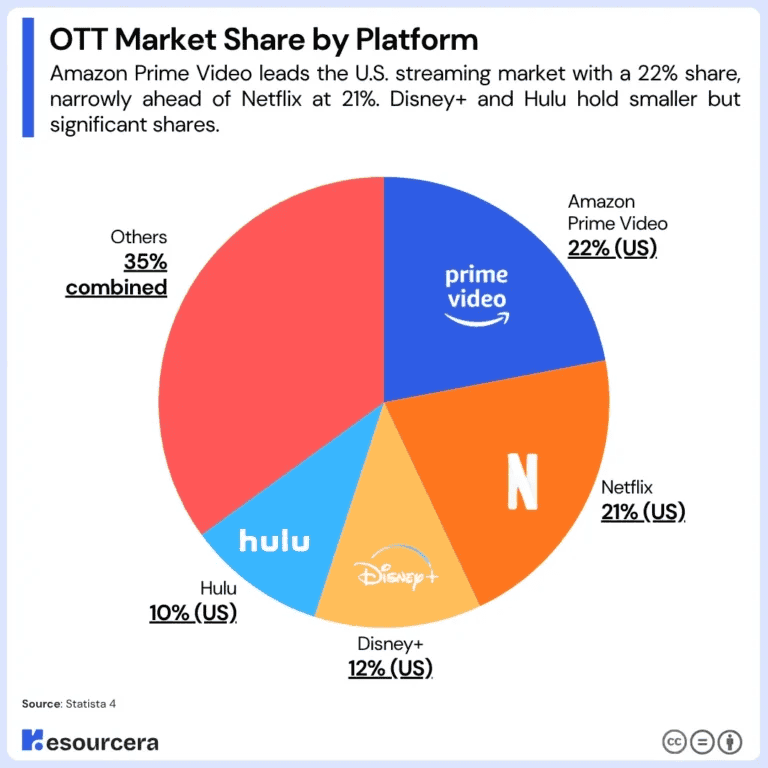
(Source: resourcera.com)
- In the U.S., Amazon Prime Video leads the OTT market with a 22% share in 2026.
- Netflix closely follows with a 21% share, confirming its strong position.
- Disney+ captures 12% market share, while Hulu holds 10% of the market.
- All other platforms together account for the remaining 35%.
OTT Market Revenue Statistics
- The global OTT video market is expected to reach USD 476 billion by 2027, doubling from USD 238 billion in 2021.
- The US makes up about 46% of this global market, as per the Global Logic survey.
- According to Statista, revenue in the OTT video market is projected to be USD 316.40 billion by 2024.
- The market is predicted to grow at an annual rate of 6.30% from 2024 to 2029, reaching USD 429.40 billion by 2029.
- The largest part of the market is OTT video advertising, which, according to OTT Platform Statistics, is expected to be worth USD 191.30 billion in 2024.
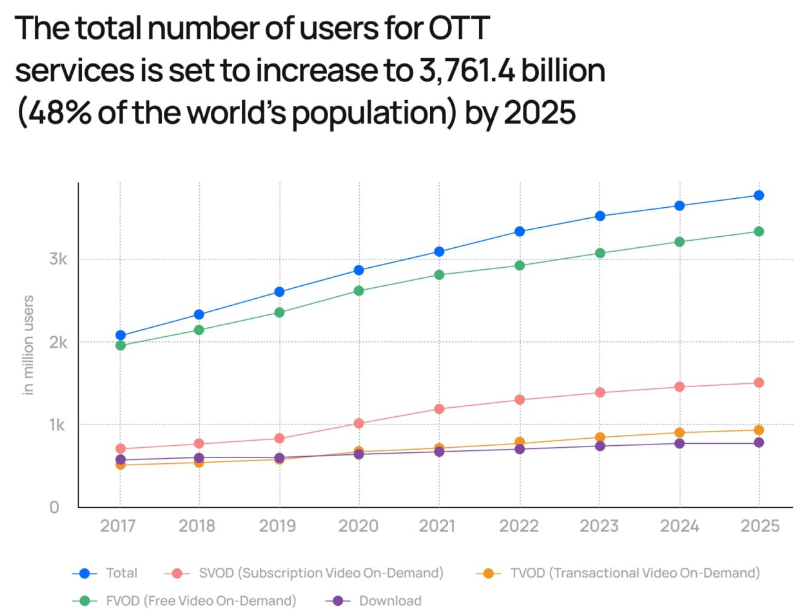
(Source: uscreen.com)
- Globally, the US is set to generate the most revenue, about USD 132.90 billion in 2024.
- The number of OTT video users is expected to hit 3.7 billion by 2025.
- User penetration is forecasted to be 60.8% in 2024 and grow to 70.1% by 2029.
- The average revenue per user (ARPU) in the OTT video market is expected to be USD 12.18 in 2024.
- OTT Platform Statistics stated that Global SVOD subscriptions are expected to grow by 321 million from 2023 to 2029, reaching 1.79 billion.
The following table shows the predicted AVOD revenue created by different countries:
| Country | AVOD Revenue |
| China | USD 7.4 billion |
| United States | USD 21.6 billion |
| Canada | USD 3.5 billion |
| India | USD 3 billion |
| Brazil | USD 2.6 billion |
| Germany | USD 2.9 billion |
| Japan | USD 2.5 billion |
| Others | USD 22.2 billion |
- The transactional video-on-demand (TVOD) market is projected to surpass USD 13 billion by 2028, with an annual growth rate of about 9%.
- According to Digital TV Research, revenue from global subscription video-on-demand (SVOD) is set to exceed USD 136 billion by 2027.
- According to OTT Platform Statistics, the ARPU for video streaming (SVOD) is projected to be USD 265.00 in 2024.
- Forbes states that a
- Almost all US consumers (99%) have at least one video streaming subscription, with an average of 2.9 subscriptions.
- China, Japan, and India are expected to lead the OTT video market in Asia-Pacific by 2027.
Regional OTT Video Market Growth Statistics
- According to Digital TV Research, OTT TV and movie revenue in the Asia-Pacific region is expected to grow by 62%, reaching USD 52 billion by 2027.
- In Latin America, OTT streaming subscribers are projected to increase from 83 million in 2022 to 139 million by 2027, reflecting a 67% growth.
- The Times of India reported that India’s OTT video user base is expected to reach 4,216.3 million by 2027, with user penetration rising to 53.0%.
- Global AVOD (Advertising Video on Demand) revenue from TV and movie streaming is forecast to reach USD 69 billion by 2029.
- According to OTT Platform Statistics, global pay TV revenue is expected to decline by USD 26 billion, falling from USD 151 billion in 2022 to USD 124 billion by 2028.
Global OTT Revenue and Consumer Spending Statistics
- Global free ad-supported streaming TV (FAST) revenue from TV series and movies is expected to grow from USD 9.06 billion in 2024 to USD 11.83 billion by 2027.
- In the United States, connected TV (CTV) advertising spending is forecast to reach USD 40.90 billion by 2027, reflecting continued growth in digital video advertising.
- According to Insider Intelligence, global OTT video subscription revenue is projected to reach USD 50.56 billion this year, up 12.5% from last year, and to rise to USD 64.12 billion by 2026.
- Global consumer spending on OTT services is expected to increase from USD 65.47 billion in 2023 to USD 78.11 billion in 2024.
- Overall OTT spending is forecast to reach USD 106.81 billion by 2026 and USD 120.46 billion by 2027.
Impact of COVID-19 on OTT Platforms
- The COVID-19 pandemic has had a big effect on the Over-The-Top (OTT) industry. When movie theatres and other entertainment places closed, people turned to streaming platforms.
- Many more people signed up for video-on-demand services during the lockdown. For example, the India Brand Equity Foundation reported that paid subscriptions to video platforms went up by 31% in just four months in 2020.
- This big increase in viewers helped the OTT market grow during the pandemic.
- As per OTT Platform Statistics, the global market size of OTT services was USD 38.77 billion in 2020.
- The market grew by 13.9% in 2020 compared to the average yearly growth from 2017-2019.
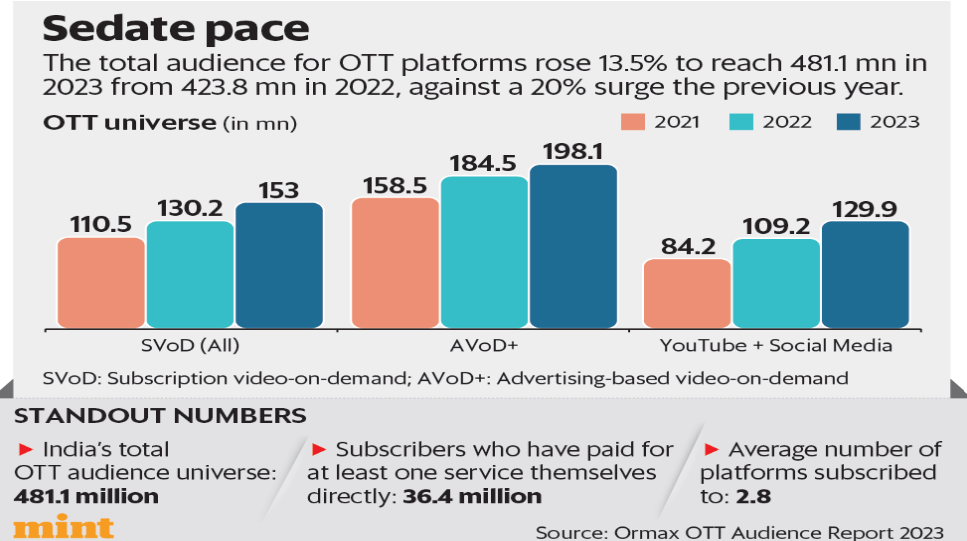
(Source: livemint.com)
- It is expected to grow from USD 44.54 billion in 2021 to USD 139.00 billion in 2028, with an annual growth rate of 17.7%.
- This growth rate will likely return to normal once the pandemic is over.
- The huge growth during the pandemic was because more people signed up for and watched different OTT streaming services.
- The market is expected to stabilize and reach USD 169.4 billion in 2023, with an annual growth rate of 14.0% from 2021.
- Revenue from the OTT industry is expected to more than double in the next four years and surpass USD 210 billion by 2026.
- According to OTT Platform Statistics, the global OTT user base is predicted to grow to 3.71 billion by 2024 from the current 3.50 billion.
- More people using internet-based communication apps will likely help the market grow. Also, more demand for online streaming content, like movies, live news, and sports, is expected to boost the market.
- In short, the COVID-19 pandemic has helped the OTT industry grow significantly. The demand for OTT services is expected to continue growing in the coming years, and more people will use these services.
Global OTT User Statistics
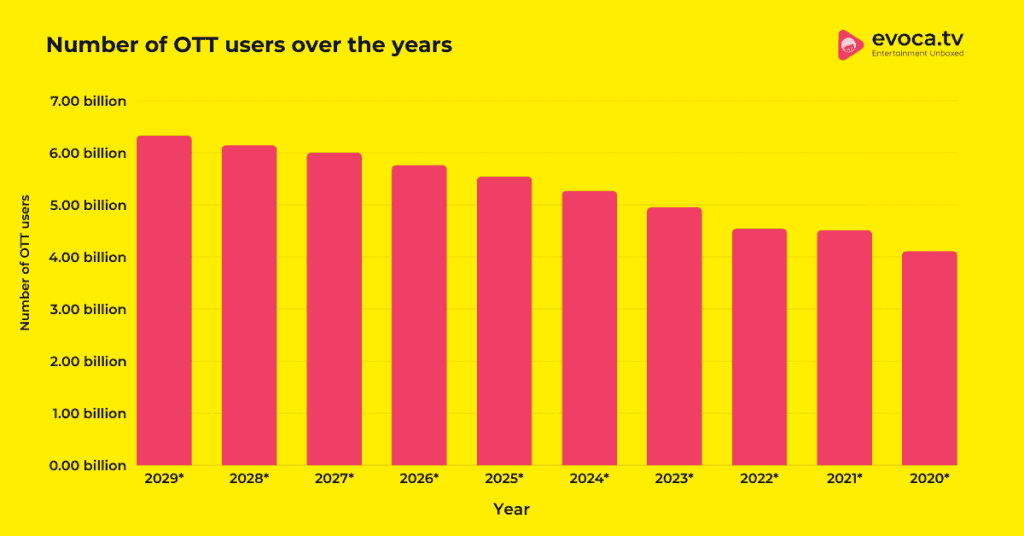
(Source: evoca.tv)
- The number of people using OTT platforms is expected to reach 5.27 billion worldwide, showing the growing popularity of online video streaming.
- OTT users increased from 4.1 billion in 2020 to 4.95 billion in 2023.
- User numbers are projected to continue rising, reaching 5.54 billion in 2025, 5.76 billion in 2026, 6.0 billion in 2027, 6.14 billion in 2028, and 6.33 billion by 2029.
Global OTT Video Penetration Statistics
- The global OTT video penetration rate is estimated at 68.07%, reflecting the increasing adoption of streaming services worldwide.
- The penetration rate was 48.28% in 2019 and increased by 6.55% in 2020.
- It reached 64.54% in 2023 and is expected to continue growing over the next few years.
- The projected penetration rates are 70.92% in 2025, 73.2% in 2026, 75.08% in 2027, 76.86% in 2028, and 78.62% by 2029.
OTT Users by Age Group Statistics
- According to Evoca.TV, people aged 18-24 years account for the largest share of OTT users at 42.7%.
- Users aged 25-29 years make up 18.4% of the OTT audience.
- Around 15% of OTT users are 17 years or younger.
- The 30-36-year age group represents 11.5% of users.
- Older age groups have lower shares: 6% of users are aged 37-45 years, and 2.1% are aged 45–54 years, indicating that younger audiences drive OTT platform usage.
OTT User Behavior and Time Spent
- Zipdo report further stated that globally, OTT users spend around 17 hours per week watching streaming content, while some estimates put daily OTT viewing at up to 5.7 hours across platforms.
- In the U.S., average OTT consumption is about 3 hours and 9 minutes per day, and adults spend roughly 40 minutes daily on Netflix, with active Netflix users averaging 63 minutes per day, as per eMarketer.
- Market Biz reported that users log in to OTT apps about 63% more often than to OTT websites and spend roughly 78% more total time on app-based OTT platforms.
- Connected and smart TVs account for about 58% of global streaming hours, while in India, the average daily time spent on OTT platforms is projected at roughly 180 minutes (3 hours).
Key Benefits of OTT Streaming Platforms
- Exclusive original content: Many OTT platforms produce original movies and TV shows that are available only on their services, helping them attract and retain subscribers.
- Affordable pricing: OTT subscriptions are generally more cost-effective than traditional cable or satellite TV, with flexible monthly and yearly plans that offer better value.
- Large content library: Users can access a wide selection of movies, TV shows, documentaries, live content, and exclusive originals to suit different interests.
- Personalized recommendations: OTT platforms use viewing history and preferences to recommend relevant content, while multiple user profiles provide customized experiences for each viewer.
- Flexible viewing: Users can stream content anytime and anywhere with an internet connection and enjoy features such as pause, rewind, and fast-forward.
- Fewer advertisements: Many OTT services provide ad-free or limited-ad plans, creating a smoother and more enjoyable viewing experience.
OTT Platform Subscribers Statistics
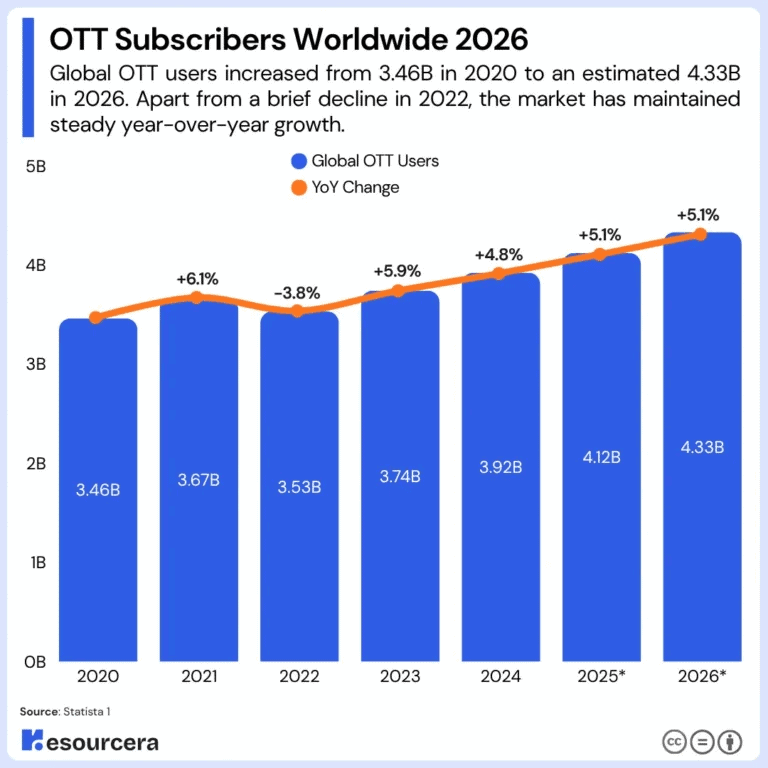
(Source: resourcera.com)
- In 2025, global OTT users will reach 4.12 billion, rising by 5.1%.
- By 2026, users will further increase to 4.33 billion, again growing by 5.1%.
Leading OTT Platforms by Paid Subscribers, 2026
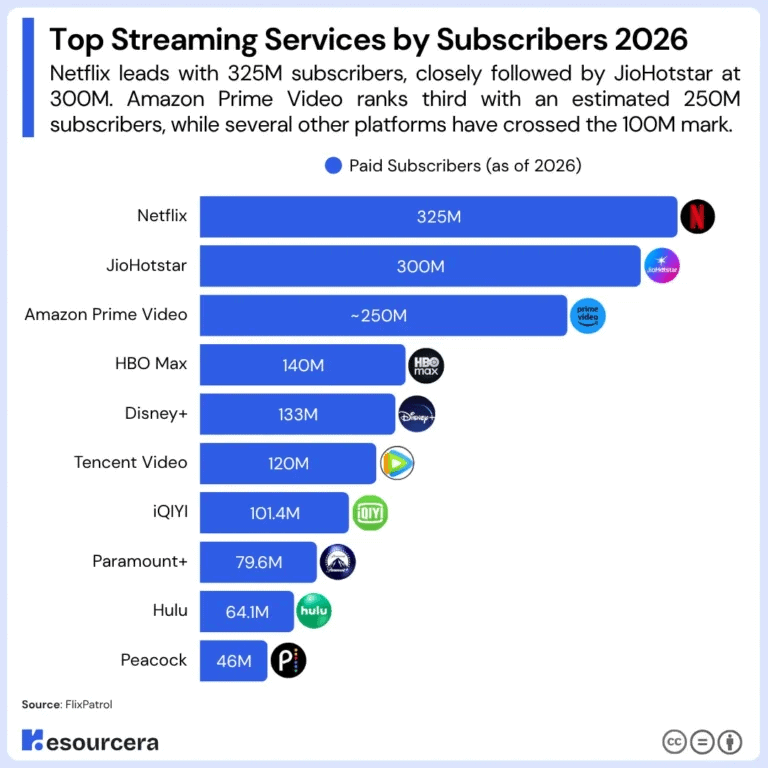
(Source: resourcera.com)
- Netflix leads the global OTT market with 325 million paid subscribers in 2026.
- JioHotstar follows with 300 million, while Amazon Prime Video has around 250 million subscribers.
- HBO Max reaches 140 million, and Disney+ has 133 million subscribers.
- Tencent Video has 120 million, iQIYI 101.4 million, Paramount+ 79.6 million, Hulu 64.1 million, and Peacock 46 million paid subscribers.
OTT Market Share by Region
- North America holds the largest OTT market share at 41%, supported by more than 310 million active users and 83% household penetration.
- Asia-Pacific accounts for 29% of the global OTT market and generates 43% of worldwide mobile streaming traffic.
- Europe represents 21% of the market, with 53% smart TV penetration and 48% of viewers using multiple devices for streaming.
- Latin America contributes 6% of the global OTT market.
- The Middle East and Africa account for 3%, with 64% smartphone penetration in urban areas driving mobile-first streaming adoption.
Major OTT Platform Monthly Subscription Costs
| OTT Platform/Plan | Monthly Cost (USD) |
| Netflix (Premium) | 19.99 |
| Hulu (Ad-free) | 17.99 |
| Max (Ad-free) | 15.99 |
| Netflix (Standard) | 15.49 |
| Disney+ (Ad-free) | 13.99 |
| Paramount+ (Ad-free) | 11.99 |
| Peacock (Ad-free) | 11.99 |
| ESPN+ | 10.99 |
| Hulu (Ad-supported) | 7.99 |
| Disney+ (Ad-supported) | 7.99 |
| Netflix (Basic with ads) | 6.99 |
| Peacock (Ad-supported) | 5.99 |
| Paramount+ (Ad-supported) | 5.99 |
| Amazon Prime Video (ad-free) | 2.99 |
Mobile App Downloads of Leading OTT Platforms
| OTT Platform | Number of Smartphone application downloads |
| DAZN | 0.71 million |
| Hulu | 1.13 million |
| Globoplay | 1.42 million |
| Youku | 1.47 million |
| Tencent Video | 2.15 million |
| HBO Max | 2.23 million |
| Crunchyroll | 3.53 million |
| iQiYi | 3.77 million |
| Amazon Prime Video | 10.2 million |
| Hotstar | 12.74 million |
| Netflix | 13.9 million |
Closing Remarks
OTT platforms have changed how people watch movies, TV shows, sports, and other video content. Better internet access, smartphones, and smart TVs continue to increase the number of streaming users worldwide. At the same time, original content, flexible subscription plans, and ad-supported services are helping the market grow.
With rising subscribers, higher consumer spending, and ongoing technology improvements, the OTT industry is expected to expand further and remain a key part of the global entertainment market.
FAQ
You can stream OTT content on smartphones, smart TVs, laptops, tablets, gaming consoles, and streaming devices.
OTT platforms earn through subscriptions, advertisements, content licensing, rentals, pay-per-view, and brand partnerships.
Yes, OTT platforms offer greater flexibility, on-demand content, and better viewing convenience.

Sources