






Beginning
Workplace Injury Statistics: Workplace Injuries can happen in any job, from offices and retail stores to construction sites and factories. Slips, falls, heavy lifting, machinery, or unsafe working conditions. They can affect an employee’s health, reduce productivity, and increase costs for businesses. Although many workplace accidents can be prevented with proper training, safety equipment, and clear safety rules, they still occur every day worldwide. Understanding the latest workplace injury statistics helps employers and employees identify common risks and take the right steps to improve workplace safety.
This article highlights the latest workplace injury statistics, common causes, high-risk industries, and practical ways to create a safer and healthier work environment.
Expert Picks
- Travelers analyzed 1.2 million+ workers’ compensation claims (2021-2025) and found injured employees now miss an average of 80 workdays despite fewer workplace injuries.
- First-year employees account for 37% of workplace injuries, 34% of claim costs, and over 5 million lost workdays.
- The ILO estimates 2.3 million work-related deaths, 340 million non-fatal workplace accidents, and 160 million work-related illness cases globally each year.
- Slips, trips, and falls cause nearly 25% of workplace injuries, while overexertion contributes another 25%.
- Contact incidents (499,270 cases), overexertion (492,140), and slips, trips, and falls (479,480) remain the leading U.S. injury categories.
- Workers aged 25-34 account for about 30% of injuries, while men represent 93% of workplace fatalities.
- Construction has the highest workplace injury costs at USD 10.4 billion, followed by professional services (USD 8.24 billion) and manufacturing (USD 7.47 billion).
- Overexertion is the costliest injury type, generating USD 13.7 billion in direct business costs annually.
- U.S. employers spend approximately USD 170 billion each year on workplace injuries, while proper PPE can prevent over 60% of injuries.
- Around 83% of employees are willing to adopt safety technologies, and the injury-prevention services market is valued at USD 0.46 billion in 2026.
Workplace Injuries Are Less Common, but Recovery Takes Longer
- Travelers’ 2026 Injury Impact Report analyzed more than 1.2 million workers’ compensation claims filed between 2021 and 2025.
- Workplace injuries are becoming less frequent, but injured employees now miss an average of 80 workdays.
- According to Cbia, employees aged 60+ account for 16% of lost-time claims and miss an average of 97 workdays, 17 days longer than the overall average. Fractures and dislocations are more common in this group.
- First-year employees are responsible for 37% of workplace injuries, 34% of total claim costs, and over 5 million lost workdays.
- New hires account for 50%+ of injuries in restaurants, nearly 50% in small businesses, and 44% in construction.
(Source: cbia.com)
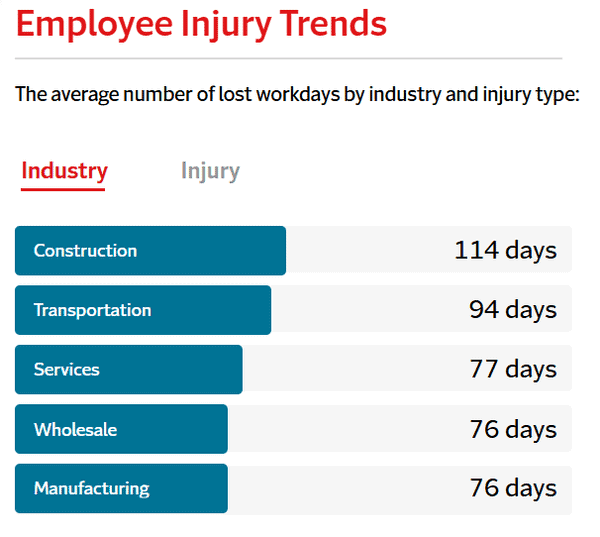
- Construction workers average 114 lost workdays, transportation 94, professional services 77, manufacturing 76, and small businesses 86.
- Slips, trips, and falls remain among the costliest incidents, with some claims exceeding USD 250,000, and they account for 39% of injuries among workers aged 60+.
Common Workplace Accidents Statistics
- According to market.biz, slips, trips, and falls cause nearly 25% of workplace injuries, while falls account for 17% of workplace deaths in the U.S. each year.
- Overexertion from lifting, pushing, or pulling is responsible for about 25% of workplace injuries.
- Being struck by moving objects contributes to 14% of workplace accidents in construction and manufacturing.
- Vehicle crashes account for around 40% of workplace fatalities in transportation and logistics.
- Machinery incidents cause about 20% of manufacturing workplace deaths.
- Repetitive strain injuries (RSIs) contribute to over 50% of musculoskeletal disorders.
- Falls from ladders, roofs, and scaffolding cause nearly 20% of construction fatalities.
- Burns account for about 5% of workplace injuries, while electrical accidents account for 2% of workplace deaths.
- Workplace violence accounts for around 10% of workplace fatalities, chemical exposure 6% of injuries, and collisions with fixed objects and same-level falls each contribute about 5% and 20% of workplace injuries, respectively.
Top Work Injury Patterns in America
(Source: nsc.org)
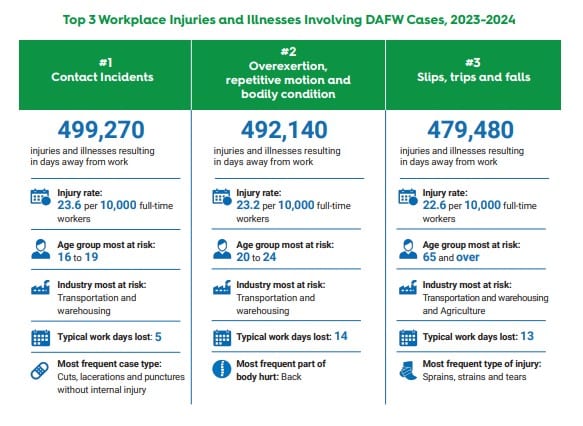
- Contact incidents cause about 499,270 cases, with an injury rate of 23.6 per 10,000 full‑time workers.
- Teen workers aged 16-19 are at the highest risk, especially in transportation and warehousing, and typically miss about 5 workdays.
- The most frequent injuries are cuts, lacerations, and punctures.
- Overexertion, repetitive motion, and bodily conditions result in 492,140 cases and an injury rate of 23.2 per 10,000 workers.
- Young adults aged 20-24 are most affected, mainly in transportation and warehousing.
- The typical absence is 14 days, and the back is the most commonly injured body part.
- Slips, trips, and falls account for 479,480 cases, at a rate of 22.6 per 10,000 workers.
- Workers aged 65 and over face the highest risk, particularly in transportation, warehousing, and agriculture.
- Usual time off is 13 days, with sprains, strains, and tears most common.
Workplace Injuries Statistics By Demographics
(Source: techreport.com)
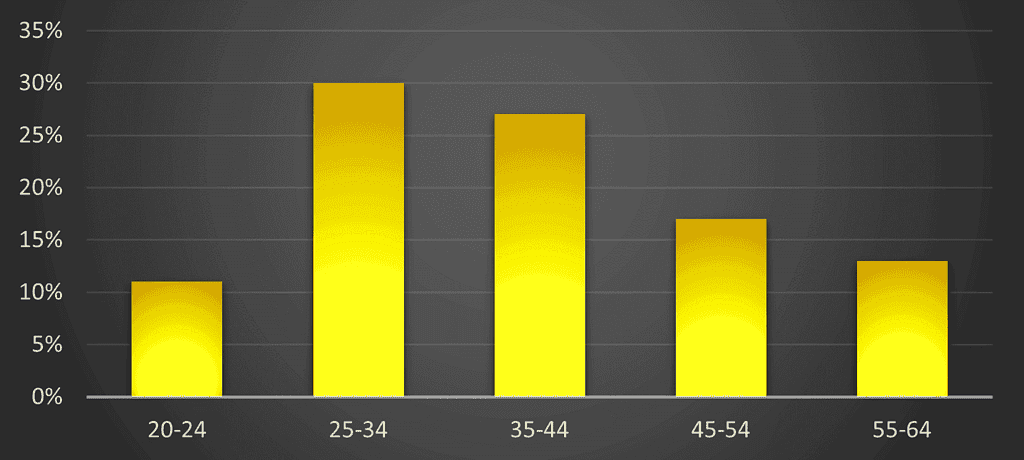
- Workers aged 25-34 face the highest share of injuries at about 30%.
- The 35-44 age group closely follows, with roughly 28% of total incidents.
- Mid‑career workers aged 45-54 and late‑career workers aged 55-64 show lower but still notable injury rates of around 18% and 14%, indicating ongoing risk across all age bands.
- Men account for 93% of workplace fatalities, with construction, manufacturing, and transportation contributing to the highest numbers.
- Around 40% of male workplace deaths occur in construction and transportation.
- Women in healthcare and service industries experience 30% of musculoskeletal injuries among female workers.
- Female office workers report 15% higher rates of repetitive strain injuries, while 60% of women in industrial jobs report ill-fitting PPE.
- Women in agriculture are 25% more likely to experience hearing loss from workplace noise.
- Gender-specific safety policies and better PPE design can reduce injuries by 20%.
Non‑Fatal Workplace Injuries in Great Britain
- Around 680,000 workers reported a non‑fatal injury in the Labor Force Survey for 2024/25.
- In the same period, employers formally recorded 59,219 non‑fatal employee injuries under RIDDOR.
Most Common Accident Types
(Reference: hse.gov.uk)
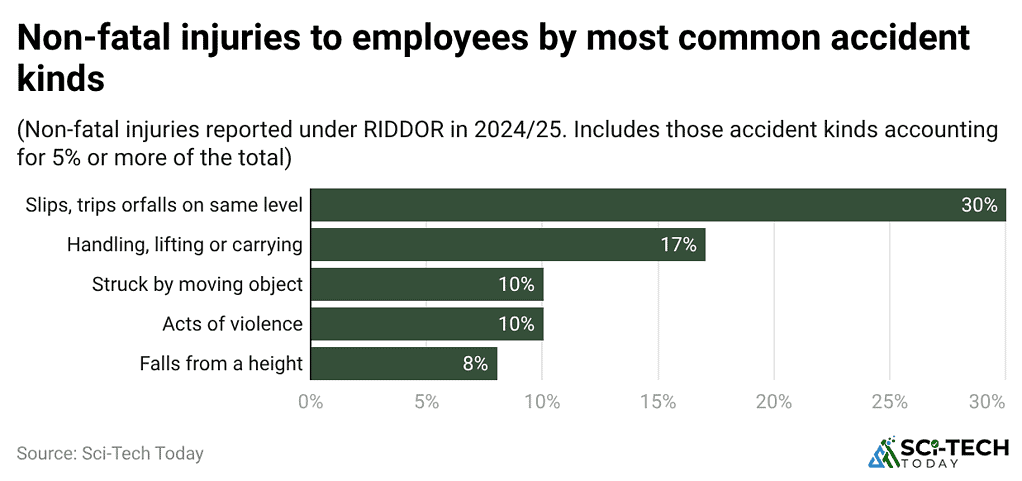
- Slips, trips, or falls on the same level are the leading cause of non‑fatal employee injuries, accounting for 30%.
- Handling, lifting, or carrying loads is the second major cause at 17%, while being struck by a moving object and acts of violence each contribute 10%.
- Falls from a height represent 8% of reported non‑fatal injuries, highlighting ongoing risks in higher‑level work activities.
Length of Absence from Work
- Self‑reported data show that around 556,000 injuries result in up to 7 days off work, indicating that many cases are short but disruptive.
- A further 124,000 injuries result in more than 7 days of absence, reflecting more serious incidents with higher productivity and cost impacts for employers.
Key Causes of Workplace Injury
(Reference: market.biz)
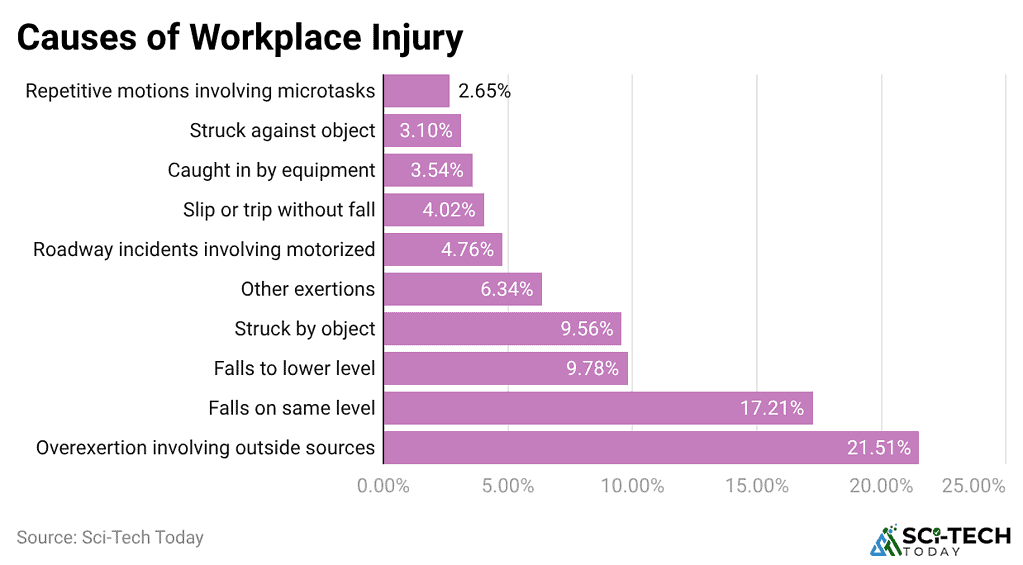
- Overexertion from outside sources is the top cause, accounting for 21.51%.
- Falls on the same level follow closely, making up 17.21%.
- Falls to a lower level represent 9.78% of reported cases.
- Workers struck by objects contribute 9.56% of injuries.
- Other exertions cause 6.34% of incidents.
- Roadway motorized incidents account for 4.76%.
- Slips or trips without a fall stand at 4.02%.
- Equipment‑related incidents reach 3.54%.
- Being struck against objects adds 3.17%.
- Repetitive microtask motions cause 2.65% of injuries.
Top 10 Most Expensive Workplace Injuries for U.S. Businesses
- According to ComplianceSigns, overexertion from lifting, pushing, pulling, carrying, or throwing is the costliest injury type, causing USD 13.7 billion in direct business costs.
- Same-level falls, such as slips on wet floors, result in USD 10.5 billion in costs.
- Struck-by-object or equipment injuries result in USD 5.8 billion in losses, while falls to lower levels cause USD 5.07 billion in losses.
- Other physical strains from bending, twisting, and reaching contribute USD 3.9 billion.
- Roadway vehicle incidents cost businesses USD 2.8 billion, and slip or trip incidents without falls add USD 2.6 billion.
- Equipment-related injuries from being caught or compressed cost USD 2.2 billion.
- Repetitive motion injuries from detailed hand and shoulder tasks account for USD 1.8 billion in costs.
- Injuries from striking fixed objects, such as doors or drawers, add USD 1.7 billion in costs.
Working Days Lost to Work‑Related Injury and Illness
(Reference: statista.com)
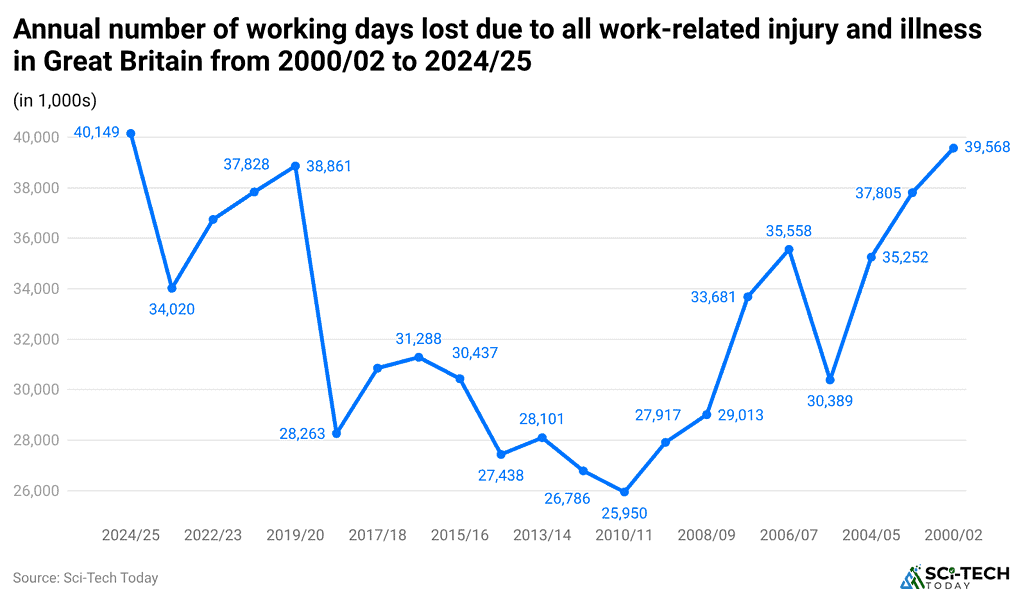
- Great Britain lost about 36,742 thousand working days in 2022/23 due to work‑related injury and illness.
- This fell to 34,020 thousand days in 2023/24 but then rose sharply to 40,149 thousand days in 2024/25, signaling renewed pressure on productivity and workforce health.
Workplace Injury Costs by Industry in the U.S.
- According to Compliance Signs, construction has the highest workplace injury costs at USD 10.4 billion.
- Professional and business services rank second, with USD 8.24 billion in injury-related costs.
- Manufacturing ranks third, down from second place, with USD 7.47 billion.
- Healthcare and social assistance report USD 6.9 billion in workplace injury costs.
- Retail records USD 5.11 billion in injury-related costs.
Workplace Injury Prevention Strategies, 2026
- Create and regularly update a workplace accident prevention plan with clear safety rules, emergency procedures, inspections, and training.
- Assess employees’ physical abilities before assigning job duties to reduce the risk of injury.
- Provide OSHA-compliant safety training and practical, hands-on exercises for high-risk situations.
- Build a safety-first culture by encouraging leadership involvement, safety committees, and near-miss reporting.
- Conduct routine workplace inspections and preventive equipment maintenance.
- Ensure employees use and maintain proper personal protective equipment (PPE).
- Make incident reporting simple through digital tools and use the data to improve safety.
- Stay up to date with OSHA and other safety regulations to maintain compliance and reduce workplace risks.
Technology and Safety Trends
- According to nsc.org, around 83% of employees are willing to use new safety technologies, including wearables, AI-powered hazard detection, and connected equipment.
- The injury-prevention services market is valued at about USD 0.46 billion in 2026 and is projected to reach USD 0.54 billion by 2030.
- 5-minute pre-shift safety talks help keep daily workplace risks top of mind.
Workplace Injury and Safety Statistics
- The ILO reports that more than 2.3 million workers die every year due to workplace accidents and diseases, while around 340 million non-fatal workplace accidents occur globally.
- Work-related diseases cause over 160 million illness cases annually worldwide.
- Slips, trips, and falls account for nearly 25% of workplace injuries, while overexertion from lifting and carrying accounts for another 25%.
- Construction workers account for about 20% of fatal workplace injuries in the U.S., despite representing only 6% of the workforce.
- The transportation and warehousing sector contributes nearly 40% of U.S. workplace fatalities.
- Safety training can reduce injuries by 50%, and proper PPE use can prevent over 60% of injuries.
- U.S. employers spend about USD 170 billion annually on workplace injuries.
- Safety audits can lower injuries by up to 20%, while companies with fewer injuries see 10%-15% higher productivity.
Workplace Safety Fines
- Average penalties include USD 7,000 for general violations, USD 25,000 for serious violations, and USD 70,000 for willful or repeat violations, according to OSHA outreach courses.
- Employers may face up to USD 15,000 per day for failing to correct violations and a minimum USD 5,000 fine for failing to report required incidents.
- OSHA’s 2025 budget totaled USD 632.3 million.
- The agency employed about 1,850 inspectors to oversee nearly 8 million workplaces and conducted 34,625 official inspections in 2025.
- Construction accounts for about 20% of all U.S. workplace fatalities.
- Workplace substance abuse is estimated to cost U.S. employers about USD 81 billion annually.
Final Thoughts
Workplace injuries can happen in any industry, but many can be prevented with the right safety measures. Regular training, proper equipment, and following safety rules help protect employees and reduce accidents. A safe workplace also improves productivity, lowers costs, and builds employee confidence.
By focusing on prevention and creating a strong safety culture, businesses can protect their workforce and ensure a healthier, safer, and more successful work environment for everyone. Invest in training, equipment, and technology designed specifically for that purpose.
FAQ
Common workplace injuries include slips, falls, strains, fractures, cuts, burns, repetitive stress injuries, and head injuries.
Seek medical care immediately, report the injury, document everything, and notify your employer promptly.
Yes, if your injury is work-related, you may qualify for workers’ compensation benefits, depending on local laws.

Sources