






Overview
Paid Holidays Statistics: Paid holidays, or Paid Time Holidays (PTO), is a policy of the human resources department that gives employees a pool of encashable hours that can be used for any reason. Also, it is known as personal time off; the abbreviation PTO is usually used to describe any period during which a worker is paid when taking leave from work.
In big companies, a PTO policy usually bundles workers’ days off, vacation time, and sick days in a particular block of hours, preferably specifying a separate number of days allowable for every reason. The PTO plans are used basically in the US, where there are no laws for minimum vacation time. We shall shed more light on the “Paid Holidays Statistics” further in this article.
Top Pick
- Employees worldwide receive 10-15 paid holidays annually, compared with 7-10 in the U.S., 30 in France, 22 in Spain, and 16 in Japan.
- Manufacturing offers the best paid holiday benefits, with 97% of employees receiving an average of 9 paid holidays each year.
- Around 97% of U.S. civilian workers receive paid leave for Thanksgiving each year.
- Workers in the Northeast region, including states such as New York and Connecticut, receive the highest average PTO at 11.4 days per year.
- In March 2026, employer compensation for U.S. civilian workers averaged USD 49.32 per hour worked.
- European employees typically receive 30-43 paid days off annually, including leave and public holidays.
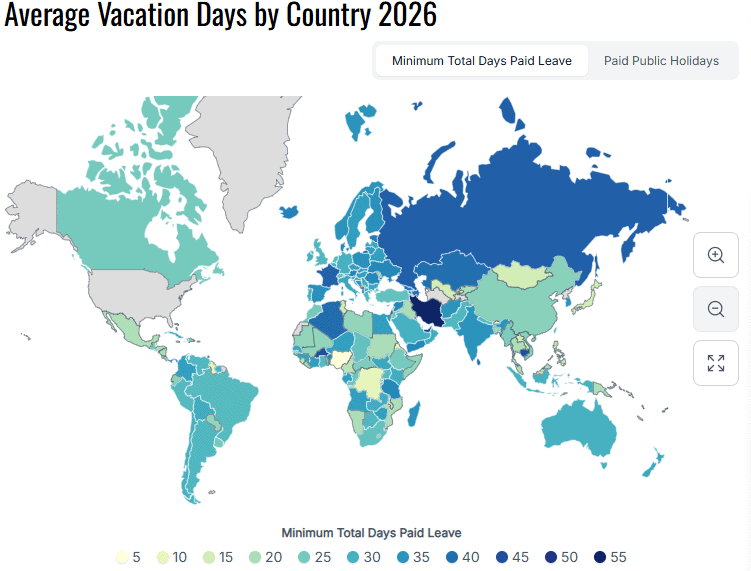
- Iran provides a minimum of 53 paid leave days annually, including 26 vacation days and 27 paid public holidays.
- In 2026, full-time employees typically receive between 6 and 10 paid holidays.
- Sweden provides 480 days of paid parental leave per child.
- Around 78% of employees say paid holidays improve productivity by helping them return to work refreshed.
Key Paid Holiday and PTO Insights
- Companies hold an average of USD 1,898 in accrued paid time off (PTO) per employee.
- About 53% of workers consider a healthy work-life balance very important, while 71% have taken a staycation, and 52% worked during their time off.
- Around 20% of employees admitted to giving management a different reason for taking leave, and 77% would prefer a pay raise over extra holiday days.
- In the U.S., 55% of employees do not use all their vacation days, while another study found 30% forfeit an average of 2-3 paid holiday days annually.
- PTO averages 17.5 days in philanthropic organizations, 8 days in small businesses, 12+ days in large companies, 12-15 days in tech, and 6-8 days in retail.
- Employees worldwide receive 10-15 paid holidays annually, compared with 7-10 in the U.S., 30 in France, 22 in Spain, and 16 in Japan.
- Remote work increased the use of floating holidays by 20%.
- Companies with unlimited PTO report 25% higher employee retention, while employees with 15+ paid holidays report 30% higher job satisfaction.
Paid Holiday Benefits by Industry
- According to Zippia, Manufacturing offers the best-paid holiday benefits, with 97% of employees receiving an average of 9 paid holidays each year.
- The Leisure and Hospitality industry provides the fewest paid holidays. Only 37% of employees receive this benefit, with an average of 6 paid holidays.
- The Information and Financial Activities sectors also perform well, as 97% of Information employees and 94% of Financial Activities employees receive paid holidays.
- Manufacturing and Financial Activities provide the highest average, offering 9 paid holidays per employee.
- Trade, Transportation, Utilities, and Construction offer moderate benefits. Employees in these industries receive an average of 7 paid holidays, with access available to 81% of Trade, Transportation, and Utilities workers and 73% of Construction employees.
Most Common Paid Holidays for U.S. Civilian Workers
| Paid Holiday | Key Statistics |
| Thanksgiving | Around 97% of U.S. civilian workers are granted paid leave. |
| Christmas | Paid time off is provided to approximately 97% of employees. |
| Independence Day (July 4) | Nearly 92% of workers receive a paid holiday. |
| Labor Day (first Monday in September) | About 91% of employees are eligible for paid leave. |
| New Year’s Day (January 1) | Close to 90% of civilian workers get paid time off. |
| Memorial Day | Roughly 90% receive paid leave, often forming a 3-day weekend. |
| Martin Luther King Jr. Day | Only 32% of workers are offered paid leave. |
| Presidents’ Day | Paid holidays are limited to 24% of employees. |
| Christmas Eve & New Year’s Eve | Fewer than 30% of workers receive paid time off. |
U.S. Employer Costs and Average Paid Holidays
(Reference: bls.gov)
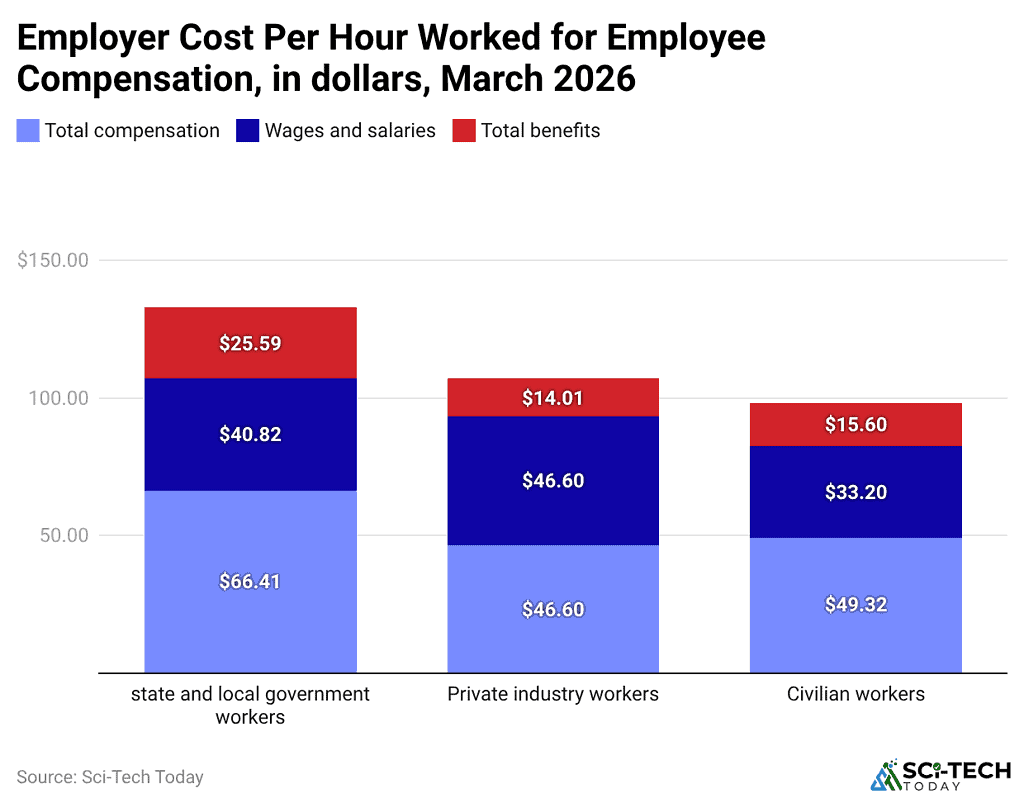
- In March 2026, employer compensation for U.S. civilian workers averaged USD 49.32 per hour worked.
- This total included average wages and salaries of USD 33.72 per hour and benefit costs of USD 15.60 per hour.
- In the private sector, employers spent USD 46.60 per hour on average. Wages and salaries accounted for USD 32.60, or 69.9%, while benefits totaled USD 14.01, representing 30.1% of total costs.
- For state and local government employees, employer compensation averaged USD 66.41 per hour. Wages and salaries totaled USD 40.82 (61.5%), while benefits averaged USD 25.59, accounting for the remaining 38.5% of total compensation.
- The U.S. does not require employers to provide paid holidays by federal law. Instead, most companies offer them as part of their employee benefits.
- Private-sector employees typically receive an average of 8 paid holidays each year, based on labor survey findings.
- Other industry reports estimate that U.S. workers receive around 10 paid holidays annually, although the total varies depending on the employer, company size, and workplace policies.
Global Paid Days Off Statistics by Region
Global Overview
- In 2026, paid days off vary widely across regions. Around 55% of countries guarantee more than 20 days of paid annual leave.
- When public holidays are included, many countries provide over 30 paid days off each year.
- The U.S. remains an exception because it has no federal requirement for paid annual leave.
Europe
- European countries offer some of the highest-paid leave benefits.
- Full-time employees typically receive 20-30 days of annual leave and 8-15 paid public holidays, totaling around 30-43 paid days.
- Austria leads with about 30 leave days and 13 public holidays, or roughly 43 paid days.
North America
- The U.S. has 0 federally mandated paid vacation days and recognizes 11 federal holidays, although private-sector benefits vary.
- In Canada, employees generally receive 10-15 vacation days and 9-10 public holidays, totaling about 19-25 paid days.
Latin America and Asia
- Latin American countries typically provide 15-30 days of annual leave and 10-15 public holidays, giving employees 25-35 paid days.
- In India, workers usually receive 12-18 days of annual leave and 14-17 paid public holidays, for a total of around 26-35 days.
- Other Asian countries commonly offer 10-15 days of annual leave and 10-15 public holidays.
Middle East and Africa
- MENA countries generally provide 21-30 days of annual leave and 10-15 public holidays, totaling 30-40+ days.
- Yemen offers one of the highest totals, with 30 leave days and 16 public holidays, for a total of 46 paid days.
- In Sub-Saharan Africa, employees typically receive 15-24 days of annual leave and 10-15 public holidays, resulting in 25-39 paid days off annually.
Average Paid Time Off (PTO) by U.S. Region
(Reference: forbes.com)
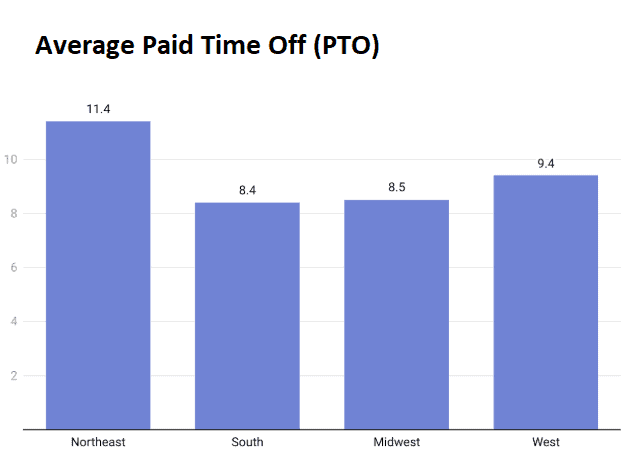
- Paid time off (PTO) benefits vary across different regions of the United States, influencing employees’ work-life balance and overall job satisfaction.
- Workers in the Northeast, including states such as New York and Connecticut, receive the highest average PTO at 11.4 days per year.
- The Western region ranks second, with employees receiving an average of 9.4 PTO days annually.
- Employees in the South, including Florida and Georgia, receive about 8.4 PTO days each year.
- The Midwest, with states such as Ohio and Michigan, offers a similar average of 8.5 PTO days per year.
Countries with the Highest Minimum Total Paid Leave
(Source: worldpopulationreview.com)
| Country | Minimum total days paid leave | Legally required minimum paid vacation days per year | Paid public holidays |
| Iran | 53 | 26 | 27 |
| Kiribati | 46 | 30 | 16 |
| Burkina Faso | 45 | 30 | 15 |
| Cambodia | 45 | 18 | 27 |
| Andorra | 45 | 31 | 14 |
| United Arab Emirates | 44 | 30 | 14 |
| Bahrain | 44 | 30 | 14 |
| Kuwait | 43 | 30 | 13 |
| Russia | 42.5 | 28.5 | 14 |
| France | 42 | 31 | 11 |
| Luxembourg | 42 | 28.5 | 11 |
| Algeria | 41 | 30 | 11 |
| Malta | 41 | 27 | 14 |
| Sri Lanka | 40 | 20 | 20 |
| Kazakhstan | 40 | 24 | 16 |
| Azerbaijan | 40 | 21 | 19 |
| Panama | 40 | 30 | 10 |
| Albania | 40 | 28 | 12 |
| Georgia | 39 | 24 | 15 |
| Estonia | 39 | 28 | 12 |
| Austria | 38 | 25 | 13 |
| Mauritius | 38 | 22 | 16 |
| Iceland | 38 | 24 | 14 |
| Denmark | 37.5 | 27.5 | 10 |
| Tanzania | 37 | 20 | 17 |
| Yemen | 37 | 22 | 15 |
| Ukraine | 37 | 24 | 13 |
| Syria | 37 | 24 | 13 |
| Romania | 37 | 20 | 17 |
| Benin | 37 | 24 | 13 |
| Lebanon | 37 | 15 | 22 |
| Marshall Islands | 37 | 26 | 11 |
| Spain | 36 | 22 | 14 |
| Poland | 36 | 23 | 13 |
| Finland | 36 | 25 | 11 |
| Armenia | 36 | 20 | 16 |
| India | 35 | 25 | 10 |
| South Korea | 35 | 20 | 15 |
| Afghanistan | 35 | 20 | 15 |
| Madagascar | 35 | 22 | 13 |
| Norway | 35 | 25 | 10 |
| Bosnia and Herzegovina | 35 | 25 | 10 |
| Djibouti | 35 | 25 | 10 |
| Egypt | 34 | 21 | 13 |
| Ivory Coast | 34 | 20 | 14 |
| Sweden | 34 | 25 | 9 |
| Slovakia | 34 | 22.5 | 11.5 |
| Lithuania | 34 | 20 | 14 |
| Gabon | 34 | 20 | 14 |
| Cyprus | 34 | 20 | 14 |
| São Tomé and Príncipe | 34 | 25 | 9 |
| Seychelles | 34 | 21 | 13 |
| Colombia | 33 | 15 | 18 |
| Angola | 33 | 22 | 11 |
| Niger | 33 | 22 | 11 |
| Zimbabwe | 33 | 22 | 11 |
| Guinea | 33 | 22 | 11 |
Paid Holiday Statistics for Full-Time Employees
- In 2026, full-time employees typically receive between 6 and 10 paid holidays, depending on factors such as job type, company size, and working hours.
- Around 1 in 4 employees, or nearly 40 million workers, do not receive paid holidays for occasions like Christmas and Thanksgiving.
- The median number of paid holidays is 6 days, while the national average is 7.6 days.
- About 21% of U.S. employees receive 6 paid holidays each year.
- Only 3% of civilian workers receive more than 14 paid holidays, making this a rare workplace benefit.
- Around 48% of companies offer floating holidays, allowing employees to choose which holiday they want to observe.
- Despite having paid time off, 46% of Americans do not use their paid holidays.
- Only 54% take time off, while 40% avoid using it because they worry about returning to a heavy workload.
Paid Holiday Statistics by U.S. Region and State
- Paid holidays such as New Year’s Day, Memorial Day, Independence Day, Labor Day, Thanksgiving, and Christmas are provided across all 50 states.
- Northeastern states, including Maine, New York, Delaware, Massachusetts, and others, offer stronger benefits, averaging about 18% above the national level.
- The U.S. average is 7.6 paid holidays annually, while Finland offers up to 30 days, highlighting a global gap.
- Fewer than 20 states recognize holidays like the day after Thanksgiving, Election Day, Christmas Eve, and New Year’s Eve.
- Juneteenth is recognized in 49 states, excluding South Dakota.
- President’s Day is observed in 41 states, while Indigenous Peoples’ Day is recognized in 24 states.
- Limited adoption includes 18 states on the day after Thanksgiving, 12 on Christmas Eve, 9 on Election Day, and 4 on New Year’s Eve.
Top Countries with the Best Maternity Leave Policies
Scandinavian Countries
- According to Native Teams, Sweden provides 480 days of paid parental leave per child.
- Each parent has 90 non-transferable days, and 390 days are paid at nearly 80% of their salary.
- Norway allows parents to choose 49 weeks at 100% pay or 59 weeks at 80% pay.
- Iceland offers 12 months of parental leave, with 6 months reserved for each parent, and part of the leave is transferable.
Western Europe
- Spain provides 17 weeks of non-transferable leave for both parents at 100% pay.
- Germany offers 14 weeks of fully paid maternity leave, followed by up to 14 months of parental allowance at around 65% of income.
- The UK provides up to 52 weeks of leave, including the first 6 weeks at 90% pay.
- From April 1, 2026, employees receive parental leave rights from their first day of work.
Asia-Pacific and Emerging Markets
- Singapore plans to offer up to 30 weeks of paid leave by April 1, 2026, including 10 weeks of shared parental leave.
- South Korea provides 90 days of maternity leave and up to 1 year of parental leave, while Japan also offers up to 1 year.
- Bulgaria offers 410 days at 90% pay, Estonia provides 140 days plus 435 shared parental leave days, and Chile grants 24 weeks of fully paid leave with an optional 12-week extension.
Impact of Paid Holidays on Employees and Businesses
- A report published by the U.S. Bureau of Labor Statistics shows that around 78% of employees say paid holidays improve productivity by helping them return to work refreshed.
- Companies with generous paid holiday policies report 25% lower employee turnover, while 20% of small businesses see higher employee loyalty.
- About 65% of employees experience lower stress, and workers with paid holidays are 40% less likely to face burnout.
- Paid holiday policies increase team morale by 30%, while 82% of job seekers consider paid leave an important factor when choosing an employer.
- Remote employees with paid holidays report 35% higher job satisfaction, and 70% prefer taking leave during festive seasons.
- Employees in the EU receive an average of 25 paid holidays each year, compared with 10 in the U.S. Meanwhile, 55% of employees do not use all their paid holidays, and holiday travel contributes around USD 160 billion annually to the travel and hospitality industry.
Summary
The majority of companies still give their workers paid holidays, even though the federal government and most states don’t require paid vacations by law. Employees in the United States generally receive 7.6 paid holidays each year. Still, this number may vary depending on the industry, state, and the number of years an employee has been in the same profession and at the same company.
In total, the United States is very behind many nations in paid vacation opportunities. This is not due to the government or companies either. The maximum number of Americans decide not to take their paid leave days. We can say that “Americans are workaholics.” We can make a statement that “Americans are workaholics”!
FAQ
If you work on a paid holiday, you may receive extra pay or a substitute day off, depending on employer policy.
No, paid holidays are generally separate from annual leave and should not reduce your vacation entitlement
Most employees receive 8 to 10 paid holidays per year, depending on their employer and country.

Sources